NOMENCLATURE
-
 $V_{eq}$
-
equivalent velocity
-
$U_{ref}$
-
incoming free-stream velocity
-
$V_{t,av}$
-
average wing-tip velocity
-
$F_{L}$
-
lift force
-
$F_{A}$
-
axial force
-
$C_{L}$
-
coefficient of lift
-
$C_{A}$
-
coefficient of axial force
-
$\rho$
-
air density
- f
-
flapping frequency
- St
-
Strouhal number
- Re
-
Reynolds number
- J
-
advance ratio


Greek symbols
-
$\alpha$
-
angle-of-attack (AoA)
-
$\phi$
-
flapping amplitude, angle the wing covers during a flapping stroke
-
$\psi$
-
span reduction angle, angle that the outer section makes with the inner section of the wing during upstroke
-
$\theta$
-
outer wing twist angle
-
$\sigma$
-
stroke ratio, ratio of upstroke to downstroke time


1.0 INTRODUCTION
Continuous efforts have been made to improve the design of UAVs so they can perform operations that would not be practical for manned aircraft. UAVs can be used for many applications, including intelligence, surveillance and reconnaissance; search and rescue; imaging and mapping; and aerial photography(Reference Valavanis and Vachtsevanos1). There are three types of such robotic flyers, using fixed, rotary and flapping wings, with UAVs of the flapping wing type being ahead in terms of efficiency and manoeuvrability. As they generate both lift and thrust only from their wings, researches have sought to design flapping UAVs based on inspiration from birds to mimic their marvellous level of efficient and agile flight.
Natural flyers including birds and insects perform both active and passive wing morphing to carry out various manoeuvres and avoid obstacles(Reference Valasek2). Like the human arm, the wing of a bird also has three joints, i.e. shoulder, elbow and wrist, all of which are controlled independently to carry out wing motions such as flapping at the shoulder joint, span reduction at the elbow joint and twisting at the wrist joint(Reference Valasek2–Reference Pennycuick4). Such wing morphing can be applied to UAVs to enhance their flight efficiency and agility(Reference DeLaurier5–Reference Chanzy and Keane7). There are three types of morphing wings: (i) non-flapping wings with active morphing, (ii) flapping wings with passive morphing and (iii) flapping wings with active–passive morphing(Reference Stowers and Lentink8). Large birds use active articulations (flapping, folding/span reduction and twisting), whereas smaller flapping organisms such as insects use passive deformation mechanisms. Hummingbirds use both active and passive control of their wings to achieve desired deformed wing shapes. Li et al.(Reference Li, Zhao, Da Ronch, Xiang, Drofelnik, Li, Zhang, Wu, Kintscher and Monner9) reported a detailed timeline for the concept of wing morphing development. Their study included works based on wing- as well as aerofoil-level morphing. Such morphing is basically done in span/chord-wise directions by varying the camber, folding, twist and sweep. Shen et al.(Reference Shen, Avital, Paul, Rezaienia, Wen and Korakianitis10) performed wind-tunnel experiments on the low-Re aerofoil E387 and investigated the effects of the gradient of curvature of the surface on its aerodynamic performance. It was reported that improving the curvature distribution improved the aerodynamic performance of the aerofoil. The authors demonstrated an enhancement in the energy output efficiency of a 3-kW small wind turbine. Similarly, Avital et al.(Reference Avital, Korakianitis and Motallebi11) used a continuous surface curvature design approach named CIRCLE(Reference Korakianitis, Hamakhan, Rezaienia, Wheeler, Avital and Williams12) (presCrIbed suRface Curvature distribution bLade dEsign) and redesigned two standard aerofoils (the symmetric NACA0012 and asymmetric E387) to improve the aerodynamic performance of low-Re proprotors for UAVs. The study included analysis of single and co-axial proprotors. By estimating the composite efficiency and lift-to-drag ratio of the rotor, those authors showed that the performance could be improved by redesigning the blade profile for high angles of attack due to stall delay. A more promising improvement was observed for the co-axial proprotors. Amendola et al.(Reference Amendola, Dimino, Magnifico and Pecora13) developed a chord-wise cambered morphing aileron using a self-constrained, distributed, unshafted actuation concept. This morphing aeronautical structure was actuated using a servo-electromechanical actuation system to produce different aerofoil cambers and match target aerodynamic shapes. Communier et al.(Reference Communier, Botez and Wong14) designed a variable camber system by incorporating morphing on the trailing and leading edge of the wing. The design aimed for UAVs was tested in a wind tunnel, and a reduction in drag was observed. Moreover, independent aerodynamic control has been achieved by morphing the trailing edge (to control lift) and leading edge (to control stall). Lafountain et al.(Reference Lafountain, Cohen and Abdallah15) took their inspiration from natural flyers and studied a camber morphing aerofoil. The authors reported that a morphing aerofoil was more efficient than flapping for performing a manoeuvre. Grant et al.(Reference Grant, Abdulrahim and Lind16) took inspiration from the laughing gull (Larus atricilla) to develop a fixed-wing Micro Air Vehicle (MAV) with morphing wing joints. The developed vehicle achieved span reduction, twisting and sweep using a multi-joint variable approach. It could perform steep-descent, turning and crosswind-rejection flight operations by controlling the joints independently. Stowers and Lentink(Reference Stowers and Lentink8) developed a morphing flapping wing inspired by the morphology of bird and bat wings. The wing folds in and out passively. The unfolding of the hand at the outboard wing section is achieved through centrifugal acceleration during the flapping motion of the whole wing. This morphing approach eliminates the actuator requirement and reduces the weight. Raney and Slominski(Reference Raney and Slominski17) developed a vibratory resonant mechanism using two electrodynamic shakers to replicate hummingbird wing motions. The shoulder joint was made using a three-Degree of Freedom (DOF) pinned ball and socket configuration. The authors also fabricated hummingbird-inspired flapping wings using carbon fibre–epoxy composite as the skeleton with a latex skin. They could passively achieve hummingbird-like wing motions including figure-of-eight and reverse camber. Kumar et al.(Reference Kumar, Pawar, Singh, Kamle and Mohite18) developed a carbon nanotube (CNT)-based nanocomposite flapping wing inspired by hummingbirds that showed passive bending–twisting deforming behaviour at its fundamental resonance frequency. In other research, Kumar et al.(Reference Kumar, Mohite and Kamle19) used the CNT-based nanocomposite to develop dragonfly-inspired flapping wings which also, like a natural dragonfly wing, showed passive bending with high amplitude at resonance. Yoon et al.(Reference Yoon, Kang and Jo20) developed an active flapping and twisting mechanism for artificial wings by providing the control mechanism at the wing root. They measured the effect of the wing-twist angle on the vertical force generated by a flapping-wing MAV. They reported that increasing the twist angle proportionally increases the average vertical force.
While many researchers have explored bio-inspired flapping wings of birds or insects of various sizes, such studies primarily pertain to passive wing deformations, while limited work has been carried out on wings with active articulations that are similar to those of birds. Feshalami et al.(Reference Feshalami, Djavareshkian, Yousefi, Zaree and Mehraban21) developed a flapping wing inspired by the black-headed gull with active bending/span reduction. They studied the effect of the bending angle, flapping frequency and wind speed on aerodynamic parameters including lift and thrust. The authors reported that lift and thrust increased with bending angle and flapping frequency. Kim et al.(Reference Kim, Kim, Kim and Suk22) fabricated a gull-inspired ornithopter with wings possessing active shoulder, elbow and wrist joints. They also studied the effect of different wing shapes on thrust. The authors reported challenges in the wrist joint and could not achieve active wing twist. Ryu et al.(Reference Ryu, Lee and Kim23) developed and analysed wings with both flapping and flapping–folding motions. The authors reported an increase in lift and wing frequency due to the folding action. Guerrero et al.(Reference Guerrero, Pacioselli, Pralits, Negrello, Silvestri, Lucifredi and Bottaro24) designed gull-inspired two-section wings. They studied the aerodynamics of the model based on various flapping kinematic variables including the flapping amplitude, flapping frequency and the angle between the inner and outer sections (the span reduction angle). Send et al.(Reference Send, Fischer, Jebens, Mugrauer, Nagarathinam and Scharstein25) developed a 2m-wingspan flapping-wing UAV called the SmartBird. The wing was made with an artificial servo-controlled hinged joint that provided active torsion to the outer section of the wing. The model showed high aerodynamic efficiency in both tethered and free flight tests. Jiang et al.(Reference Jiang, Zhou and Xie26) designed a seagull-inspired flapping wing with three joints and two sections. Their kinematic study verified the flapping, span reduction and twist motions produced by the wing. From a theoretical perspective, Karimian and Jahanbin(Reference Karimian and Jahanbin27) developed a bond graph-based model to analyse a two-section flapping wing. The authors showed that the performance of the designed articulated wing model could be improved by changing the phase in flapping, second-part stiffness, flapping amplitude, frequency and wind speed. It was also reported that the use of reverse-phase flapping and variation of the angle-of-attack of the outer part via the articulation function (twisting) could significantly enhance the propulsive efficiency. Considering independent control of the wings, Gerdes et al.(Reference Gerdes, Holness, Perez-Rosado, Roberts, Greisinger, Barnett, Kempny, Lingam, Yeh and Bruck28) developed a flapping-wing UAV model called the Robo Raven. That flapping wing system used two digital servos to independently control the wings. They reported better aerodynamic performance and enhanced agility due to the independent functionality and highly compliant nature of the wings.
Despite the wealth of studies on flapping bird flight, no flapping-wing UAV system has yet demonstrated all the flapping-wing motions with independent control similar to bird flight in nature. Clear and sufficient studies on the combined kinematic and aerodynamic performance of such models are also lacking. Such work will not only improve understanding of natural flight but also help researchers to develop efficient and agile UAVs for various applications. The aim of the work presented herein is to overcome some of these challenges through the construction of an ornithopter model. The wings of the ornithopter are developed with three joints (shoulder, elbow and wrist) to achieve active articulations. The kinematic and aerodynamic characteristics of the wings are evaluated in several configurations. The wing kinematics are obtained with the help of the Three-Dimensional (3D) DIC technique and a laser displacement sensor, whereas the aerodynamic testing is performed in a wind tunnel for various combinations of flapping parameters, wind speed and angle-of-attack. Finally, the developed robotic flapping wing UAV model is compared with a seagull, i.e. the bioinspiration. Analysis with different flight configurations is presented to illustrate how and why actual wings perform the way they do.
2.0 DESIGN AND FABRICATION
2.1 Bioinspiration
The skeleton of a bird’s wing is a structure that is lightweight but also strong enough to withstand flight. Bird wings have bones that are basically hollow with criss-crossing struts or trusses for structural strength. Birds perform active morphing with the help of bones, joints and muscles supporting the loading on the wings. The shoulder joints are used by the bird for the main flapping and control of the flapping frequency, flapping amplitude and stroke ratio. The elbow joint controls the upstroke span reduction, while the wrist joint controls the twisting of the outer section of the wing. The shoulder joint is also used to control the flapping plane. Each joint represents one DOF in the wing. Also, within each wing, each joint is independently controlled by the respective muscles for maximum flight performance at all times. This means that all three DOFs can be independently controlled per wing. This additionally leads to the total of six independently controlled kinematic variables mentioned above. This type of control leads to an ability to roll, cruise, manoeuvre and optimise its flight.
The black-headed gull (Larus ridibundus) serves as the bioinspiration for the design and analysis of the studied robotic flyer. The seagull possesses high-aspect-ratio wings with high wing loading capability and aerodynamic efficiency(Reference Dhawan3) with a 1-m wingspan. Their shape can be described as long, slender and pointed, being suitable for gliding and other flight operations. The black-headed gull had been studied extensively, such that its data and structure are known. A potential UAV of this size is appropriate for various applications as well as aerodynamic testing in wind tunnels. Liu et al.(Reference Liu, Kuykendoll, Rhew and Jones29) analysed gull wings and calculated data regarding their geometry. They studied the chord camber and thickness as a function of chord length and the chord distributions as a function of span. It was found that the average aerofoil of the black-headed gull wing is similar to the high-lift, low-Reynolds-number aerofoil S1223. The natural aerofoil even shows a similar pressure distribution when compared with S1223. Berg and Rayner(Reference Berg and Rayner30) analysed 29 bird species, including Larus ridibundus. In the construction of the current wing model, each of the joints and the corresponding DOF is mimicked, leading to a total of three DOFs per wing. The design includes the ability to independently control the wing kinematics, irrespective of the other variables for flight performance optimisation.
2.2 Design and fabrication of wings
The investigation began fundamentally with the construction of a biomimetic wing. The wing skeleton was basically designed to mimic the natural wing motion with active morphing. The black-headed gull wing, shown in Fig. 1(a), was used as a model for designing the wing skeleton. Figure 1(a) also shows the bones, joints, feathers and aerofoil representation of a typical seagull wing. Computer-Aided Design (CAD) modelling of the wing box skeleton was carried out using commercially available SolidWorks software. The wing box was manufactured using various methods such as laser cutting, abrasive water jet cutting, Computer Numerical Control (CNC) milling machine, etc. A detailed pre-fabrication analysis was done with an emphasis on the weight and inertia of the designed wing model, which should lie close to those of the original gull wing structure. The dimensions of the fabricated components were verified using high-accuracy instruments such as digital vernier caliper and micrometer. The designed model of the skeleton is shown in Fig. 1(b), depicting its various parts.

Figure 1. (a) Natural gull wing, reproduced from Ref.(Reference Liu, Kuykendoll, Rhew and Jones29), and seagull wing articulation/bone joints with cross sections
 $X_p$
and
$X_p$
and
 $X_s$
reproduced from Ref.(Reference Pennycuick4). (b) Designed wing model and its components.
$X_s$
reproduced from Ref.(Reference Pennycuick4). (b) Designed wing model and its components.
In the construction of the wing box, the aerofoil design was based on the low-Reynolds-number aerofoil S1223. They were fabricated from carbon fibre–epoxy composite sheet with thickness of 2mm. Aerofoils A1, A2, A3, A4 and A5 are located on the inboard spars S1 and S2 such that they offer a forward swept of
 $10^{\circ}$
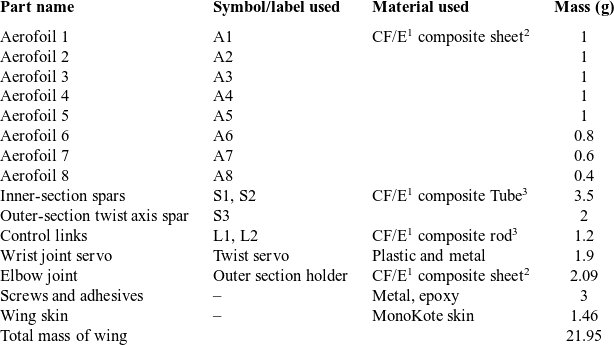
resembling that of the black-headed gull. The inboard section forms a parallelogram. The outboard section of the wing consists of three aerofoils with decreasing chord length. Aerofoils A6, A7 and A8 are not fixed to spar S3 but rather are allowed to rotate. S3 is rigidly attached to the elbow joint that hinges the two sections of the wings together, allowing the outboard section to flap. This effect occurs during the upstroke, when the span of the wing must be reduced. The wing box skeleton is covered with a MonoKote skin, applied using a heat gun to achieve a smooth three-dimensional surface around the wing. The various components of the wing along with their respective properties are listed in the wing structure matrix in Table 1.
$10^{\circ}$
resembling that of the black-headed gull. The inboard section forms a parallelogram. The outboard section of the wing consists of three aerofoils with decreasing chord length. Aerofoils A6, A7 and A8 are not fixed to spar S3 but rather are allowed to rotate. S3 is rigidly attached to the elbow joint that hinges the two sections of the wings together, allowing the outboard section to flap. This effect occurs during the upstroke, when the span of the wing must be reduced. The wing box skeleton is covered with a MonoKote skin, applied using a heat gun to achieve a smooth three-dimensional surface around the wing. The various components of the wing along with their respective properties are listed in the wing structure matrix in Table 1.
Table 1 Wing structure matrix with mass estimation
1CF/E, carbon fibre–epoxy
2Woven CF/E
3Unidirectional CF/E
Digital servos were used to actuate each joint to provide large instantaneous torques from the motors. The servos are also shown in Fig. 1(b), while their specifications are given in Table A.1. The servos operate using Pulse Width Modulated (PWM) signals. A microcontroller (Arduino board) was programmed to generate user-defined PWM signals at pre-defined time steps. The servo-controlled joints in the fabricated wing were fed sinusoidal inputs from the controller to mimic the actual wing kinematics of the black-headed gull. Proper care was taken to prevent jerks in the PWM control signals being sent to the servo motors. As shown in Fig. 1(b), both the flapping servo and span reduction servo were situated at the origin of the flapping axis and are thus not considered to form part of the wing. This joint is housed in the fuselage of the model, thereby not contributing to either the wing mass or inertia. The shoulder joint serves two functions. Firstly, it controls the main flapping action of the wing through the flapping servo. Secondly, it controls the upstroke span reduction through the span reduction servo, which is connected to a push rod via its servo arm. The other end of this push rod is connected to the acrylic elbow joint, where the servo pulls and pushes the rod to fold and unfold the span, respectively. The entire wing assembly is attached to the powerful flapping servo through an aluminium alloy servo arm. The shoulder joint also includes an acrylic housing that holds the span reduction servo. A slot inside this housing also holds S1 rigidly to the root. All the loads are transferred to the flapping servo via the acrylic fixture, which then transfers it on to the aluminium alloy arm. The wrist servo, at the tip of the wing, controls the twisting of the wing during different strokes. A8 is rigidly attached to the wrist servo, which acts as the wrist joint, free to rotate about S3 and allowing A6 and A7 to rotate co-axially. This enables the twisting of the outboard wing section, similar to the wing of a seagull when producing thrust. L1 and L2 are the control links which enable the outer section to rotate during the twisting torque generated by the wrist servo. They also allow the wing’s leading and trailing edge to maintain their shapes when the skin is attached to the model later. The collective action of all three joints enables active morphing that ultimately mimics the natural movement of a bird’s wing.
2.3 Complete robotic bird model
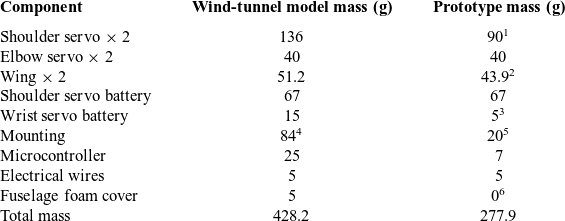
The complete set of components including the wings, servos, batteries, microcontroller and mounting wires (for wind-tunnel testing) were assembled onto a foam fuselage. A breakdown of the mass estimations for this robotic seagull, or Robogull, is presented in Table 2. The current model was constructed for wind-tunnel testing. A flying prototype projected for future work will have the weight reduction modifications described in Table 2.
Table 2 Robogull mass composition matrix
1Lighter servo with sufficient capacity.
2Wing with small size carbon fibre composite elbow joint.
3Lighter twist servo battery.
4Acrylic mounting to the test rig.
5Carbon fibre composite body.
6Covering not required with carbon fibre composite fuselage body.
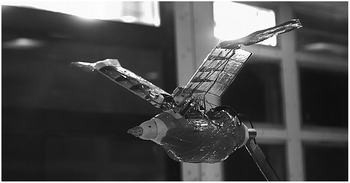
Figure 2 shows the complete Robogull model configured symmetrically about its fuselage, with both of the wings being mirror images of each other. Each joint is controlled by a servo motor, which results in a total of six servo motors for the entire model.
The allometric details of the Robogull model (the wind-tunnel model) were verified based on Pennycuick’s study of bird allometry(Reference Pennycuick4). Figure 3 shows a comparison between the Robogull and other natural birds in terms of wing area, wing span, aspect ratio and flapping frequency with the body mass. The figures illustrate that the Robogull lies in the range of parameters of the biological specimen.
The Robogull model (as well as the mass estimation for the projected prototype) is compared with the black-headed gull on the basis of their morphological and other allometric properties in Table 3. The properties of the Robogull are similar to those of its bioinspiration counterpart. The model can flap its wings at high frequency with independent control. It can perform all dominant wing motions similar to the natural flyer. Also, the total mass of the prototype model is close to that of the bird.
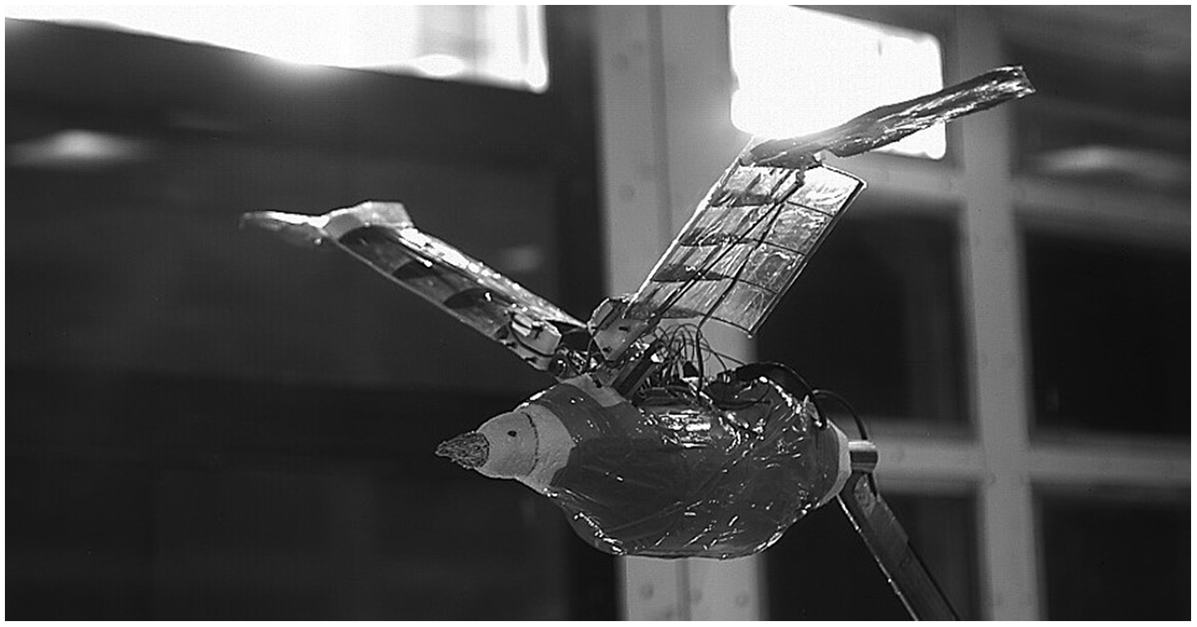
Figure 2. Robogull in flapping action during a wind-tunnel test.
Table 3 Comparison of Robogull with seagull

1For projected prototype model.

Figure 3. Allometric validation of the Robogull (the wind-tunnel model)(Reference Pennycuick4).
3.0 EXPERIMENTAL METHODS
The assembled Robogull was tested to evaluate its kinematic and aerodynamic characteristics. Kinematic testing was done to confirm that the model could achieve active wing morphing and perform natural flapping motions including inner wing flapping at the shoulder joint, span reduction at the elbow and outer wing twisting at the wrist. The effect of these wing motions on its aerodynamic performance was determined by testing the model in a wind tunnel.
3.1 Kinematics
The wing of the Robogull includes three DOFs, whose mechanical operation was verified independently and analysed experimentally using 3D DIC and a laser displacement sensor. The experimental DIC set-up, shown in Fig. 4, uses two cameras of a recording capability of 250 frames per second, both mounted on a tripod with two halogen lights. The recording was controlled using VIC-3D software installed on the computer. The actuation system consisted of the Arduino microcontroller and servo motors, moving the wing with the desired motion under the lights. The cameras capture images at 200 frames per second and load them into the software, which then computes the displacements. DIC requires a speckle pattern as it correlates the pixel intensities from one (reference) image to another (template) image. A black and white speckled pattern is required for a proper correlation. The wing was therefore painted white using a spray then marked with black dots using a marker. This was done over the entire top surface of the wing. The wing was excited at a frequency of 1Hz with a span reduction angle of 30
 $^\circ$
, twist of 35
$^\circ$
, twist of 35
 $^\circ$
, stroke ratio of 1.00 and flapping amplitude of 15
$^\circ$
, stroke ratio of 1.00 and flapping amplitude of 15
 $^\circ$
.
$^\circ$
.
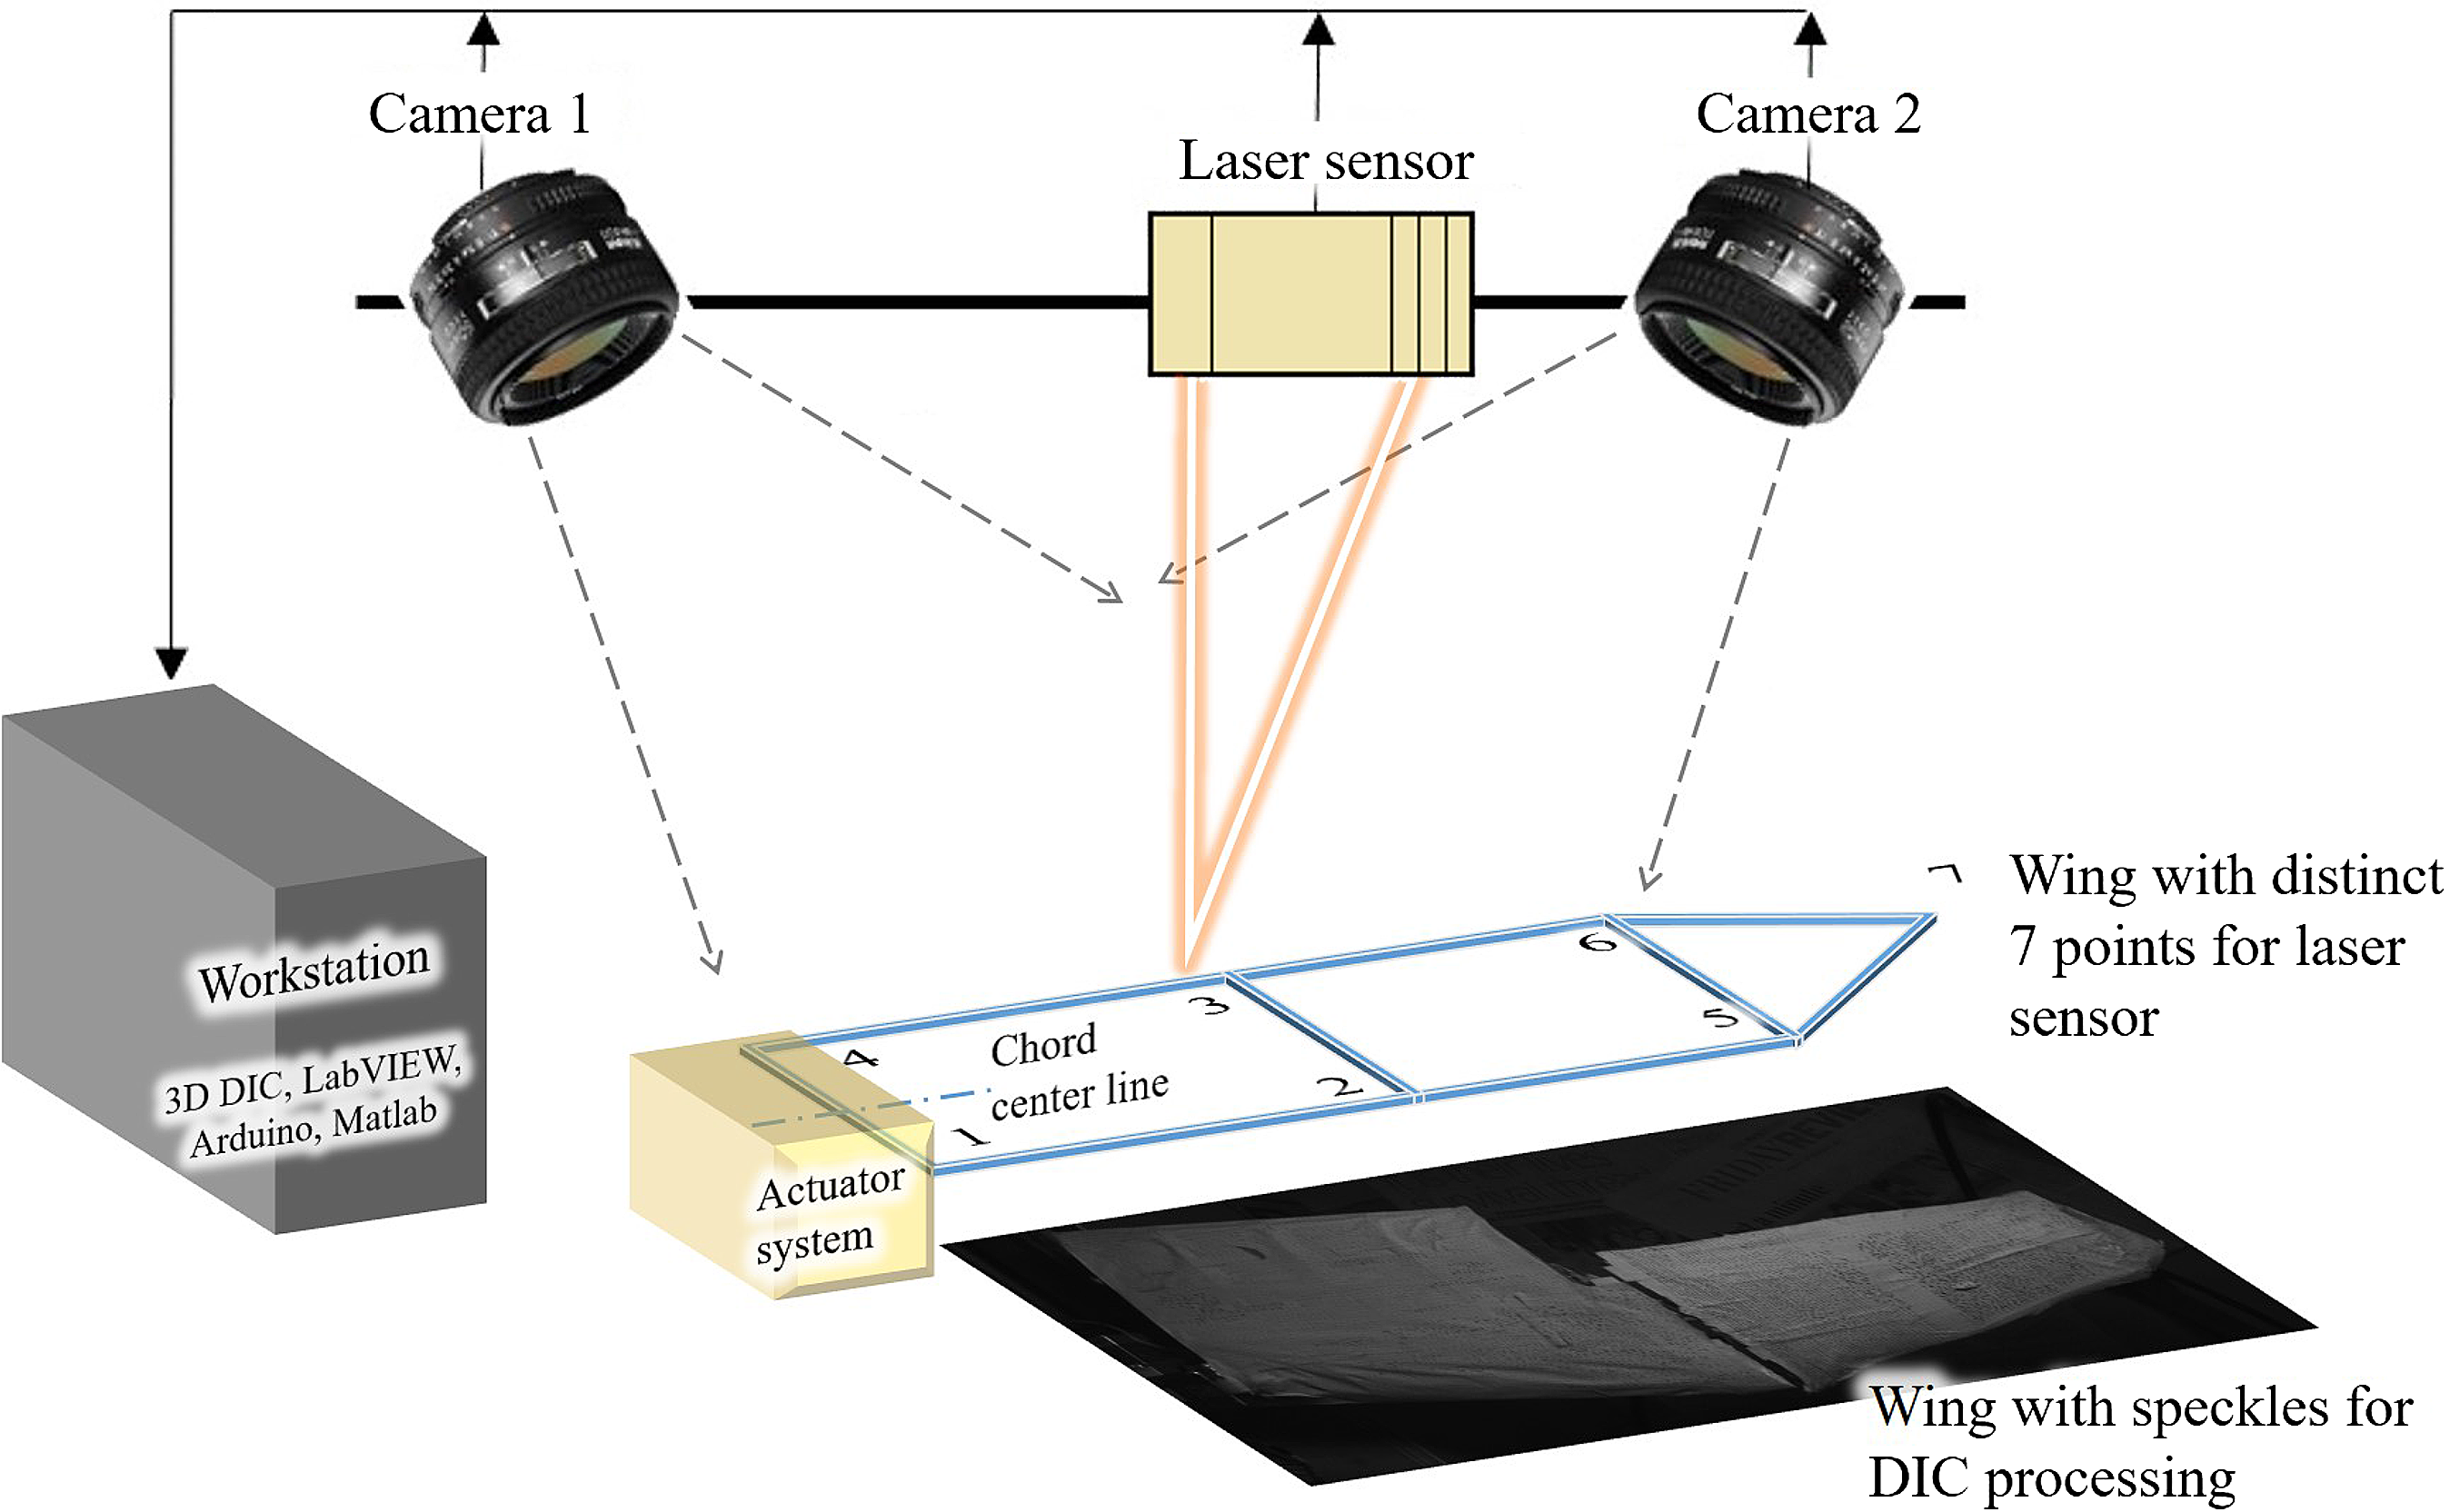
Figure 4. DIC and laser kinematic testing set-up.
A laser displacement sensor was used to measure the deflection of the wing and validate its flapping, span reduction and twisting motions. The laser displacement sensor set-up is also shown in Fig. 4. The wing is marked at seven different locations to generate the approximate wing motion. The marking is done using reflective tape to enable measurements using the laser sensor. The vertical displacement at all the points was measured individually over time, then mapped together to generate the 3D wing motion. The measurements were carried out in different configurations such as only flapping motion, flapping with span reduction and flapping with twisting. In each case, the displacement data were acquired at 500 samples per second.
3.2 Aerodynamics
Aerodynamic testing of the developed morphing-wing UAV model was carried out at the National Wind Tunnel Facility, Indian Institute of Technology Kanpur, India. This is a closed-circuit, continuous, atmospheric, low-speed wind tunnel with a test section area of 3m
 $\times$
2.25m and length of 8.75m. The facility uses a single-stage 12-bladed axial flow fan powered by a 1,000kW variable-speed Direct-Current (DC) motor, and can produce air flow speeds of up to 80m/s. The contraction ratio of the wind tunnel is 9:1. To ensure low free-stream turbulence intensity, the settling chamber of the wind tunnel is equipped with four anti-turbulence screens placed downstream of a honeycomb wall and upstream of the contraction area. The turbulence intensity (
$\times$
2.25m and length of 8.75m. The facility uses a single-stage 12-bladed axial flow fan powered by a 1,000kW variable-speed Direct-Current (DC) motor, and can produce air flow speeds of up to 80m/s. The contraction ratio of the wind tunnel is 9:1. To ensure low free-stream turbulence intensity, the settling chamber of the wind tunnel is equipped with four anti-turbulence screens placed downstream of a honeycomb wall and upstream of the contraction area. The turbulence intensity (
 $T_{U}$
) is determined at the mid-height of the test section using a single hot-wire anemometer. It is lower than 1
$T_{U}$
) is determined at the mid-height of the test section using a single hot-wire anemometer. It is lower than 1
 $\%$
at the tested wind speeds (4 and 8m/s). This value is suitable for wind-tunnel testing of low-Re aerofoils and wings(Reference Shen, Avital, Paul, Rezaienia, Wen and Korakianitis10,Reference Feshalami, Djavareshkian, Yousefi, Zaree and Mehraban21,Reference Mueller33) . The turbulence intensity was calculated as
$\%$
at the tested wind speeds (4 and 8m/s). This value is suitable for wind-tunnel testing of low-Re aerofoils and wings(Reference Shen, Avital, Paul, Rezaienia, Wen and Korakianitis10,Reference Feshalami, Djavareshkian, Yousefi, Zaree and Mehraban21,Reference Mueller33) . The turbulence intensity was calculated as
 $T_{U}(\%) = \frac{U_{RMS}}{U_{mean}} \times 100$
, where
$T_{U}(\%) = \frac{U_{RMS}}{U_{mean}} \times 100$
, where
 $U_{RMS}$
and
$U_{RMS}$
and
 $U_{mean}$
are the RMS and mean of the measured instantaneous velocity, respectively. The blockage rate (
$U_{mean}$
are the RMS and mean of the measured instantaneous velocity, respectively. The blockage rate (
 $\epsilon_{t}$
) for the present model is 1.2
$\epsilon_{t}$
) for the present model is 1.2
 $\%$
, as obtained using the simple relation
$\%$
, as obtained using the simple relation
 $\epsilon_{t} = \frac{1}{4}\frac{model\;\,frontal\;\,area}{test\;\,section\;\,area}$
given by Barlow et al.(Reference Barlow, Rae and Pope34). The testing set-up consists of a robotic arm, a sting support, a Balance-G, rear and front adapters for the load balance and the Robogull model (Fig. 5). The robotic arm is used to control the position of the model in the wind tunnel and the angle-of-attack. The sting support is mounted on the robotic arm to minimise the interference with the flow impinging on the model. The load balance is connected to the sting support through the rear adapter and to the Robogull through the front adapter, housed inside the fuselage to minimise the drag. All the loads from the model to the load balance are transferred via the front adapter. It was important for the adapter to fit properly onto both the model and the balance. An acrylic fitting built around the adapter serves as a bulkhead of the fuselage on which the microcontroller, batteries and other components are fixed and covered using a foam skin. Apart from the aforementioned hardware, a LabVIEW program was developed for data acquisition and processing. The program first acquired raw voltage data from the load balance. Offset values for the position of the centre of the load balance were input into this part of the program. Data were processed to provide forces and moments via a calibration inverse matrix. Measurements of forces and moments were obtained through a combination of the signals on the six channel, then completely decoupling the matrix. To test different flight configurations during wind-tunnel testing, the test matrix presented in Table 4 was established to indicate each of the forms, with an assigned configuration number to reflect different flapping parameters.
$\epsilon_{t} = \frac{1}{4}\frac{model\;\,frontal\;\,area}{test\;\,section\;\,area}$
given by Barlow et al.(Reference Barlow, Rae and Pope34). The testing set-up consists of a robotic arm, a sting support, a Balance-G, rear and front adapters for the load balance and the Robogull model (Fig. 5). The robotic arm is used to control the position of the model in the wind tunnel and the angle-of-attack. The sting support is mounted on the robotic arm to minimise the interference with the flow impinging on the model. The load balance is connected to the sting support through the rear adapter and to the Robogull through the front adapter, housed inside the fuselage to minimise the drag. All the loads from the model to the load balance are transferred via the front adapter. It was important for the adapter to fit properly onto both the model and the balance. An acrylic fitting built around the adapter serves as a bulkhead of the fuselage on which the microcontroller, batteries and other components are fixed and covered using a foam skin. Apart from the aforementioned hardware, a LabVIEW program was developed for data acquisition and processing. The program first acquired raw voltage data from the load balance. Offset values for the position of the centre of the load balance were input into this part of the program. Data were processed to provide forces and moments via a calibration inverse matrix. Measurements of forces and moments were obtained through a combination of the signals on the six channel, then completely decoupling the matrix. To test different flight configurations during wind-tunnel testing, the test matrix presented in Table 4 was established to indicate each of the forms, with an assigned configuration number to reflect different flapping parameters.

Figure 5. Wind-tunnel set-up used for aerodynamic testing.
Table 4 Aerodynamic testing matrix

Some important points to note regarding the wind-tunnel testing are:
-
• Data were acquired for each of the configurations for a duration of 10s upon reaching steady state.
-
• A total of six quantities of force and moment were obtained. For this investigation, the normal force, axial force and roll moment were post-processed for analysis.
-
• A zero offset reading was measured in which the complete model was installed on the balance with no free-stream velocity to nullify the effects of weight on all the readings.
-
• The model was installed without the wings and tested at free-stream velocities of 4 and 8m/s to obtain tare readings. This was done to measure the drag due to the fuselage, which was later subtracted from the axial force readings. This eliminates the differences between the natural seagull and the fuselage that housed the test components.
-
• The forces generated by a wing during flapping motion in air are a combination of aerodynamic and inertial forces. It has been reported in similar studies in the past that averaging the measured forces cancels out the contribution of inertial forces(Reference Hong and Altman35). Hu et al.(Reference Hu, Kumar, Abate and Albertani36) used an analytical model to estimate the mean inertial forces during experiments on wings flapping at different frequencies and reported that the mean inertial forces were less than 5
$\%$
of the mean aerodynamic forces. The analytical model given by Isaac et al.(Reference Isaac, Rolwes and Colozza37) relates the mean inertial force (
$\bar{F}_{inertial}$
) to the mass (M) and flapping frequency (f) of the wing as
$\bar{F}_{inertial} \propto CMf^{2}$
. In the present study, the average of the forces was obtained to estimate the time-averaged aerodynamic forces and study the effect of various flapping parameters. -
• The flapping amplitude (
$\phi$
) is the stroke angle that the wing covers during a flapping stroke. The inner part of the wing is used for the flapping amplitude calculations. -
• The span reduction angle (
$\psi$
) refers to the angle that the outer section makes with the inner section of the wing during upstroke. -
• The AoA (
$\alpha$
) is the angle-of-attack as controlled using the sting. -
• The stroke ratio (
$\sigma$
) refers to the ratio of the upstroke to downstroke time. -
• As per the sign convention used in the experiment, a positive sign for the twist angle (
$\theta$
) was taken for the pitch-down case. -
• The configurations (
$C\#$
) with
$\phi=$
45/90@inc refers to a flapping amplitude of
$45^{\circ}$
for the left wing and
$90^{\circ}$
for the right wing, inclined at a bank angle of
$20^{\circ}$
to the horizontal (right wing up) as measured along the span of the wing.


Given the lift and axial force values from the wind-tunnel load balance, the lift and axial force coefficients were computed using the following relations:
 \begin{equation} V_{eq}=\sqrt{U_{ref}^{2}+V_{t,av}^{2}}, \end{equation}
 \begin{equation} C_{L}=\frac{F_{L}}{0.5\rho V_{eq}^{2}S}, \end{equation}
 \begin{equation} C_{A}=\frac{F_{A}}{0.5\rho V_{eq}^{2}S}, \end{equation}
where
 $V_{eq}$
is the equivalent velocity in m/s,
$V_{eq}$
is the equivalent velocity in m/s,
 $U_{ref}$
is the incoming free-stream velocity in m/s,
$U_{ref}$
is the incoming free-stream velocity in m/s,
 $V_{t,av}$
is the average wing-tip velocity in one complete stroke in m/s,
$V_{t,av}$
is the average wing-tip velocity in one complete stroke in m/s,
 $F_{L}$
is the time-averaged lift force in N,
$F_{L}$
is the time-averaged lift force in N,
 $F_{A}$
is the time-averaged axial force in N,
$F_{A}$
is the time-averaged axial force in N,
 $C_{L}$
is the coefficient of lift,
$C_{L}$
is the coefficient of lift,
 $C_{A}$
is the coefficient of axial force,
$C_{A}$
is the coefficient of axial force,
 $\rho$
is the air density in kg/m
$\rho$
is the air density in kg/m
 $^3$
and S is the wing surface area in m
$^3$
and S is the wing surface area in m
 $^2$
(Reference Dhawan3,Reference Pennycuick4) . As per Fig. 6,
$^2$
(Reference Dhawan3,Reference Pennycuick4) . As per Fig. 6,
 $C_{L}>0$
when in the opposite direction to gravity (indicating a net lift force) and
$C_{L}>0$
when in the opposite direction to gravity (indicating a net lift force) and
 $C_{A}<0$
means thrust, whereas
$C_{A}<0$
means thrust, whereas
 $C_{A}>0$
indicates drag. The typical top flying speed of the black-headed gull is about 11m/s, whereas they normally fly at 6.5m/s(Reference Bruderer and Boldt32). The experiments were thus run at three free-stream velocities of 0, 4 and 8m/s, reflecting the no-wind, medium- and high-speed conditions that a seagull may experience.
$C_{A}>0$
indicates drag. The typical top flying speed of the black-headed gull is about 11m/s, whereas they normally fly at 6.5m/s(Reference Bruderer and Boldt32). The experiments were thus run at three free-stream velocities of 0, 4 and 8m/s, reflecting the no-wind, medium- and high-speed conditions that a seagull may experience.
Figure 6. Illustration of wing with flapping motion parameters.
In the present study, dimensionless numbers such as the advance ratio, J, and Strouhal number, St, are also used to support the analysis of the wind-tunnel results and evaluate the aerodynamic performance of the model and compare it with the natural flyer. These parameters are chosen due to their applicability to 3D flapping wing structures. It is important to note that these two parameters are related as
 $J = \frac{1}{2\mathrm{St}}$
. The advance ratio is defined as the ratio of the incoming free-stream velocity to the wing-tip velocity(Reference Hu, Kumar, Abate and Albertani36) and is given by
$J = \frac{1}{2\mathrm{St}}$
. The advance ratio is defined as the ratio of the incoming free-stream velocity to the wing-tip velocity(Reference Hu, Kumar, Abate and Albertani36) and is given by
 \begin{equation} J = \frac{Incoming\;\,free-stream\;velocity}{wing-tip\;velocity} = \frac{U_{ref}}{2fA}, \end{equation}
where f is the flapping frequency and A is the peak-to-peak displacement of the wing tip during a flapping stroke. In literature, the advance ratio is used to characterise the flow with
 $J<1$
and
$J<1$
and
 $J>1$
indicating unsteady and quasi-steady flow, respectively(Reference Hu, Kumar, Abate and Albertani36,Reference Ho, Nassef, Pornsinsirirak, Tai and Ho38) . Large birds such as seagulls are observed to fly in the quasi-steady regime due to their lower flapping frequency(Reference Hu, Kumar, Abate and Albertani36) and amplitude compared with small birds (hummingbirds) or insects. On the other hand, St has also been used to define an optimal range of
$J>1$
indicating unsteady and quasi-steady flow, respectively(Reference Hu, Kumar, Abate and Albertani36,Reference Ho, Nassef, Pornsinsirirak, Tai and Ho38) . Large birds such as seagulls are observed to fly in the quasi-steady regime due to their lower flapping frequency(Reference Hu, Kumar, Abate and Albertani36) and amplitude compared with small birds (hummingbirds) or insects. On the other hand, St has also been used to define an optimal range of
 $0.2 < \mathrm{St} <0.4$
for higher propulsive efficiency of flying and swimming animals(Reference Taylor, Nudds and Thomas39).
$0.2 < \mathrm{St} <0.4$
for higher propulsive efficiency of flying and swimming animals(Reference Taylor, Nudds and Thomas39).
4.0 RESULTS AND DISCUSSION
In accordance with the configuration of the wing mechanism, this section is classified into five cases to progressively resolve the effect of the associated configurations on the aerodynamic forces.
-
• Case 1 – Shoulder joint: studies the effect of varying the flapping amplitude (
$\phi$
), flapping frequency (f) and stroke ratio (
$\sigma$
) -
• Case 2 – Elbow joint: studies the effect of varying the span reduction (
$\psi$
) -
• Case 3 – Wrist joint: studies the effect of varying the wing twist (
$\theta$
) -
• Case 4 – Effect of varying the angle-of-attack (
$\alpha$
) -
• Case 5 – Independent flapping: Effect of varying an individual wing’s flapping amplitude and flapping plane


Figure 7. Kinematic test results from laser (ms indicates millisecond): vertical displacements measured at flapping amplitude of 10
 $^\circ$
and 20
$^\circ$
and 20
 $^\circ$
, frequency 1.5 and 2.5Hz and stroke ratio of 0.5 and 1, with no span reduction and twist: (a) displacement versus time for point 4 during only flapping motion (distance from leading edge 0.115m, distance from root 0.025m), (b) displacement versus time for point 7 during only flapping motion (distance from leading edge 0.05m, distance from root 0.39m).
$^\circ$
, frequency 1.5 and 2.5Hz and stroke ratio of 0.5 and 1, with no span reduction and twist: (a) displacement versus time for point 4 during only flapping motion (distance from leading edge 0.115m, distance from root 0.025m), (b) displacement versus time for point 7 during only flapping motion (distance from leading edge 0.05m, distance from root 0.39m).

Figure 8. Kinematic testing results from laser: wing positions during downstroke of the pure flapping motion (stroke ratio 1, initial flapping angle 20
 $^\circ$
, flapping amplitude 20
$^\circ$
, flapping amplitude 20
 $^\circ$
, flapping frequency 2.5Hz (total time period
$^\circ$
, flapping frequency 2.5Hz (total time period
 $T = 0.4$
s)).
$T = 0.4$
s)).

Figure 9. Kinematic testing results from DIC: wing position during pure flapping motion.
Each of the above cases is now presented with a mapping of the wing’s motion obtained via DIC and the laser sensor. They are tabulated so that each set of configuration parameters correspond to each case. The aerodynamic performance is then compared at the three different free-stream velocities. Each analysis compares one pair of configurations, while each pair has a change in one configuration parameter, e.g. the flapping frequency, thereby isolating the effect of this parameter in the analysis. Each configuration pair is represented by an identical symbol but different colour.
4.1 Case 1: shoulder joint and the effects of varying the flapping amplitude, flapping frequency and stroke ratio
Varying the shoulder joint control parameters can produce flapping motions with different amplitude, frequency and stroke ratio. Kinematic testing for the shoulder joint was performed at a flapping amplitude of 10
 $^\circ$
and 20
$^\circ$
and 20
 $^\circ$
, frequencies of 1.5 and 2.5Hz and stroke ratios of 0.5 and 1. The reason behind showing the wing positions for the flapping amplitude of up to 20
$^\circ$
, frequencies of 1.5 and 2.5Hz and stroke ratios of 0.5 and 1. The reason behind showing the wing positions for the flapping amplitude of up to 20
 $^\circ$
is the displacement measurement limit of the laser displacement sensor. For higher flapping amplitudes, the wing positions were out of the measurement range. The objective of this testing is to prove that the model is able to perform natural flapping motions. Figure 7 shows the vertical displacements measured at two different points on one of the wings (referring to Fig. 4) using the laser sensor. Point 4 is on the inner section of the wing. Point 7 is on the outer section at the tip (refer Fig. 4). The wing executed flapping motion via the shoulder joints at the specified parameters. The movement of the shoulder joint alone implies that elbow and wrist joint are fixed and rigid. The maximum displacement at point 4 is thus less than that at point 7. The effect of the stroke ratio can also be observed in both cases (Fig. 7) for which the upstroke is twice as fast as the downstroke. The displacements at the flapping amplitude of 20
$^\circ$
is the displacement measurement limit of the laser displacement sensor. For higher flapping amplitudes, the wing positions were out of the measurement range. The objective of this testing is to prove that the model is able to perform natural flapping motions. Figure 7 shows the vertical displacements measured at two different points on one of the wings (referring to Fig. 4) using the laser sensor. Point 4 is on the inner section of the wing. Point 7 is on the outer section at the tip (refer Fig. 4). The wing executed flapping motion via the shoulder joints at the specified parameters. The movement of the shoulder joint alone implies that elbow and wrist joint are fixed and rigid. The maximum displacement at point 4 is thus less than that at point 7. The effect of the stroke ratio can also be observed in both cases (Fig. 7) for which the upstroke is twice as fast as the downstroke. The displacements at the flapping amplitude of 20
 $^\circ$
are twice those for the amplitude of 10
$^\circ$
are twice those for the amplitude of 10
 $^\circ$
. The sensor accurately reports the prescribed flapping motion typical of a seagull at both frequencies, i.e. 1.5 and 2.5Hz. Figure 8 shows the positions of the wing at different time instants, mapped three-dimensionally using all seven laser points. The wing movement was also recorded via DIC as shown in Fig. 9 at the start of the downstroke while the wing was open and had no twist. The wing tip showed maximum displacement (red contour) throughout the shoulder joint movement.
$^\circ$
. The sensor accurately reports the prescribed flapping motion typical of a seagull at both frequencies, i.e. 1.5 and 2.5Hz. Figure 8 shows the positions of the wing at different time instants, mapped three-dimensionally using all seven laser points. The wing movement was also recorded via DIC as shown in Fig. 9 at the start of the downstroke while the wing was open and had no twist. The wing tip showed maximum displacement (red contour) throughout the shoulder joint movement.
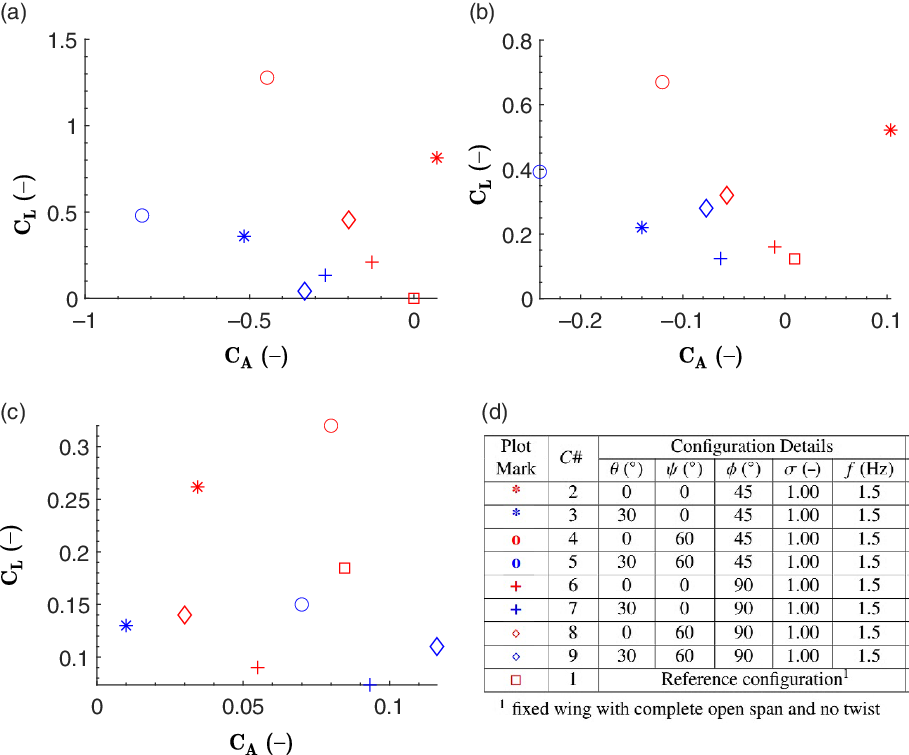
The flapping amplitude analysis was carried out at two flapping amplitudes, 45
 $^\circ$
and 90
$^\circ$
and 90
 $^\circ$
, in combination with varying the span reduction and twist values. The set of test configurations and the corresponding results for this case are presented in Fig. 10. The model generates the highest lift at the flapping amplitude of 45
$^\circ$
, in combination with varying the span reduction and twist values. The set of test configurations and the corresponding results for this case are presented in Fig. 10. The model generates the highest lift at the flapping amplitude of 45
 $^\circ$
for different combinations of span reduction and twist. To generate high lift, along with the flapping amplitude of 45
$^\circ$
for different combinations of span reduction and twist. To generate high lift, along with the flapping amplitude of 45
 $^\circ$
, the model uses a span reduction of 60
$^\circ$
, the model uses a span reduction of 60
 $^\circ$
with no twist at 0m/s or a twist of 30
$^\circ$
with no twist at 0m/s or a twist of 30
 $^\circ$
with no span reduction at 4m/s, while at 8m/s, the model flaps the wings without either span reduction or twist. For the aforementioned cases, the flapping frequency and stroke ratio are maintained at 1.5Hz and 1, respectively. This part of the analysis confirms that a flapping amplitude of 45
$^\circ$
with no span reduction at 4m/s, while at 8m/s, the model flaps the wings without either span reduction or twist. For the aforementioned cases, the flapping frequency and stroke ratio are maintained at 1.5Hz and 1, respectively. This part of the analysis confirms that a flapping amplitude of 45
 $^\circ$
is suitable for improving lift, as also reported by Bie et al. in 2020(Reference Bie, Zuo, Li, Shao and Li40). Meanwhile, higher drag is found at an amplitude of 90
$^\circ$
is suitable for improving lift, as also reported by Bie et al. in 2020(Reference Bie, Zuo, Li, Shao and Li40). Meanwhile, higher drag is found at an amplitude of 90
 $^\circ$
as observed through
$^\circ$
as observed through
 $C_A$
. However, the effect on drag when all three wing articulations are present is less distinct. Comparing the overall higher thrust values, the maximum thrust at 0m/s is produced when the model flaps at 45
$C_A$
. However, the effect on drag when all three wing articulations are present is less distinct. Comparing the overall higher thrust values, the maximum thrust at 0m/s is produced when the model flaps at 45
 $^\circ$
with a span reduction of 60
$^\circ$
with a span reduction of 60
 $^\circ$
, twist of 30
$^\circ$
, twist of 30
 $^\circ$
, flapping frequency of 1.5 and stroke ratio of 1. Meanwhile, as the speed is increased, the model generates almost no thrust at 4 and 8m/s. Overall, it can be concluded that the Robogull performed best with a flapping amplitude of 45
$^\circ$
, flapping frequency of 1.5 and stroke ratio of 1. Meanwhile, as the speed is increased, the model generates almost no thrust at 4 and 8m/s. Overall, it can be concluded that the Robogull performed best with a flapping amplitude of 45
 $^\circ$
at all speeds. The variation of lift with wind speed depends on the presence of span reduction and twist. On the other hand, thrust is maximum when flapping is supported by span reduction and thrust at 0m/s, and decreases with the speed.
$^\circ$
at all speeds. The variation of lift with wind speed depends on the presence of span reduction and twist. On the other hand, thrust is maximum when flapping is supported by span reduction and thrust at 0m/s, and decreases with the speed.
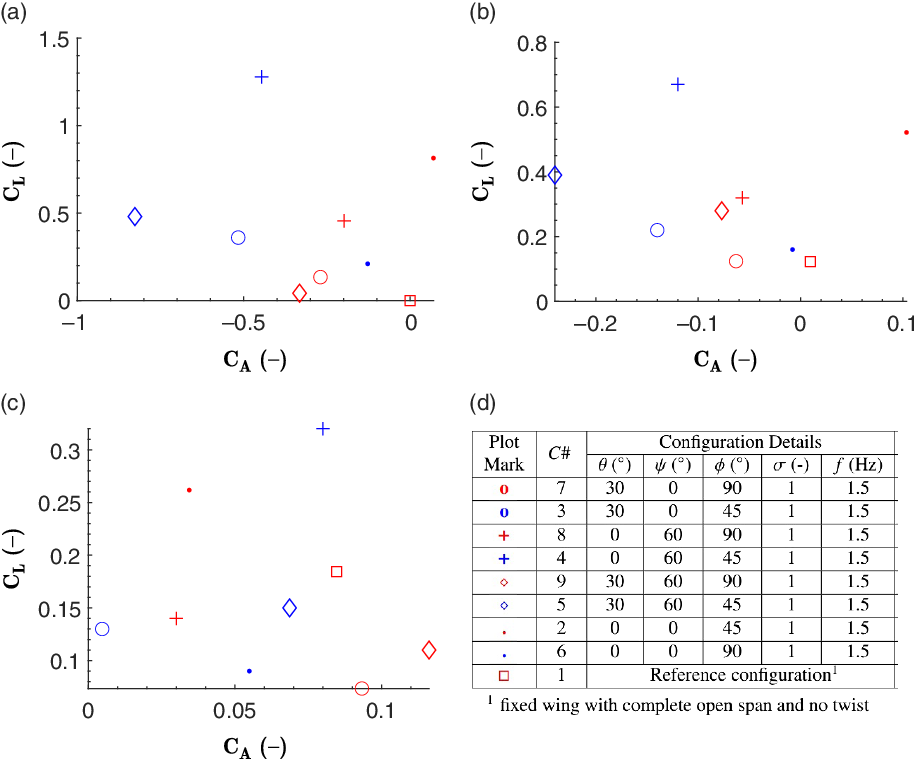
Figure 10. Flapping amplitude variation: lift versus axial force coefficients at (a) 0m/s, (b) 4m/s and (c) 8m/s. (d) Details of the corresponding configurations (all with 0
 $^\circ$
angle-of-attack and non-inclined flapping plane).
$^\circ$
angle-of-attack and non-inclined flapping plane).
Figure 11 shows the configurations and results for the flapping frequency analysis. An increase in flapping frequency increases lift when the stroke ratio is 1. This behaviour is observed for different combinations of flapping amplitude, span reduction and twist. The flapping frequency of 2.5Hz dominates the performance at the lower frequency. By reducing the stroke ratio, the model achieves high lift even at the lower frequency. This indicates that a natural flyer would attain higher efficiency by using lower-frequency flapping with a lower stroke ratio. Another reason behind this is that, for large birds, the downstroke is the main/power stroke whereas the upstroke has a negative effect. Therefore, by increasing the wing velocity during the upstroke, the negative effect is diminished. Note also that the model generates the highest lift when the frequency is 2.5Hz and the flapping amplitude is 45
 $^\circ$
. From the perspective of thrust, it increases with the flapping frequency for a particular wind speed. The overall values decrease with wind speed. The general observation from this flapping frequency study is that lift can be enhanced by an appropriate combination of flapping frequency and stroke ratio. On the other hand, the thrust produced may be controlled via changes in articulation angles and flapping frequency for higher wind speeds. The higher flapping frequency (2.5Hz) performs better than the lower frequency (1.5Hz). Moelyadi et al.(Reference Moelyadi, Adi Putra and Sachs41) performed flow simulations on a seagull-inspired wing under pure flapping motion and showed that the wing would be aerodynamically efficient and stable at flapping frequency of 3Hz, close to the highest and optimal frequency investigated in the present study (i.e. 2.5Hz).
$^\circ$
. From the perspective of thrust, it increases with the flapping frequency for a particular wind speed. The overall values decrease with wind speed. The general observation from this flapping frequency study is that lift can be enhanced by an appropriate combination of flapping frequency and stroke ratio. On the other hand, the thrust produced may be controlled via changes in articulation angles and flapping frequency for higher wind speeds. The higher flapping frequency (2.5Hz) performs better than the lower frequency (1.5Hz). Moelyadi et al.(Reference Moelyadi, Adi Putra and Sachs41) performed flow simulations on a seagull-inspired wing under pure flapping motion and showed that the wing would be aerodynamically efficient and stable at flapping frequency of 3Hz, close to the highest and optimal frequency investigated in the present study (i.e. 2.5Hz).
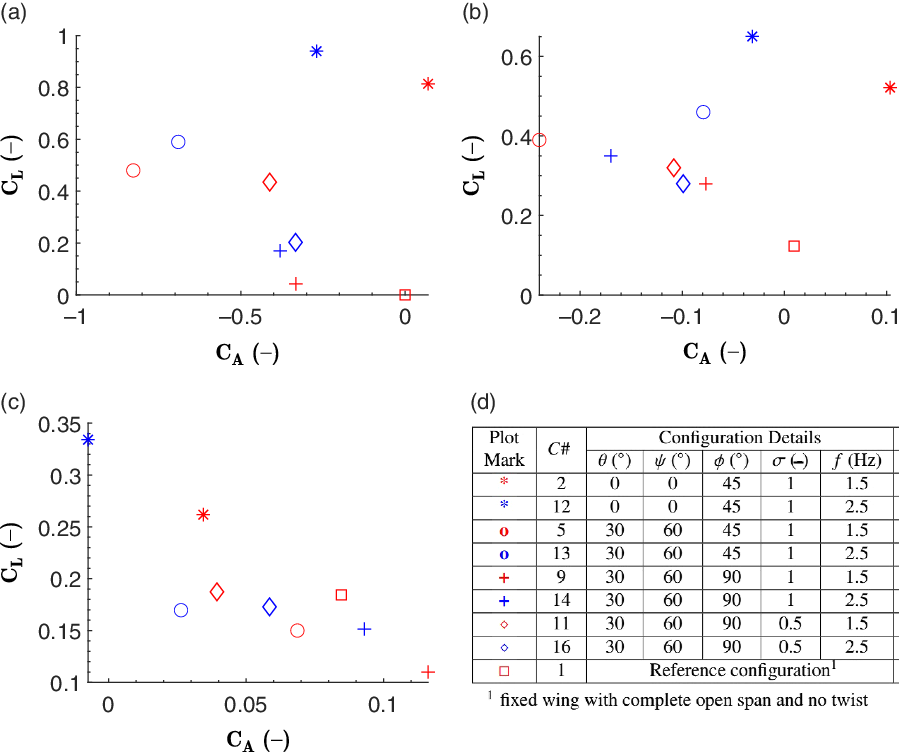
Figure 11. Flapping frequency variation: lift versus axial force coefficients at (a) 0m/s, (b) 4m/s and (c) 8m/s. (d) Details of the corresponding configurations (all with 0
 $^\circ$
angle-of-attack and non-inclined flapping plane).
$^\circ$
angle-of-attack and non-inclined flapping plane).
Figure 12 shows the configurations and results for the stroke ratio analysis. It is observed that a change in flapping frequency has a significant impact on the stroke ratio-driven configurations. With the configuration of flapping amplitude of 45
 $^\circ$
, span reduction of 0
$^\circ$
, span reduction of 0
 $^\circ$
and twist of 0
$^\circ$
and twist of 0
 $^\circ$
, i.e.
$^\circ$
, i.e.
 $C\#$
10, the model generates high lift when the stroke ratio is 0.5 and the flapping frequency is lower (i.e. 1.5Hz) as compared with the higher stroke ratio (i.e. 1) with lower frequency. The model generates high
$C\#$
10, the model generates high lift when the stroke ratio is 0.5 and the flapping frequency is lower (i.e. 1.5Hz) as compared with the higher stroke ratio (i.e. 1) with lower frequency. The model generates high
 $C_L$
only at flapping amplitude of 45
$C_L$
only at flapping amplitude of 45
 $^\circ$
and the stroke ratio of 0.5 at wind speeds of 0 and 4m/s. The same configuration with a stroke ratio of 1 performs best at 8m/s. These observations are common to actual bird flight, where the wings are flapped with a lower stroke ratio for slower flight but higher for faster flight. Considering thrust performance, complete articulation using all three joints at an amplitude of 45
$^\circ$
and the stroke ratio of 0.5 at wind speeds of 0 and 4m/s. The same configuration with a stroke ratio of 1 performs best at 8m/s. These observations are common to actual bird flight, where the wings are flapped with a lower stroke ratio for slower flight but higher for faster flight. Considering thrust performance, complete articulation using all three joints at an amplitude of 45
 $^\circ$
(
$^\circ$
(
 $C\#$
15) performs better than others. Here, the combination of a stroke ratio of 0.5 and a frequency of 2.5Hz offers better thrust at 4 and 8m/s, whereas the same combination with a stroke ratio of 1 and frequency of 1.5Hz (
$C\#$
15) performs better than others. Here, the combination of a stroke ratio of 0.5 and a frequency of 2.5Hz offers better thrust at 4 and 8m/s, whereas the same combination with a stroke ratio of 1 and frequency of 1.5Hz (
 $C\#$
5) excels at 0m/s. Hence, It can be concluded that the combination of a stroke ratio of 0.5 with a flapping frequency of 2.5Hz is more aerodynamically effective as it helps the model to generate higher lift as well as thrust.
$C\#$
5) excels at 0m/s. Hence, It can be concluded that the combination of a stroke ratio of 0.5 with a flapping frequency of 2.5Hz is more aerodynamically effective as it helps the model to generate higher lift as well as thrust.
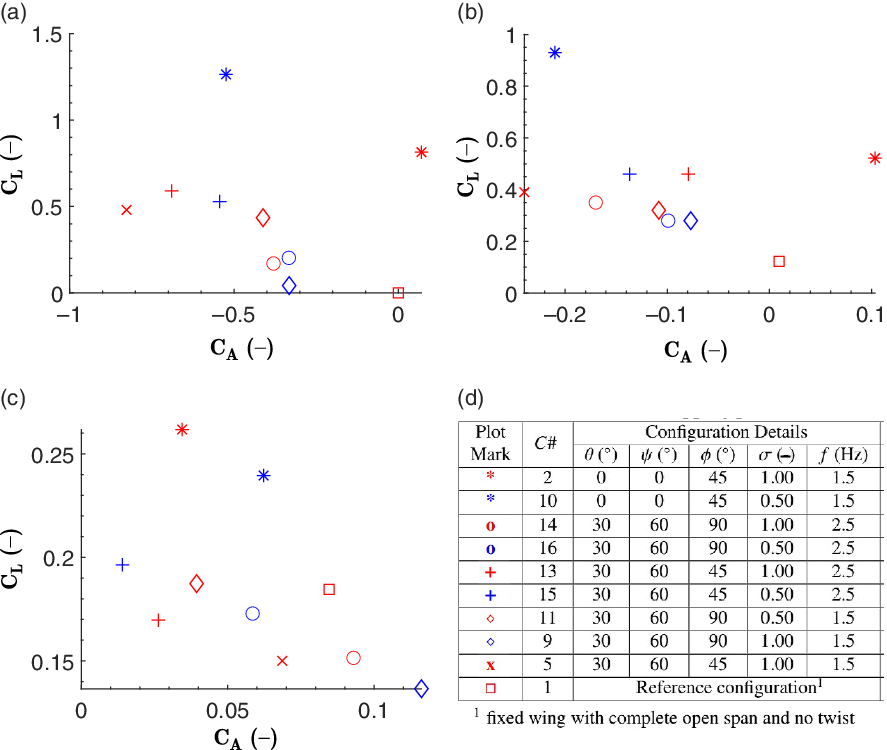
Figure 12. Stroke ratio variation: lift versus axial force coefficients at (a) 0m/s, (b) 4m/s and (c) 8m/s. (d) Details of corresponding configurations (all with 0
 $^\circ$
angle-of-attack and non-inclined flapping plane).
$^\circ$
angle-of-attack and non-inclined flapping plane).
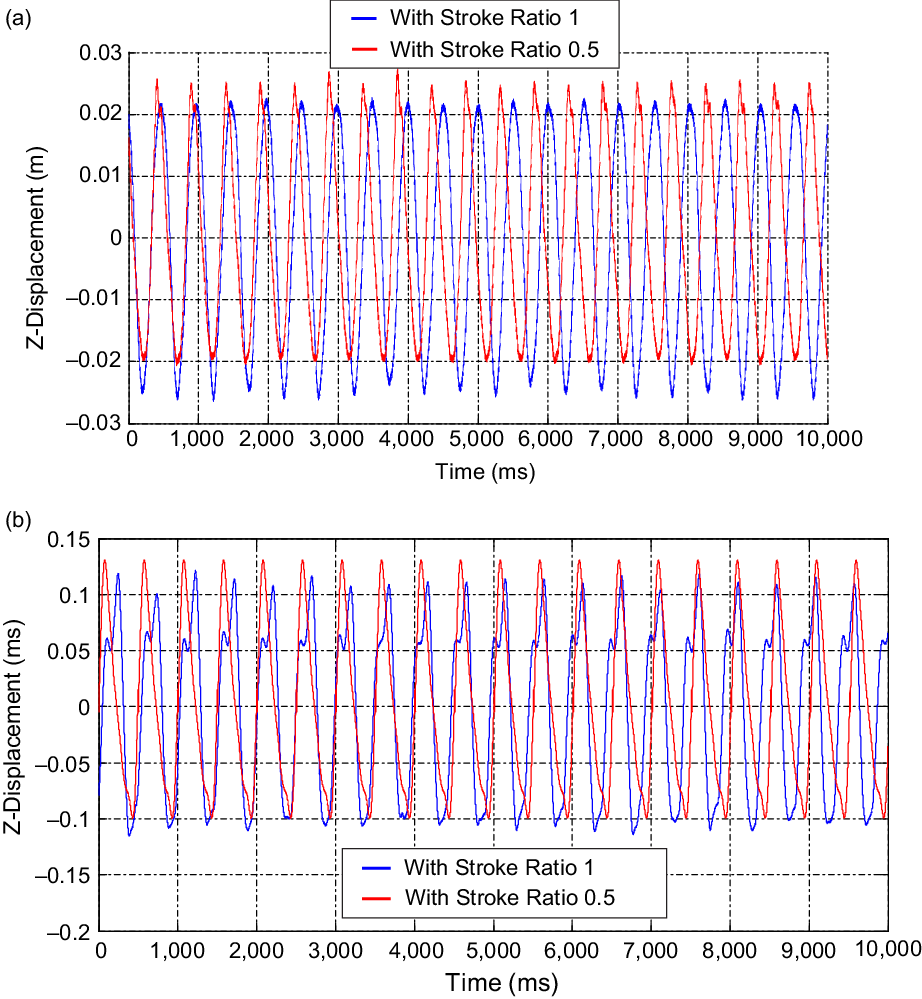
Figure 13. Kinematic testing results from laser for span reduction test (ms indicates millisecond): vertical displacements measured at span reduction of 30
 $^\circ$
, flapping amplitude of 20
$^\circ$
, flapping amplitude of 20
 $^\circ$
, twist of 0
$^\circ$
, twist of 0
 $^\circ$
and frequency of 2.5Hz, with stroke ratio of 1 and 0.5: (a) displacement versus time for point 4 during span reduction (distance from leading edge 0.115m, distance from root 0.025m), (b) displacement versus time for point 7 during span reduction (distance from leading edge 0.05m, distance from root 0.39m).
$^\circ$
and frequency of 2.5Hz, with stroke ratio of 1 and 0.5: (a) displacement versus time for point 4 during span reduction (distance from leading edge 0.115m, distance from root 0.025m), (b) displacement versus time for point 7 during span reduction (distance from leading edge 0.05m, distance from root 0.39m).

Figure 14. Kinematic testing results from laser for span reduction test: wing positions during upstroke depicting span reduction (stroke ratio 1, span reduction angle 30
 $^\circ$
, flapping frequency 2.5Hz (total time period
$^\circ$
, flapping frequency 2.5Hz (total time period
 $T = 0.4$
s)).
$T = 0.4$
s)).

Figure 15. Kinematic testing results from DIC for span reduction test: wing position during flapping with span reduction.
Overall, from case study 1, it is observed that a flapping amplitude of 45
 $^\circ$
, flapping frequency of 2.5Hz and stroke ratio 0.5 is the best combination of shoulder joint controlled kinematic parameters. It is also identified that the lift and thrust results at a wind speed of 8m/s are inconsistent and insignificant for various cases. Consequently, the effects of the flapping parameters are indistinguishable at this high wind speed. Hence, it can concluded that the wind speed of 4m/s is suitable for the developed Robogull model. Based on the optimal parameter values of a flapping amplitude of 45
$^\circ$
, flapping frequency of 2.5Hz and stroke ratio 0.5 is the best combination of shoulder joint controlled kinematic parameters. It is also identified that the lift and thrust results at a wind speed of 8m/s are inconsistent and insignificant for various cases. Consequently, the effects of the flapping parameters are indistinguishable at this high wind speed. Hence, it can concluded that the wind speed of 4m/s is suitable for the developed Robogull model. Based on the optimal parameter values of a flapping amplitude of 45
 $^\circ$
, flapping frequency of 2.5Hz and flying speed of 4m/s, the Strouhal number (St) for the model is 0.24, which lies in the optimal range (
$^\circ$
, flapping frequency of 2.5Hz and flying speed of 4m/s, the Strouhal number (St) for the model is 0.24, which lies in the optimal range (
 $0.2 < \mathrm{St} < 0.4$
) for natural flyers and swimmers(Reference Taylor, Nudds and Thomas39). Moreover, for these parameter values, the advance ratio is 2.1, indicating that the model would be in a quasi-steady regime as for natural flyers(Reference Hu, Kumar, Abate and Albertani36,Reference Ho, Nassef, Pornsinsirirak, Tai and Ho38) . It is also evident that a lower flapping frequency is better at low wind speed whereas higher frequencies are found to be more efficient at higher wind speeds. This higher efficiency can be attributed to the larger pressure differences, thereby generating more lift. The wake pattern would also be different(Reference Ellington, van den Berg, Willmott and Thomas42). Additionally, the increase in the aerodynamic performance explains why natural birds initiate faster upstrokes than downstrokes. This is how natural flyers maintain favourable values of non-dimensional parameters such as the Strouhal number and advance ratio which are derived from the flapping frequency, flapping amplitude and wind speed. Earlier studies showed that increasing the frequency would enhance both lift and thrust(Reference Hu, Kumar, Abate and Albertani36,Reference Moelyadi, Adi Putra and Sachs41,Reference Mazaheri and Ebrahimi43–Reference Aditya and Malolan46) . However, this study provides additional insights into the relevance of the stroke ratio with the flapping frequency, wing articulations and wind speed.
$0.2 < \mathrm{St} < 0.4$
) for natural flyers and swimmers(Reference Taylor, Nudds and Thomas39). Moreover, for these parameter values, the advance ratio is 2.1, indicating that the model would be in a quasi-steady regime as for natural flyers(Reference Hu, Kumar, Abate and Albertani36,Reference Ho, Nassef, Pornsinsirirak, Tai and Ho38) . It is also evident that a lower flapping frequency is better at low wind speed whereas higher frequencies are found to be more efficient at higher wind speeds. This higher efficiency can be attributed to the larger pressure differences, thereby generating more lift. The wake pattern would also be different(Reference Ellington, van den Berg, Willmott and Thomas42). Additionally, the increase in the aerodynamic performance explains why natural birds initiate faster upstrokes than downstrokes. This is how natural flyers maintain favourable values of non-dimensional parameters such as the Strouhal number and advance ratio which are derived from the flapping frequency, flapping amplitude and wind speed. Earlier studies showed that increasing the frequency would enhance both lift and thrust(Reference Hu, Kumar, Abate and Albertani36,Reference Moelyadi, Adi Putra and Sachs41,Reference Mazaheri and Ebrahimi43–Reference Aditya and Malolan46) . However, this study provides additional insights into the relevance of the stroke ratio with the flapping frequency, wing articulations and wind speed.
4.2 Case 2: elbow joint and the effects of varying the span reduction angle
Moving the elbow joint servo enables the Robogull to change its span. Kinematic testing for this case was carried out at a span reduction (
 $\psi$
) of 30
$\psi$
) of 30
 $^\circ$
with
$^\circ$
with
 $\phi=20^\circ$
,
$\phi=20^\circ$
,
 $\theta=0$
,
$\theta=0$
,
 $f=2.5$
Hz and
$f=2.5$
Hz and
 $\sigma=1, 0.5$
. As shown in Fig. 13, this movement has no effect on the inner wing section at point 4. The displacements at point 7 shows kinks due to the folding of the span and at the start of the downstroke. The effect of stroke ratio variation is observed for both the inner and outer planform of the wing. In the case of
$\sigma=1, 0.5$
. As shown in Fig. 13, this movement has no effect on the inner wing section at point 4. The displacements at point 7 shows kinks due to the folding of the span and at the start of the downstroke. The effect of stroke ratio variation is observed for both the inner and outer planform of the wing. In the case of
 $\sigma=0.5$
, the upstroke is seen to be quicker at both point 4 and 7. Figure 14 clearly depicts a span reduction executed by the actuation with no twist. The first four points present in the inner section perform normal flapping motion. Span reduction is executed by the three remaining points in the outer section. Point 7 is at the lowest position at the start of the span reduction during upstroke but at top at the end. Full-field DIC measurements (Fig. 15) also show that the wing contracts and reduces its span during the upstroke.
$\sigma=0.5$
, the upstroke is seen to be quicker at both point 4 and 7. Figure 14 clearly depicts a span reduction executed by the actuation with no twist. The first four points present in the inner section perform normal flapping motion. Span reduction is executed by the three remaining points in the outer section. Point 7 is at the lowest position at the start of the span reduction during upstroke but at top at the end. Full-field DIC measurements (Fig. 15) also show that the wing contracts and reduces its span during the upstroke.
The list of configurations and corresponding results for the study with different upstroke span reduction angles are shown in Fig. 16. Reducing the span generates higher
 $C_L$
at all wind speeds (
$C_L$
at all wind speeds (
 $C\#$
4 versus
$C\#$
4 versus
 $C\# 2$
). Its contribution is consistent when wing twist is also present (
$C\# 2$
). Its contribution is consistent when wing twist is also present (
 $C\# 5$
). However, the role of span reduction with higher flapping amplitude along with twist appears inconsistent (
$C\# 5$
). However, the role of span reduction with higher flapping amplitude along with twist appears inconsistent (
 $C\# 7$
and
$C\# 7$
and
 $C\# 9$
). It is also observed that the absence of span reduction results in higher
$C\# 9$
). It is also observed that the absence of span reduction results in higher
 $C_A$
or drag. Span reduction with a flapping amplitude of 45
$C_A$
or drag. Span reduction with a flapping amplitude of 45
 $^\circ$
also tends to contribute to a thrust increase and is consistent in the case of configurations where twist is present. Overall, span reduction enhances the aerodynamic performance by generating both lift and thrust. Reducing the span in the upstroke reduces the resistance and ultimately provides net lift in the downstroke as the span expanded. Various other studies have considered the concept of flapping–folding (only) and showed that the inclusion of folding (or span reduction) enhances the aerodynamic performance by increasing lift and thrust while decreasing power consumption(Reference Feshalami, Djavareshkian, Yousefi, Zaree and Mehraban21,Reference Ryu, Lee and Kim23,Reference Chang, Ma and Zhang47) .
$^\circ$
also tends to contribute to a thrust increase and is consistent in the case of configurations where twist is present. Overall, span reduction enhances the aerodynamic performance by generating both lift and thrust. Reducing the span in the upstroke reduces the resistance and ultimately provides net lift in the downstroke as the span expanded. Various other studies have considered the concept of flapping–folding (only) and showed that the inclusion of folding (or span reduction) enhances the aerodynamic performance by increasing lift and thrust while decreasing power consumption(Reference Feshalami, Djavareshkian, Yousefi, Zaree and Mehraban21,Reference Ryu, Lee and Kim23,Reference Chang, Ma and Zhang47) .

Figure 16. Upstroke span reduction variation: lift versus axial force coefficients at (a) 0m/s, (b) 4m/s and (c) 8m/s, (d) details of the corresponding configurations (all with 0
 $^\circ$
angle-of-attack and non-inclined flapping plane).
$^\circ$
angle-of-attack and non-inclined flapping plane).
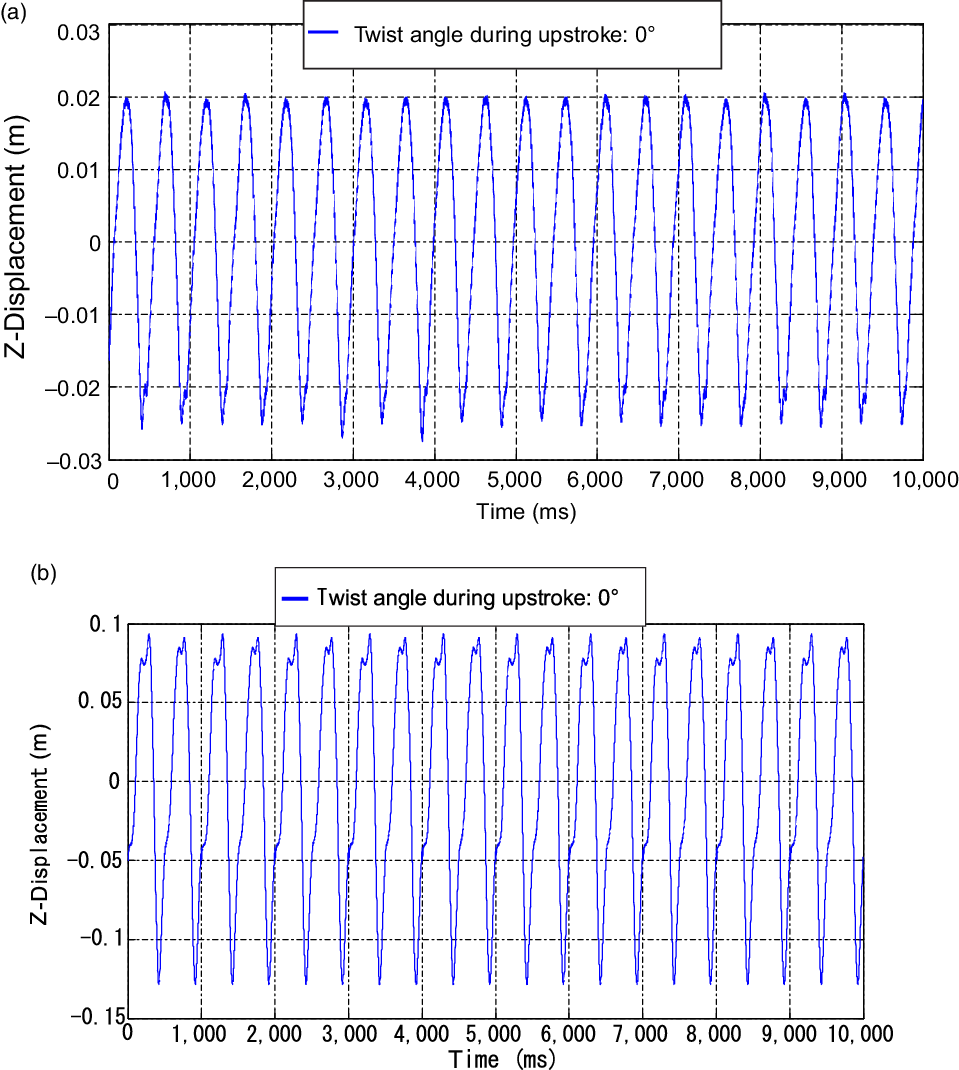
Figure 17. Kinematic testing results from laser for twist test (ms indicates millisecond): vertical displacements measured at wing twist of 35
 $^\circ$
, flapping amplitude of 20
$^\circ$
, flapping amplitude of 20
 $^\circ$
, no span reduction, frequency 2.5Hz and stroke ratio of 0.5: (a) displacement versus time for point 4 during wing twisting action (distance from leading edge 0.115m, distance from root 0.025m), (b) displacement versus time for point 7 during wing twisting action (distance from leading edge 0.05m, distance from root 0.39m).
$^\circ$
, no span reduction, frequency 2.5Hz and stroke ratio of 0.5: (a) displacement versus time for point 4 during wing twisting action (distance from leading edge 0.115m, distance from root 0.025m), (b) displacement versus time for point 7 during wing twisting action (distance from leading edge 0.05m, distance from root 0.39m).
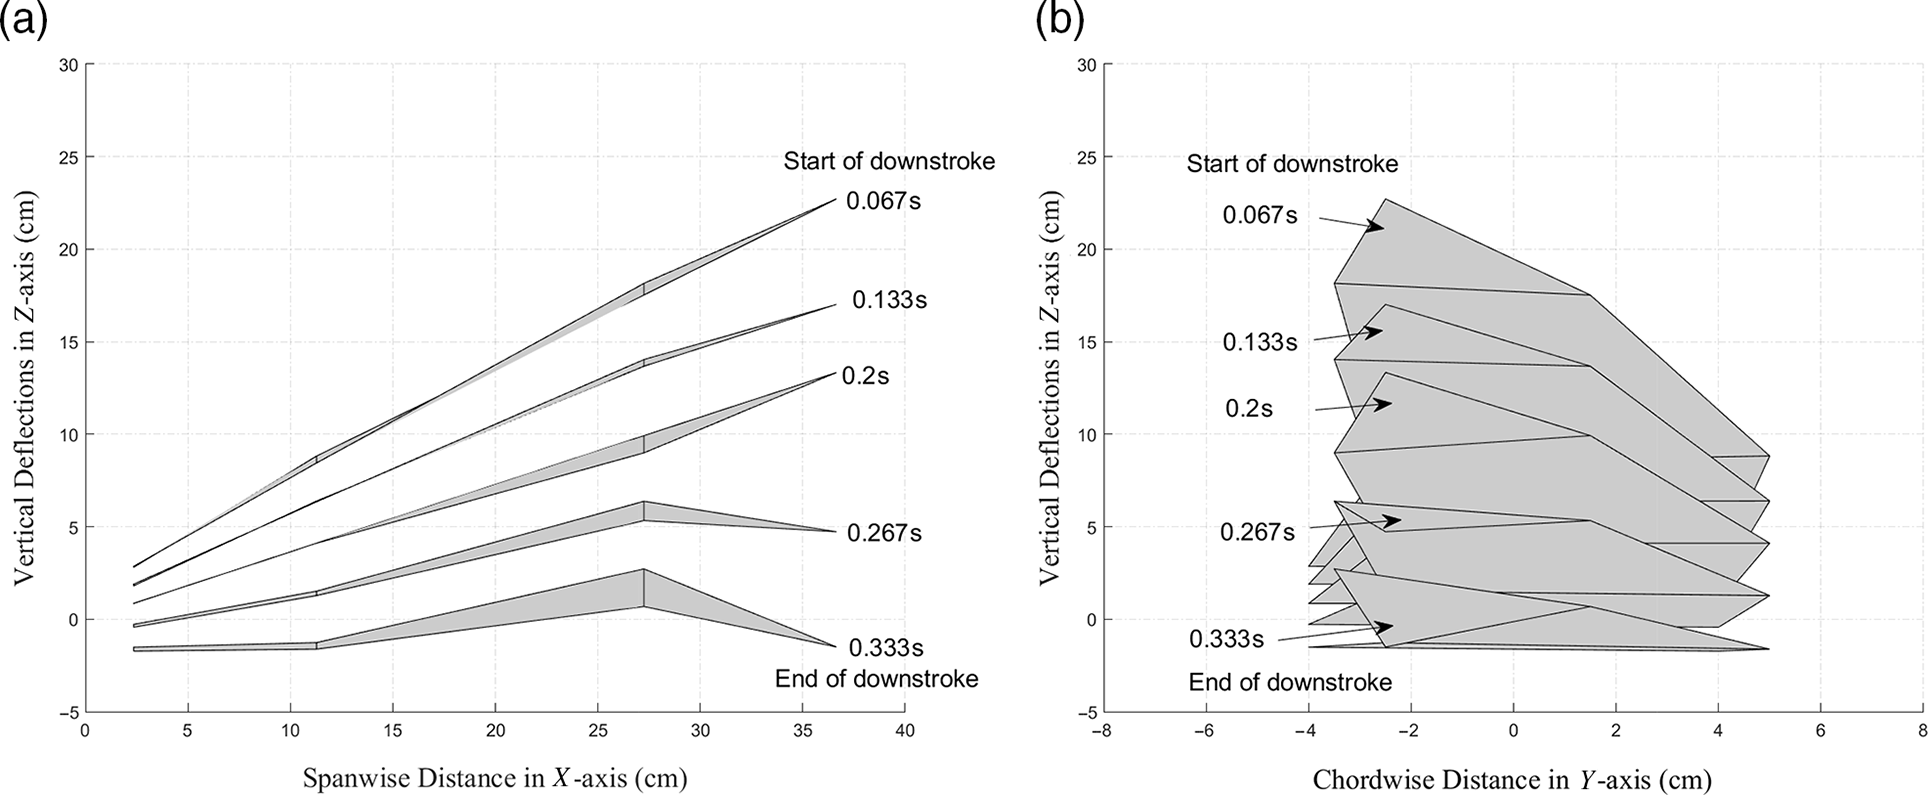
Figure 18. Kinematic testing results from laser: wing positions during downstroke depicting twisting (stroke ratio 0.5, twist angle during downstroke 35
 $^\circ$
(downstroke time
$^\circ$
(downstroke time
 $(T_{D}) = 0.267$
s), twist angle during upstroke 0
$(T_{D}) = 0.267$
s), twist angle during upstroke 0
 $^\circ$
(upstroke time
$^\circ$
(upstroke time
 $T_{U} = 0.133$
s), flapping frequency 2.5Hz (total time period
$T_{U} = 0.133$
s), flapping frequency 2.5Hz (total time period
 $T = 0.4$
s)).
$T = 0.4$
s)).

Figure 19. Kinematic testing results from DIC: wing position during flapping with twist motion.
4.3 Case 3: wrist joint and the effects of varying wing twist
In this section, the effect of varying the outer-section wing twist (
 $\theta$
) is examined. The wing was set at a flapping amplitude of 20
$\theta$
) is examined. The wing was set at a flapping amplitude of 20
 $^\circ$
with zero span reduction, a downstroke twist of 35
$^\circ$
with zero span reduction, a downstroke twist of 35
 $^\circ$
, a stroke ratio of 0.5 and a flapping frequency of 2.5Hz to test its kinematics under twist. No effect of twist is observed at point 4 because it lies on the inner section of the wing as shown in Fig. 17(a). Point 7 is lifted vertically up during the downstroke and vertically down during the upstroke (Fig. 18). At the end of the downstroke, i.e. near the uppermost tip of the curve, the wing twists to pitch up (correspondingly, point 7 moves down as it is aft of the twist axis), which leads to a step change in the displacement of point 7. This causes a sudden jump in the value near the maxima of the curve (Figs 17(b) and 18). It was difficult to measure vertical deflections using the laser sensor during wing twist. This is a classical problem as out-of-plane displacements are induced as the wing rotates about the vertical plane. Thus, the use of DIC enabled enhanced analysis of the twisting motion of the wing (Fig. 19). The DIC results show the twisting of the wing during the downstroke. The outer part of the wing twists downward without any span reduction. It can also be seen that the maximum displacement is found at the trailing edge and the minimum at the leading edge, as expected for a wing that is twisting downward.
$^\circ$
, a stroke ratio of 0.5 and a flapping frequency of 2.5Hz to test its kinematics under twist. No effect of twist is observed at point 4 because it lies on the inner section of the wing as shown in Fig. 17(a). Point 7 is lifted vertically up during the downstroke and vertically down during the upstroke (Fig. 18). At the end of the downstroke, i.e. near the uppermost tip of the curve, the wing twists to pitch up (correspondingly, point 7 moves down as it is aft of the twist axis), which leads to a step change in the displacement of point 7. This causes a sudden jump in the value near the maxima of the curve (Figs 17(b) and 18). It was difficult to measure vertical deflections using the laser sensor during wing twist. This is a classical problem as out-of-plane displacements are induced as the wing rotates about the vertical plane. Thus, the use of DIC enabled enhanced analysis of the twisting motion of the wing (Fig. 19). The DIC results show the twisting of the wing during the downstroke. The outer part of the wing twists downward without any span reduction. It can also be seen that the maximum displacement is found at the trailing edge and the minimum at the leading edge, as expected for a wing that is twisting downward.
The list of configurations and corresponding results for the study with different outer wing twist angles are shown in Fig. 20. It is observed that twist articulation outboard helped to improve thrust. This result remains consistent when all other articulations such as the span reduction angle are also applied. The presence of twist is more prominent with a flapping amplitude of 45
 $^\circ$
as compared with 90
$^\circ$
as compared with 90
 $^\circ$
. This also depends on the flying velocity. The thrust increment is 152.6
$^\circ$
. This also depends on the flying velocity. The thrust increment is 152.6
 $\%$
for the combination of twist of 30
$\%$
for the combination of twist of 30
 $^\circ$
with flapping amplitude of 45
$^\circ$
with flapping amplitude of 45
 $^\circ$
(
$^\circ$
(
 $C\#$
3) with respect to the corresponding configuration without twist (
$C\#$
3) with respect to the corresponding configuration without twist (
 $C\#$
2). Also, it is higher compared with the effect of a twist of 30
$C\#$
2). Also, it is higher compared with the effect of a twist of 30
 $^\circ$
for the configurations with flapping amplitude of 90
$^\circ$
for the configurations with flapping amplitude of 90
 $^\circ$
(
$^\circ$
(
 $C\#$
7), i.e. 107.7
$C\#$
7), i.e. 107.7
 $\%$
. Similar observations are seen at 4m/s. However, thrust decreases with speed and turns into drag at 8m/s, even if wing twisting is present. Lift generation varies for different twists. Typically, the configurations without twist are more effective for generating lift. This may imply flow separation at wing tips at 30
$\%$
. Similar observations are seen at 4m/s. However, thrust decreases with speed and turns into drag at 8m/s, even if wing twisting is present. Lift generation varies for different twists. Typically, the configurations without twist are more effective for generating lift. This may imply flow separation at wing tips at 30
 $^\circ$
twist. After studying the effect of the articulations at the wrist joint and elbow, it can be said that the wing twist controls the thrust performance, and using it with span reduction is advantageous for generating both lift and thrust forces. These observations can be attributed to the fact that the wing twist plays a key role in controlling the Leading-Edge Vortices (LEVs). Basically, it reduces or favourably adjusts the angle-of-attack along the wing span and prevents flow separation, consequently maintaining lift and reducing drag (or enhancing thrust)(Reference Chin and Lentink48,Reference Chang, Zhang, Ma and Wang49) .
$^\circ$
twist. After studying the effect of the articulations at the wrist joint and elbow, it can be said that the wing twist controls the thrust performance, and using it with span reduction is advantageous for generating both lift and thrust forces. These observations can be attributed to the fact that the wing twist plays a key role in controlling the Leading-Edge Vortices (LEVs). Basically, it reduces or favourably adjusts the angle-of-attack along the wing span and prevents flow separation, consequently maintaining lift and reducing drag (or enhancing thrust)(Reference Chin and Lentink48,Reference Chang, Zhang, Ma and Wang49) .

Figure 20. Twist variation: lift versus axial force coefficients at (a) 0m/s, (b) 4m/s and (c) 8m/s, (d) details of the corresponding configurations (all with 0
 $^\circ$
angle-of-attack and non-inclined flapping plane).
$^\circ$
angle-of-attack and non-inclined flapping plane).
4.4 Case 4: effect of angle-of-attack
Figure 21(d) shows the configurations with different angles of attack. Within the two scenarios of normal symmetric flapping at 90
 $^\circ$
, and another at 45/90@inc,
$^\circ$
, and another at 45/90@inc,
 $\alpha$
is varied using the arm supporting the Robogull set-up in the wind tunnel. The results for lift coefficients versus axial force coefficients for velocities of 0, 4, and 8m/s are shown in Fig. 21(a), (b) and (c), respectively. Considering symmetric flapping performed at 2.5Hz (
$\alpha$
is varied using the arm supporting the Robogull set-up in the wind tunnel. The results for lift coefficients versus axial force coefficients for velocities of 0, 4, and 8m/s are shown in Fig. 21(a), (b) and (c), respectively. Considering symmetric flapping performed at 2.5Hz (
 $C\#$
16–19), it can be seen that
$C\#$
16–19), it can be seen that
 $C_L$
increases with
$C_L$
increases with
 $\alpha$
and the maximum
$\alpha$
and the maximum
 $C_L$
occurs at 4m/s. In the 45/90@inc configuration, a similar phenomenon is observed even when the flapping frequency is varied from 1.5 to 2.5Hz. The maximum thrust occurs at 0
$C_L$
occurs at 4m/s. In the 45/90@inc configuration, a similar phenomenon is observed even when the flapping frequency is varied from 1.5 to 2.5Hz. The maximum thrust occurs at 0
 $^\circ$
angle-of-attack for both 0 and 4m/s. It reduces for higher
$^\circ$
angle-of-attack for both 0 and 4m/s. It reduces for higher
 $\alpha$
with higher wind speeds. Similar to the findings of Bie et al.(Reference Bie, Zuo, Li, Shao and Li40), Chang et al.(Reference Chang, Ma and Zhang47) and Moelyadi et al.(Reference Moelyadi, Adi Putra and Sachs41), low pressure on the upper surfaces of the wing in flight increases lift with accompanying drag. In general, increasing the angle-of-attack significantly increases lift.
$\alpha$
with higher wind speeds. Similar to the findings of Bie et al.(Reference Bie, Zuo, Li, Shao and Li40), Chang et al.(Reference Chang, Ma and Zhang47) and Moelyadi et al.(Reference Moelyadi, Adi Putra and Sachs41), low pressure on the upper surfaces of the wing in flight increases lift with accompanying drag. In general, increasing the angle-of-attack significantly increases lift.
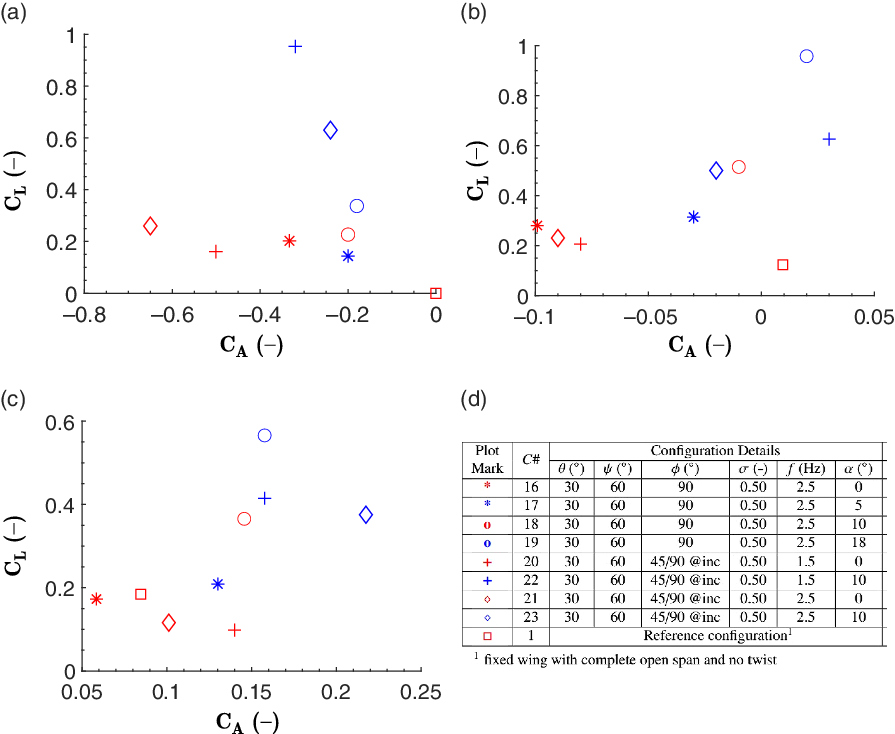
Figure 21. Angle-of-attack variation results: lift versus axial force coefficients at (a) 0m/s, (b) 4m/s and (c) 8m/s, (d) details of the corresponding configurations.
4.5 Case 5: roll configurations
For the biological functions of birds, or mission capability of UAVs, manoeuvrability is of great importance. In this case study, the Robogull was set at a bank angle and different flapping amplitudes were applied for the left and right wings to induce a rolling moment. Table 4 compares these configurations having the 45/90@inc setting (flapping amplitude of
 $45^{\circ}$
for the left wing and
$45^{\circ}$
for the left wing and
 $90^{\circ}$
for the right wing with a flapping plane inclined at a bank angle of
$90^{\circ}$
for the right wing with a flapping plane inclined at a bank angle of
 $20^{\circ}$
) with others. The use of the flapping servo motors gives the model a special ability to alter its bank angle without rotating its body and to change the flapping amplitude of each wing independently. Figure 22(a) illustrates the ability of the Robogull to perform this banking manoeuvre with respect to the horizontal plane. One wing flaps while tilted down (the left wing) whereas the other flaps while tilted up (the right wing), both about their respective median positions. The rolling moments for all the configurations are collated in Fig. 22(b). While the symmetric Robogull produces a near-zero rolling moment, the 45/90@inc configurations induced rolling moments. The main inferences from this section of the testing is that the configurations
$20^{\circ}$
) with others. The use of the flapping servo motors gives the model a special ability to alter its bank angle without rotating its body and to change the flapping amplitude of each wing independently. Figure 22(a) illustrates the ability of the Robogull to perform this banking manoeuvre with respect to the horizontal plane. One wing flaps while tilted down (the left wing) whereas the other flaps while tilted up (the right wing), both about their respective median positions. The rolling moments for all the configurations are collated in Fig. 22(b). While the symmetric Robogull produces a near-zero rolling moment, the 45/90@inc configurations induced rolling moments. The main inferences from this section of the testing is that the configurations
 $C\#$
20–23 subjected to the 45/90@inc setting generate higher rolling moment values as compared with the other cases. The rolling moment coefficients are found to be maximum at the speed of 4m/s. Natural flyers generally reduce their flying speed and flapping rate when making a turn. Configuration 20 replicates the same by generating the highest rolling moment value at a speed of 4m/s and flapping rate of 1.5Hz.
$C\#$
20–23 subjected to the 45/90@inc setting generate higher rolling moment values as compared with the other cases. The rolling moment coefficients are found to be maximum at the speed of 4m/s. Natural flyers generally reduce their flying speed and flapping rate when making a turn. Configuration 20 replicates the same by generating the highest rolling moment value at a speed of 4m/s and flapping rate of 1.5Hz.

Figure 22. (a) Robogull making independent flapping motion for rolling action. (b) Comparison for all the configurations on the basis of rolling moments.
5.0 CONCLUSIONS
A flapping-wing UAV model inspired by the black-headed gull has been developed. This robotic gull (Robogull) was examined for its morphological, kinematic, and aerodynamic characteristics. The wings were constructed with three independently controlled joints to achieve active morphing and thus generate natural bird wing motions such as flapping, span reduction and twist. Wind-tunnel experiments facilitated the aerodynamic investigation. Through the analysis and compilation of seven parameters and 23 configurations, several interesting findings are presented.
The morphological parameters including the wing mass, wing length, wing area and total body mass were designed to be similar to those of the black-headed gull. The data show that the Robogull closely matches the data available for the bird. The complete flapping motion of the wing was measured using a laser displacement sensor and DIC, verifying that the wing is capable of performing natural wing motions including flapping, span reduction and twisting. The shoulder joint can control the flapping amplitude (0–90
 $^\circ$
), flapping frequency (0–3Hz) and stroke ratio (0–1); the elbow joint can control the span reduction (10–60
$^\circ$
), flapping frequency (0–3Hz) and stroke ratio (0–1); the elbow joint can control the span reduction (10–60
 $^\circ$
); the wrist joint can control twisting (0–30
$^\circ$
); the wrist joint can control twisting (0–30
 $^\circ$
). An important feature of this two-winged biomimetic model is that all the wing joints can be controlled independently. This provides the model with the ability to perform complicated wing motion operations carried out by birds in nature but that would not be possible with other types of UAVs. The aerodynamic characteristics in different configurations were evaluated in a wind tunnel. The following findings were made regarding improving the lift and thrust performance:
$^\circ$
). An important feature of this two-winged biomimetic model is that all the wing joints can be controlled independently. This provides the model with the ability to perform complicated wing motion operations carried out by birds in nature but that would not be possible with other types of UAVs. The aerodynamic characteristics in different configurations were evaluated in a wind tunnel. The following findings were made regarding improving the lift and thrust performance:
-
• Variation of the flapping amplitude can improve lift and thrust. This depends on span reduction and wing twist for a particular wind speed. It is observed that a flapping amplitude of 45
$^\circ$
performs better than 90
$^\circ$
. The model generates 44.44
$\%$
more lift at 4m/s and 36.84
$\%$
more lift at 8m/s when flapping at 45
$^\circ$
instead of 90
$^\circ$
. -
• Lift and thrust both increase with the flapping frequency and are highest at a flapping frequency of 2.5Hz.
-
• Combined variation of the flapping frequency and stroke ratio is required to achieve better performance. A stroke ratio of 0.5 with a flapping frequency of 2.5Hz is more aerodynamically effective among the 23 configurations as it helps the model to generate higher lift as well as thrust forces.
-
• Span reduction enhances the aerodynamic performance by generating both lift and thrust. Its contribution remains consistent when wing twist is also present, especially in terms of generating thrust.
-
• The wing twist controls the thrust performance of the model and is more effective at a flapping amplitude of 45
$^\circ$
. The model generates 152.6
$\%$
more thrust when operated with a wing twist of 30
$^\circ$
and flapping amplitude of 45
$^\circ$
(in comparison with 0
$^\circ$
twist with 45
$^\circ$
flapping amplitude). The same twist with 90
$^\circ$
generates 107
$\%$
more thrust as compared with the corresponding no-twist configuration. The role of twist in generating lift is insignificant. -
• Increasing the angle-of-attack increases lift. Lift reaches its maximum at a wind speed of 4m/s among the nine configurations compared. On the other hand, maximum thrust occurs at 0
$^\circ$
angle-of-attack but reduces for higher
$\alpha$
at higher wind speeds. -
• A flying speed of 4m/s is found to be more appropriate in comparison with 8m/s. The lift and thrust results at a wind speed of 8m/s are inconsistent and insignificant for various cases. The effects of various flapping parameters are not distinct at this flying speed.
-
• A significant rolling moment is generated when inclined and the opposite wings have different flapping configuration achieved through the independent control capability.
-
• Based on the optimal parameter values of a flapping amplitude of 45
$^\circ$
, flapping frequency of 2.5Hz and flying speed of 4m/s, the Strouhal number for the model is 0.24, lying in the optimal range (
$0.2 < \mathrm{St} < 0.4$
) for natural flyers and swimmers.


This study describes a full-scale morphing flapping robotic seagull with natural bird-like characteristics. It demonstrates how independent articulations improve the flying characteristics and explains how folding the wings through a stroke or bending at the wing’s end can benefit bird flight. The findings could be used to understand the anatomy of birds and relate them to their biological habits. Furthermore, the findings provide useful insights for designing and controlling large flapping UAVs successfully. The presented model has potential to be developed into an agile and efficient UAV system that could be used for various applications including defence and disaster situations.
ACKNOWLEDGEMENTS
The authors thank the Vibration and Acoustic Lab and National Wind Tunnel Facility (NWTF) at the Indian Institute of Technology Kanpur for help with DIC and aerodynamic testing experiments. The authors also greatly appreciate Lavendra Singh, Mit Shah, Deepak Pawar and the NWTF team for help during aerodynamic testing at the wind tunnel.
A.0 APPENDIX
A.1 Additional details about wing fabrication
In the design and construction of the wing, aerofoils A1, A2, A3, A4 and A5 are fabricated and placed at equal distances on the inboard spars S1 and S2 of length 180mm each. These aerofoils are of equal dimensions but differ in the cut-out locations where the spars are attached to them. This offers a forward swept of
 $10^{\circ}$
that resembles that of the black-headed gull. The inboard section forms a parallelogram. Each of the spars S1 and S2 is a hollow square-cross-section carbon fibre–epoxy composite bar with size of 3mm
$10^{\circ}$
that resembles that of the black-headed gull. The inboard section forms a parallelogram. Each of the spars S1 and S2 is a hollow square-cross-section carbon fibre–epoxy composite bar with size of 3mm
 $\times$
3mm to ensure torsional rigidity of the section and the aerofoil–spar joints. Each of the inboard aerofoils is rigidly attached to the spars S1 and S2. The outboard section of the wing consists of three aerofoils with reducing chord length and a circular cross-section carbon fibre–epoxy composite hollow spar. Aerofoils A6, A7 and A8 are not fixed to spar S3 but allowed to rotate. S3 is rigidly attached to the elbow joint. The elbow joint is an acrylic fitting that hinges the two sections of the wings together, allowing the outboard section to flap. This is used during the upstroke when the span of the wing must be reduced using the span reduction servo housed in the fuselage. The fuselage of the model thus has a larger cross-sectional diameter than the natural bird.
$\times$
3mm to ensure torsional rigidity of the section and the aerofoil–spar joints. Each of the inboard aerofoils is rigidly attached to the spars S1 and S2. The outboard section of the wing consists of three aerofoils with reducing chord length and a circular cross-section carbon fibre–epoxy composite hollow spar. Aerofoils A6, A7 and A8 are not fixed to spar S3 but allowed to rotate. S3 is rigidly attached to the elbow joint. The elbow joint is an acrylic fitting that hinges the two sections of the wings together, allowing the outboard section to flap. This is used during the upstroke when the span of the wing must be reduced using the span reduction servo housed in the fuselage. The fuselage of the model thus has a larger cross-sectional diameter than the natural bird.
The technical specifications of the servos are given in the table below:
Table A.1 Specifications of servos
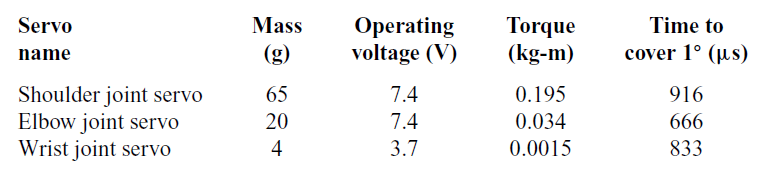
A.2 Wind-tunnel test configurations and results for each case
Here, we present the wind-tunnel test results in tabular form:
Case 1: shoulder joint, studying the effect of varying the flapping amplitude (
 $\boldsymbol{\phi}$
), flapping frequency (
f
) and stroke ratio (
$\boldsymbol{\phi}$
), flapping frequency (
f
) and stroke ratio (
 $\boldsymbol{\sigma}$
).
$\boldsymbol{\sigma}$
).
Table A.2 Test matrix and results for flapping amplitude analysis (all configurations with 0
 $^{\boldsymbol\circ}$
angle-of-attack and non-inclined flapping plane)
$^{\boldsymbol\circ}$
angle-of-attack and non-inclined flapping plane)
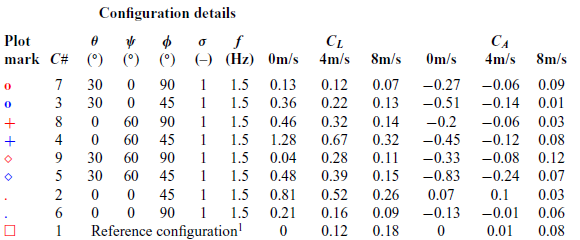
1fixed wing with complete open span and no twist.
Table A.3 Test matrix and results for flapping frequency analysis (all configurations with 0
 $^\circ$
angle-of-attack and non-inclined flapping plane)
$^\circ$
angle-of-attack and non-inclined flapping plane)

1fixed wing with complete open span and no twist.
Table A.4 Test matrix and results for stroke ratio analysis (all configurations with 0
 $^\circ$
angle-of-attack and non-inclined flapping plane)
$^\circ$
angle-of-attack and non-inclined flapping plane)

1fixed wing with complete open span and no twist.
Case 2: elbow joint, studying the effect of varying the span reduction (
 $\boldsymbol{\psi}$
)
$\boldsymbol{\psi}$
)
Table A.5 Test matrix and results for span reduction analysis (all configurations with 0
 $^\circ$
angle-of-attack and non-inclined flapping plane)
$^\circ$
angle-of-attack and non-inclined flapping plane)

1fixed wing with complete open span and no twist.
Case 3: wrist joint, studying the effect of varying the wing twist (
 $\boldsymbol{\theta}$
)
$\boldsymbol{\theta}$
)
Table A.6 Test matrix and results for outer-wing twist analysis (all configurations with 0
 $^\circ$
angle-of-attack and non-inclined flapping plane)
$^\circ$
angle-of-attack and non-inclined flapping plane)

1fixed wing with complete open span and no twist.
Case 4: effect of varying the angle-of-attack (
 $\boldsymbol{\alpha}$
)
$\boldsymbol{\alpha}$
)
Table A.7 Test matrix and results for angle-of-attack (AoA) configuration analysis

1fixed wing with complete open span and no twist.