


NOMENCLATURE
- CG
-
centre of gravity
- D
-
drag force
- DoF
-
degrees of freedom
- F
-
applied force
- g
-
gravitational acceleration
- I
-
mass moment of inertia
- l
-
(pendulum) length
- m
-
mass
- M
-
applied moment
- O
-
pivot point
- p q r
-
pendulum rotation rates
-
 $\bar{q}$
-
dynamic pressure
- S
-
reference area
- T
-
kinetic energy
- V
-
velocity
- X Y Z
-
coordinate axes
- ω
-
rotation rate
- ρ
-
air density
- ϕ θ ψ
-
pendulum attitude angles
- X
-
vector of states
- Y
-
vector of measurements
- J
-
mass moment of inertia tensor
- RO, CG
-
vector from point O to pendulum CG
- CD
-
non-dimensional drag coefficient
- C l β
-
rolling moment derivative due to sideslip
- C m α
-
pitching moment derivative due to angle of attack
- C n β
-
yawing moment derivative due to sideslip

Subscripts
- D
-
due to drag
- F
-
support frame
- g
-
due to gravity
- mf
-
due to added mass
- O
-
about point O
- TA
-
test article
- x y z
-
axes labels
Other
-
$(\,\dot{}\,)$
-
time derivative
$\frac{d}{dt}\left(\right)$
- bold
-
vectors/matrices
- x T
-
transpose of x
- [dps]
-
units: degrees per second


1.0 INTRODUCTION
Small fixed wing Un-manned Aerial Vehicles (UAV) are gaining increasing interest due to ongoing miniaturisation of electronic systems(Reference Meier, Honegger and Pollefeys1). They can be equipped to fly sensor payloads not possible even a few years ago. The small-scale enables relatively easy operation with consideration to cost and manpower. This makes the small-scale fixed-wing UAVs popular with university researchers, prototype and system developers, hobbyists, and other groups with limited resources, such as small start-up companies.
Airframe inertial properties have been of interest since the early days of aviation because of their importance in characterising the handling qualities of aircraft. Their importance has now further increased due to the use of automated flight control systems. Modern model-based control systems require an accurate model of the airframe which includes the mass and inertial properties. The same is true for flight simulation applications. With the growing importance of UAVs, it is becoming crucial to obtain estimates for these properties for small-scale flight vehicles.
This paper describes work carried out during the development of a UAV flight test facility at the University of Sydney. The project aimed to develop experimental instrumentation and methods to acquire accurate flight test data from small-sized, fixed-wing UAVs. To perform system identification (ID) on the flight data, the inertial properties of the UAVs had to be determined accurately. On new UAV designs, usually a sufficiently detailed CAD model would be used to determine the inertial properties of the airframe. This was not possible for the existing, commercial UAV design under consideration here, because the airframe structure is too complex to draw up precisely in CAD without destructively dismantling the aircraft, particularly since no engineering drawings were available. The only possible method to estimate the inertial properties, in a time and cost effective manner, was by experiment.
In this paper, the common single degree of freedom (1DoF) pendulum method and a novel, three degree of freedom (3DoF) pendulum method are tested and compared. The 3DoF method requires only a single swing test to obtain the entire inertia tensor at once. This is potentially easier and less time-consuming, because the test article has to be mounted onto and aligned with the test rig only once, compared to the three orientations required for the 1DoF method (four, if IXZ is required as well). The 3DoF method has not previously been applied to fixed-wing UAVs, leading to accuracy and usefulness of the method being investigated for this case. Furthermore, significant corrections for aerodynamic influences on the pendulum motion are required to achieve an accurate test result for small-scale fixed-wing UAVs. Methods to develop and apply these corrections are tested and discussed in this paper.
2.0 BACKGROUND
Reference 2 presents a review of available inertia measurement methods for various purposes. The main difference between the various methods is the use of either forced or free oscillations. Forced oscillation methods use an apparatus to force the test specimen into either translational or torsional oscillations(Reference de Jong and Mulder3) with the inertial properties being measured indirectly by the force or moment required to move the test article. These methods can be very accurate(Reference Brancati, Russo and Savino4) but require a complicated and expensive apparatus that is prohibitive for typical low-budget university research.
Free oscillation methods use some sort of translational or torsional pendulum. These will oscillate freely under the influence of gravity alone, once displaced from rest and released. Pendulum designs have been used with a single suspension wire as the simplest method or using multiple suspension wires to create either a translational or torsional pendulum(Reference Korr and Hyer5,Reference Previati, Gobbi and Mastinu6) . The latter is more suitable for aircraft applications, because a multi-wire pendulum will hold the test article in a defined attitude.
The most widely used pendulum swing experiment for aircraft is the two-wire translational pendulum, used since the 1930s(Reference Miller7). An extension of the basic method(Reference Soule and Miller8) discusses the aerodynamic effects affecting the pendulum motion due to the geometric properties of fixed-wing aircraft (buoyancy, entrapped air mass and the air mass that travels with the pendulum) and gives empirical methods to estimate the magnitude of those corrections, based on the geometric properties of typical aircraft components. These aerodynamic effects can add up to 20% on top of the true airframe inertias and are therefore very significant(Reference Soule and Miller8).
A further extension of the pendulum method(Reference Gracey9) from 1948 indicates that a major source of difficulty of all previously mentioned methods is the requirement to accurately determine the pendulum length, which is the distance from the pivot to the pendulum CG. The difficulty lies with how the vertical CG position of the aircraft with respect to the pendulum pivot is to be determined. This method proposes to swing the pendulum with two different arbitrary lengths and use the two results to simultaneously solve for the pendulum lengths. This is potentially more accurate than measuring this quantity. A different method was developed in 1950(Reference Turner10) to enable inertia measurements for large and heavy airframes. The pendulum method is impractical for such large airframes and it was replaced by a ground-based spring support. Otherwise, this method is similar to the pendulum method.
A novel method that uses multi-degree of freedom motion together with system identification(Reference de Jong and Mulder3), uses an apparatus which simultaneously allows rotation about the pitch and yaw axes and translation along the roll and pitch axes. The method does not require the measurement of the CG position of the test article, compared to the previously mentioned techniques. On the other hand, the required test apparatus is very complex.
There have been some existing references dealing specifically with small-scale UAVs(Reference Shakoori, Betin and Betin11-Reference Kotikalpudi, Taylor, Moreno, Pfifer and Balas15). Reference 11 compares different pendulum methods. The other references all use some form of the standard bifilar pendulum apparatus. On the very small-scale, Ref. 16 reports on a test of a small quad-rotor flight vehicle. The paper also performs a comparison with a CAD modelling method and concludes that considerable errors between physical experiments and CAD modelling are possible, unless extreme care in the modelling is taken. Another very promising, novel method, specifically for small-scale UAVs(Reference Bottasso, Leonello, Maffezzoli and Riccardi17), is based on a 3DoF pendulum, suspended from a three-axis gimbal. It uses system identification of the pendulum motion to estimate the entire inertia tensor at once. This method is the basis for the second technique to be presented in this paper.
As noted above, the results of the swinging tests of aircraft require substantial corrections due to aerodynamic effects. A very interesting report regarding these corrections looks into all kinds of error sources for a clock pendulum(Reference Lupton18). Some of these errors are very relevant for the current project and are indeed the same as reported by Soule and Miller(Reference Soule and Miller8). Other error sources, such as the change in gravitational acceleration due to to the position of the moon with respect to earth, are affecting only the long-term stability of a clock pendulum and do not need to be accounted for during the short experiment durations of the airframe swing tests.
Using system ID of the pendulum motion instead of timing the oscillation periods(Reference Soule and Miller8,Reference Gracey9) has proven more reliable for the small inertias involved, because the system ID method uses the full motion data to estimate frequency and damping instead of characterising the motion from a few single data points from a timer. It is possible to obtain reasonably accurate data using a millisecond precision timer, but exploratory tests have shown that this requires many more experiment repeats than using the system ID method. Most recent implementations of inertia experiments use system ID for the data processing(Reference de Jong and Mulder3,Reference Mendes, van Kampen, Remes and Chu16,Reference Bottasso, Leonello, Maffezzoli and Riccardi17) , and a similar approach has been taken for the presented work.
3.0 THEORY OF PENDULUM MOTION
3.1 1 DoF pendulum
The equations of motion for a rigid-body, 1DoF pendulum can be developed from the free-body diagram in Fig. 1. The test article with mass m, inertia I and frontal area S swings about pivot point O. The pendulum length or the distance between O and the CG of the test article is l. From Euler’s second law, the rotational equation of motion for the rigid-body pendulum can be written as
 $$\begin{equation}
M=I_O\dot{\omega }
\end{equation}$$
$$\begin{equation}
M=I_O\dot{\omega }
\end{equation}$$
where M is the applied moment about O, IO
the inertia of the pendulum about O and
 $\dot{\omega }$
the rotational acceleration of the pendulum.
$\dot{\omega }$
the rotational acceleration of the pendulum.

Figure 1. Free-body diagram of a physical pendulum.
For the system identification algorithm, the equations of motion need to be expressed in state space form, depending on the state derivative vector
 $\dot{\mathbf {X}}$
and the measurement vector Y. The state vector for the pendulum is X = [θ ω]
T
, where ω is the rotation rate of the pendulum and θ the attitude angle. Using Equation (1), the state rate equations for the rigid-body pendulum become
$\dot{\mathbf {X}}$
and the measurement vector Y. The state vector for the pendulum is X = [θ ω]
T
, where ω is the rotation rate of the pendulum and θ the attitude angle. Using Equation (1), the state rate equations for the rigid-body pendulum become
 $$\begin{equation}
\mathbf {\dot{X}} = \left[ \begin{array}{c}\dot{\theta } \\
\dot{\omega } \end{array} \right] = \left[ \begin{array}{c}\omega \\
M/I_O \end{array} \right]
\end{equation}$$
$$\begin{equation}
\mathbf {\dot{X}} = \left[ \begin{array}{c}\dot{\theta } \\
\dot{\omega } \end{array} \right] = \left[ \begin{array}{c}\omega \\
M/I_O \end{array} \right]
\end{equation}$$
The applied moment is the sum of the moment due to the gravitational acceleration, which is driving the motion, and the opposing moments due to aerodynamic drag and bearing friction. The moment due to the gravitational acceleration about point O is
 $$\begin{equation}
M_g = -mgl\sin \theta
\end{equation}$$
$$\begin{equation}
M_g = -mgl\sin \theta
\end{equation}$$
The moment due to the drag about point O opposes the motion according to
 $$\begin{equation}
M_D = - \bar{q}SC_D\times l \times sign(\omega ),
\end{equation}$$\\
$$\begin{equation}
M_D = - \bar{q}SC_D\times l \times sign(\omega ),
\end{equation}$$\\
 $$\begin{equation}
= -0.5 \rho S C_D \omega^{2} l^{3} sign(\omega )
\end{equation}$$
$$\begin{equation}
= -0.5 \rho S C_D \omega^{2} l^{3} sign(\omega )
\end{equation}$$
 $\bar{q}=0.5\rho V^2$
and V = ωl. The term sign(ω) ensures that the drag force is always opposing the direction of the motion. Friction in the bearings is small compared to the drag of the test article and will not be modelled separately. It has a similar effect on the motion as the drag; therefore, the identified drag coefficient will be slightly higher due to that friction.
$\bar{q}=0.5\rho V^2$
and V = ωl. The term sign(ω) ensures that the drag force is always opposing the direction of the motion. Friction in the bearings is small compared to the drag of the test article and will not be modelled separately. It has a similar effect on the motion as the drag; therefore, the identified drag coefficient will be slightly higher due to that friction.
So far, the equations of motion for the pendulum include the inertia of the pendulum about the pivot O. If the inertia of the test article about its CG is desired, the parallel axis theorem can be used to express the inertia IO of the pendulum as
 $$\begin{equation}
I_O=I+ml^2
\end{equation}$$
$$\begin{equation}
I_O=I+ml^2
\end{equation}$$
The measurement or output equations Y consist of the two states θ and ω that will be measured directly by the rig instrumentation. Using the above derivations, the final equations of motion can be written as
 $$\begin{equation}
\mathbf{\dot{X}} = \left[\begin{array}{c}
\dot{\theta } \\
\dot{\omega } \end{array} \right]=\left[\begin{array}{c}
\omega \\
\frac{M_g+M_D}{I+ml^2}
\end{array} \right],
\end{equation}$$\\
$$\begin{equation}
\mathbf{\dot{X}} = \left[\begin{array}{c}
\dot{\theta } \\
\dot{\omega } \end{array} \right]=\left[\begin{array}{c}
\omega \\
\frac{M_g+M_D}{I+ml^2}
\end{array} \right],
\end{equation}$$\\
 $$\begin{equation}
\mathbf{Y} = \left[\begin{array}{c}
\theta \\
\omega
\end{array}
\right] = \left[\begin{array}{c@{\quad}c}
1 0\\
0 1 \end{array}
\right]
\left[\begin{array}{c}
\theta \\
\omega \end{array}
\right]
\end{equation}$$
$$\begin{equation}
\mathbf{Y} = \left[\begin{array}{c}
\theta \\
\omega
\end{array}
\right] = \left[\begin{array}{c@{\quad}c}
1 0\\
0 1 \end{array}
\right]
\left[\begin{array}{c}
\theta \\
\omega \end{array}
\right]
\end{equation}$$
Inspecting Equation (7), some important implications for the experimental methodology can be immediately deducted. Firstly, because the expected inertias I of the test article are going to be small, it is paramount to make the pendulum length l as short as possible. For a small fixed-wing UAV, the parallel axis component of the total inertia of the pendulum, ml 2, will always be large compared to the test article inertia I, and will dominate the magnitude of the denominator in Equation (7). If the pendulum is long, this will be even more significant. A long pendulum, therefore, makes it very difficult to identify the small inertia I with good precision. This problem has also been referred to in Refs 8 and 17.
Secondly, using knowledge of the system identification algorithm, it is also beneficial to estimate the full inertia of the pendulum about the pivot (IO = I + ml 2) instead of estimating the inertia of the test article I in isolation. The parallel axis theorem can be applied after the estimate for IO has be determined. The system ID algorithm perturbs each parameter by a small amount and calculates the significance of this perturbation onto the fit of the estimated system response to the measured data. Now, if Equation (7) is used in its stated form, a small perturbation of the parameter I will not have a significant effect on the magnitude of the denominator because ml 2 is always much larger in magnitude. Perturbing I + ml 2 instead gives a more robust response and the algorithm converges much faster and more accurately. Carefully considering those two issues during the experimental design is the first step to an accurate estimate of small-scale fixed-wing UAV inertial properties.
To determine the pendulum length l, the vertical CG location of the test article must be known precisely with respect to a reference point(Reference Miller7). This can be achieved by suspending the test article from a point longitudinally and vertically offset from the CG, as shown in Fig. 2(a). A vertical line from the suspension point to the longitudinal CG location will indicate the vertical CG position as shown in the figure. This can then be measured from any convenient reference line on the test article as indicated. The length l is then the distance from the pivot to this reference line plus the above measurement to the vertical CG of the test article. For a combination of objects, such as the test article mounted on a support frame, as shown in Fig. 2(b), the pendulum length l to the combined CG can be found from a moment balance about point O
 $$\begin{equation}
l = \frac{m_Fl_F+m_{TA} l_{TA}}{m_F+m_{TA}},
\end{equation}$$
$$\begin{equation}
l = \frac{m_Fl_F+m_{TA} l_{TA}}{m_F+m_{TA}},
\end{equation}$$
where the subscript F denotes the properties of the support frame and TA the properties of the test article.

Figure 2. Pendulum CG definitions.
The pendulum uses a support frame to hold the test article. This removes the need for any wire attachment points on the test article. Hence, after the swing test results are obtained, a final step is necessary to extract the inertial properties of the UAV about its CG. This step is the removal of the support frame inertias from the results. The support frame properties have to be determined beforehand by a separate experiment or other means, such as CAD modelling. A simple way of doing this would be to just subtract the inertias of the frame from the combined result, but this would lead to error because the inertia of the frame is typically measured about its own CG, which can be quite different from the combined CG location, as shown in Fig. 2(b). In addition, the CG location of the UAV is unlikely to be identical to the combined CG position as illustrated in the figure. To separate the inertial properties of the frame and the UAV accurately, it is therefore necessary to apply the parallel axis theorem, using the masses and dimensions given in Fig. 2(b). This leads to the equation for the test article inertia ITA about its CG
 $$\begin{equation}
I_{TA}=-[I_F+m_F\times l_2^2]-m_{TA}\times (-l_1)^2+I_{meas},
\end{equation}$$
$$\begin{equation}
I_{TA}=-[I_F+m_F\times l_2^2]-m_{TA}\times (-l_1)^2+I_{meas},
\end{equation}$$
where IF is the frame inertia about its CG, mF the frame mass, mTA the test article mass, Imeas the combined inertia result from the system ID and the dimensions li as defined in Fig. 2(b).
3.2 3 DoF pendulum
The three-dimensional rigid-body pendulum, similar to that introduced in Ref. 17, is an extension of the 1DoF pendulum from the previous section. Figure 3 shows a sketch of the support frame with the axes definitions. The figure also contains an image of the 3DoF gimbal used to suspend the pendulum.

Figure 3. 3DoF Pendulum diagram and three-axis motion gimbal.
In Ref. 17, all equations were developed in the body frame of the pendulum with origin at the CG of the pendulum. As mentioned above, this is not ideal because it leads to numerical issues during the system identification. Hence all equations are developed in the earth fixed frame with origin at the gimbal pivot point O. This increases the stability of the system ID procedure. The body axes inertia tensor about the pendulum CG is computed using the parallel axes theorem as a second step.
The derivation method of the equations of motion for the 3DoF rigid-body pendulum is similar to the single-axis pendulum described before. Euler’s second law, now in three dimensions, describes the oscillatory motion of the rigid body as
 $$\begin{equation}
\mathbf {M}=\mathbf {J}\mathbf {\dot{\omega }}+\mathbf {\omega } \times \mathbf {J}\mathbf {\omega },
\end{equation}$$
$$\begin{equation}
\mathbf {M}=\mathbf {J}\mathbf {\dot{\omega }}+\mathbf {\omega } \times \mathbf {J}\mathbf {\omega },
\end{equation}$$
with M being the applied moment vector about the pivot point, J the inertia tensor of the pendulum about the pivot, and ω the vector of angular velocities p, q and r of the pendulum. For a typical aircraft with symmetry about the xz plane, the inertia tensor simplifies to
 $$\begin{equation}
\mathbf {J}=\left[\begin{array}{c@{\quad}c@{\quad}c}I_x & 0 & I_{xz} \\
0 & I_y & 0 \\
I_{xz} & 0 & I_z \end{array} \right]
\end{equation}$$
$$\begin{equation}
\mathbf {J}=\left[\begin{array}{c@{\quad}c@{\quad}c}I_x & 0 & I_{xz} \\
0 & I_y & 0 \\
I_{xz} & 0 & I_z \end{array} \right]
\end{equation}$$
The state space form of Equation (11) with states ω = [p q r] T , as required for the system ID algorithm, can be written as
 $$\begin{equation}
\dot{\omega } = \mathbf {J^{-1}}(-\omega \times \mathbf {J}\omega )+ \mathbf {J^{-1}}\mathbf {M}
\end{equation}$$
$$\begin{equation}
\dot{\omega } = \mathbf {J^{-1}}(-\omega \times \mathbf {J}\omega )+ \mathbf {J^{-1}}\mathbf {M}
\end{equation}$$
Similar to the 1DoF pendulum, the applied moment is the sum of the moment due to gravity and the moments caused by bearing friction and aerodynamic drag. The gravitational force vector acting at the CG is F g = m g. The moment due to gravity can then be obtained by defining a vector RO, CG from the pivot point to the pendulum CG and taking the cross-product
 $$\begin{equation}
\mathbf {M}_G = \mathbf {R_{O,CG}}\times \mathbf {F}_G
\end{equation}$$
$$\begin{equation}
\mathbf {M}_G = \mathbf {R_{O,CG}}\times \mathbf {F}_G
\end{equation}$$
The components of the vector RO, CG in the earth fixed frame can be found by rotating the body axes vector RO, CG = [0 0 l] T between the pivot point and the pendulum CG (as shown in Fig. 3) into the earth fixed axes using standard orthogonal transforms.
The damping terms are the moments due to bearing friction and the moment of the aerodynamic drag of the pendulum about the pivot point. The drag vector is the opposite of the velocity vector, which, due to the complicated motion of the 3DoF pendulum, constantly changes direction. Also, the drag will be different about each axis because the aircraft shape. Therefore, the drag is treated in component form for each axis, similarly to the bearing friction. No other aerodynamic force is expected to create a significant moment about the pivot point to influence the motion. Drag and bearing friction have a similar effect on the motion and can be combined into a single vector MD = [M D, x M D, y M D, z ], unless their separate numerical values are of interest. For this project, this was not the case, so the applied moment becomes
 $$\begin{equation}
\mathbf {M} =\mathbf {R_{O,CG}}\times \mathbf {F} - \mathbf {M_D}
\end{equation}$$
$$\begin{equation}
\mathbf {M} =\mathbf {R_{O,CG}}\times \mathbf {F} - \mathbf {M_D}
\end{equation}$$
Expanding M into its components gives
 $$\begin{equation}
\left[\begin{array}{c}M_x \\
M_y\\
M_z \end{array} \right] = l\left[\begin{array}{c}\cos \phi \sin \theta \\
-\sin \phi \\
\cos \phi \cos \theta \end{array} \right] \times mg \left[\begin{array}{c}0 \\
0 \\
1 \end{array} \right] - \left[\begin{array}{c}M_{D,x} \\
M_{D,y} \\
M_{D,z} \end{array} \right],
\end{equation}$$\\
$$\begin{equation}
\left[\begin{array}{c}M_x \\
M_y\\
M_z \end{array} \right] = l\left[\begin{array}{c}\cos \phi \sin \theta \\
-\sin \phi \\
\cos \phi \cos \theta \end{array} \right] \times mg \left[\begin{array}{c}0 \\
0 \\
1 \end{array} \right] - \left[\begin{array}{c}M_{D,x} \\
M_{D,y} \\
M_{D,z} \end{array} \right],
\end{equation}$$\\
 $$\begin{equation}
= mgl \left[\begin{array}{r}-\sin (\phi )-M_{D,X} \\
-\cos (\phi )\sin (\theta )-M_{D,Y} \\
-M_{D,Z} \end{array} \right]
\end{equation}$$
$$\begin{equation}
= mgl \left[\begin{array}{r}-\sin (\phi )-M_{D,X} \\
-\cos (\phi )\sin (\theta )-M_{D,Y} \\
-M_{D,Z} \end{array} \right]
\end{equation}$$
The above equations require the attitude angles ϕ, θ and ψ of the pendulum with respect to the earth fixed frame. These states can be added to yield the final state vector
 $$\begin{equation}
\mathbf {X} = [\phi \quad \theta \quad \psi \quad p \quad q\quad r]^T,
\end{equation}$$
$$\begin{equation}
\mathbf {X} = [\phi \quad \theta \quad \psi \quad p \quad q\quad r]^T,
\end{equation}$$
where the angles ϕ, θ and ψ are the attitude angles of the pendulum in the X, Y and Z axis, respectively.
The state rate equations for the Euler attitude angles can be found in any reference book on flight mechanics, such as Ref. 19. These, together with Equations (13) and (17) give the final equations of motion for the 3DoF rigid-body pendulum
 $$\begin{equation}
\dot{\phi } = p + \tan (\theta )(q\sin (\phi )+r\cos (\phi )),
\end{equation}$$\\
$$\begin{equation}
\dot{\phi } = p + \tan (\theta )(q\sin (\phi )+r\cos (\phi )),
\end{equation}$$\\
 $$\begin{equation}
\dot{\theta } = q\cos (\phi ) - r\sin (\phi ),
\end{equation}$$\\
$$\begin{equation}
\dot{\theta } = q\cos (\phi ) - r\sin (\phi ),
\end{equation}$$\\
 $$\begin{equation}
\dot{\psi } = [q\sin (\phi )+r\cos (\phi )]/\cos (\theta ),
\end{equation}$$\\
$$\begin{equation}
\dot{\psi } = [q\sin (\phi )+r\cos (\phi )]/\cos (\theta ),
\end{equation}$$\\
 $$\begin{equation}
\dot{p} = I_{xz}\Gamma [q(I_x p+I_{xz}r)-I_y p q]+I_z \Gamma [q(I_{xz}p+I_z r)-I_y q r]-I_z M_x \Gamma +I_{xz} Mz\Gamma ,\qquad\quad
\end{equation}$$\\
$$\begin{equation}
\dot{p} = I_{xz}\Gamma [q(I_x p+I_{xz}r)-I_y p q]+I_z \Gamma [q(I_{xz}p+I_z r)-I_y q r]-I_z M_x \Gamma +I_{xz} Mz\Gamma ,\qquad\quad
\end{equation}$$\\
 $$\begin{equation}
\dot{q} = [p(I_{xz} p+I_z r)-r(I_x p+I_{xz} r)]/Iy+M_y/Iy,
\end{equation}$$\\
$$\begin{equation}
\dot{q} = [p(I_{xz} p+I_z r)-r(I_x p+I_{xz} r)]/Iy+M_y/Iy,
\end{equation}$$\\
 $$\begin{equation}
\dot{r} = -I_x\Gamma [q(I_xp+I_{xz}r)-I_y p q]-I_{xz}\Gamma [q(I_{xz}p+I_z r)-I_y q r]+I_{xz}M_x\Gamma -I_xM_z\Gamma ,\qquad\qquad
\end{equation}$$
$$\begin{equation}
\dot{r} = -I_x\Gamma [q(I_xp+I_{xz}r)-I_y p q]-I_{xz}\Gamma [q(I_{xz}p+I_z r)-I_y q r]+I_{xz}M_x\Gamma -I_xM_z\Gamma ,\qquad\qquad
\end{equation}$$
 $$\begin{equation}
\mathbf {Y}= \mathbf {I}\times [\phi \quad \theta \quad \psi \quad p\quad q\quad r]^T,
\end{equation}$$
$$\begin{equation}
\mathbf {Y}= \mathbf {I}\times [\phi \quad \theta \quad \psi \quad p\quad q\quad r]^T,
\end{equation}$$
where I is the identity matrix. The identified inertias about the pivot can then be transferred to the test article CG using the parallel axis theorem as before. The only terms affected are Ix and Iy , while for Iz and Ixz , the parallel axis theorem component is zero. The procedure of removing the support frame inertias from the solution is identical to the single-axis pendulum method.
4.0 AERODYNAMIC EFFECTS ON ESTIMATED INERTIAL PROPERTIES
During the swing experiments, the pendulum is immersed in a fluid (the surrounding air); therefore, the measured inertial properties will be affected by added mass due to the enclosed air, the buoyancy of the airframe in the surrounding air, and by the inertia of the air being accelerated by the pendulum(Reference Soule and Miller8,Reference Lupton18,Reference Brennen20) . Hence, the measured inertia Imeas will be different from the test article inertia ITA measured in a vacuum. Added mass is a general term for all aerodynamic effects that change the measured inertia of a body immersed in a fluid, as if the mass of the body itself was changed. The influence of buoyancy and enclosed air mass actually results in a change in weight of the test article, where buoyancy reduces the measured weight and the enclosed air adds to the measured weight of the test article, respectively. The added mass due to the inertia of the fluid accelerated by the pendulum motion is caused by a momentum change of the surrounding fluid due to an acceleration of the pendulum. It has the same form as a mass term(Reference Brennen20), hence the name.
As explained by Brennan(Reference Brennen20), a body moving through a fluid adds a certain amount of kinetic energy to the fluid. That kinetic energy T can be written for steady and rectilinear motion as
 $$\begin{equation}
T=\frac{1}{2}m_{fluid}V^2
\end{equation}$$
$$\begin{equation}
T=\frac{1}{2}m_{fluid}V^2
\end{equation}$$
or, if incompressible flow is assumed,
 $$\begin{equation}
T=\frac{1}{2}\rho \zeta V^2 \quad \mathrm{where} \quad \zeta =\int _V \frac{v_x}{V}\frac{v_y}{V}\frac{v_z}{V}dV,
\end{equation}$$
$$\begin{equation}
T=\frac{1}{2}\rho \zeta V^2 \quad \mathrm{where} \quad \zeta =\int _V \frac{v_x}{V}\frac{v_y}{V}\frac{v_z}{V}dV,
\end{equation}$$
where V is the velocity of the body and the integral ζ is a measure of the volume of fluid affected by the motion of the body inside the entire fluid domain V. The resulting differences in velocity relative to V in the flow field are denoted vi . The product ρζ is then the mass of fluid affected by the motion of the object. The integral ζ is constant for constant velocity V.
When the body accelerates or decelerates, as it constantly does during pendulum motion, the velocity V of the body changes and with that the kinetic energy T imparted on the fluid. This requires additional work to be done by the body, which is simply dT/dt. The rate of work done can then be expressed as FDV, where FD is an additional drag force. Assuming that ζ is constant, that is, the flow pattern does not change, the added drag, FD , is
 $$\begin{equation}
F_D=\frac{1}{V}\frac{dT}{dt}\quad =\quad \rho \zeta \frac{dV}{dt} \quad =\quad m\frac{dV}{dt},
\end{equation}$$
$$\begin{equation}
F_D=\frac{1}{V}\frac{dT}{dt}\quad =\quad \rho \zeta \frac{dV}{dt} \quad =\quad m\frac{dV}{dt},
\end{equation}$$
where the sign of the force depends on whether the body accelerates or decelerates. The added drag force FD has the same form and sign as a force required to accelerate or decelerate the mass m of the body. Therefore, the term ρζ can be interpreted as an additional mass mf of fluid that is being accelerated or decelerated by the body. This added mass mf has an inertia about the axis of rotation and hence the inertia measured is
 $$\begin{equation}
I_{meas}=I_{TA}+I_{m_f}
\end{equation}$$
$$\begin{equation}
I_{meas}=I_{TA}+I_{m_f}
\end{equation}$$
It should be observed that this added drag force is different from the ‘conventional’ drag force, which is proportional to the square of the velocity of the body. The added drag described here is proportional to the change in velocity of the body. Given the direct dependency on the fluid density ρ and the high density of water, this effect is very important especially for hydrodynamic problems(Reference Brennen20,Reference Lin and Liao21) . However, it is also critical for the correct determination of airframe inertial properties as previously discovered(Reference Soule and Miller8).
For full-scale aircraft, the corrections due to the added-mass typically amount to 3% of the measured inertias due to buoyancy. The enclosed air adds around 5% in the X axis and is negligible in the Y axis. Another 20% are added in the X-axis due to I mf , while errors in Y and Z, caused by I mf , are about 5%(Reference Soule and Miller8). For small-scale UAVs, the enclosed air mass and buoyancy are negligible because the airframes only have small internal volumes and the volume of their structures is also small. Hence, the added mass due to these two effects will only add the equivalent of a few grams of weight to a 2–5kg airframe; therefore, these two corrections can be neglected. The third correction, I mf , however, is very significant for small-scale UAV and thus requires careful consideration. For example, the correction due to I mf in the X axis is 25.1% for the UAV used for this research.
Methods have previously been developed to estimate I mf (Reference Soule and Miller8,Reference Malvestuto and Gale22,Reference Gracey23) . These methods are based on test data for flat plates and ellipsoids to model the airframe’s shape from these basic bodies. The corrections for the full test articles are then assumed to be the sum of the corrections for the separate components, ignoring potential interference effects between the parts. For full-scale aeroplanes, this appears to work quite well, with resulting inertia estimates within 2.5% or less of the true value(Reference Malvestuto and Gale22).
Applying the previously published methods to the given UAV geometry results in corrections that are an order of magnitude too small. It is unclear why this happens, since the datasets in Refs 22 and 23 are missing crucial information to reproduce the findings. Alternatively, Brennan(Reference Brennen20) introduces a method for estimating the corrections based on results of a potential flow solver. Lin and Liao(Reference Lin and Liao21) handled the same problem using modern fluid-structure interaction solvers. Both methods are conceptually very difficult and were beyond the scope of this project. Instead, geometrically similar models with known inertial properties, together with additional swing tests, will be used to determine the corrections due to I mf for the given UAV.
It should be noted that none of the available publications on UAV inertial properties(Reference Shakoori, Betin and Betin11-Reference Kotikalpudi, Taylor, Moreno, Pfifer and Balas15) acknowledge the requirement of these corrections. These reported results must, therefore, be treated with care.
5.0 METHODOLOGY
The UAV used in this work is based on a commercially available model of a Piper Cherokee, which has been extensively upgraded and equipped with a state-of-the-art miniature flight data recorder. The UAV is used to develop system identification techniques for this scale of aircraft. The UAV has 1.5m wingspan, weighs 4kg and is built from a balsa wood frame with a film cover, which is a standard construction method for this size of airframe(Reference Carpenter24-Reference Siegmann26). In addition to the UAV, several other test articles were used to test and verify the method. These were generally simple shapes, where the true inertias could be derived from a CAD model. This allowed to benchmark the methods with a known object, and also to generate estimates for the aerodynamic corrections required.
The two pendulum experiments require an apparatus that allows the test article to be mounted onto a support frame that can swing about a single axis for the 1DoF case and about three axes for the 3DoF case. Initially, the traditional knife edge suspension design(Reference Soule and Miller8) was used for the 1DoF case, and the three-axis motion gimbal for the 3DoF case. Testing has shown, however, that there is very little difference in the results if the gimbal is used for the 1DoF case as well. One simply has to be careful to initiate the oscillations about a single axis only. Consequently, only the gimbal suspension rig was used for this work, which allowed a common apparatus between the methods. The axes definitions for both experiments follow the standard flight mechanics conventions with X forward, Y out to the right wing and Z down.
5.1 Experiment set-up
The experimental set-ups for the 1DoF and 3DoF cases are quite similar. The only difference is the design of the support frame. The 1DoF frame allows the airframe to be placed on its side for the Z axis measurements. To keep the pendulum length short, the frame has a bay for the test article to placed in, as shown in Fig. 4(b). The 3DoF frame, as shown in Fig. 5, is flat because the test article can remain in a single position during the tests. The support frame is suspended from a three-axis gimbal on four steel cables to form the pendulum. The gimbal contains high-quality ball bearings to keep friction as low as possible. The gimbal is mounted onto a rigid cantilever beam framework, as shown in Fig. 4.

Figure 4. UAV inertia measurement rig.

Figure 5. UAV inertia measurement rig for the 3DoF case without test article.
The data acquisition system can be seen at the bottom of the frame in Fig. 4(a). It consists of a miniature 9DOF IMU (Vectornav VN-100(27)) and a small, custom-designed processing unit that is connected via wireless network to a control station. All data was recorded at 100 Hz into the memory of the processing unit, so no time delays caused by the wireless connection need to be considered. The data measured and recorded are the rotation rates and the attitude angles of the frame.
Further data required from the experiments are the mass m of the pendulum, the gravitational acceleration g and the distance from the pivot to the test article CG l. Gusev(Reference Gusev28) reported on highly accurate measurements for the gravitational acceleration at the University of Sydney, where this work was conducted. For the pendulum length, the vertical CG position of the frame and test article was measured using the method of off-CG suspension illustrated in Fig. 2(a). As discussed during the derivation of the equations of motion, the pendulum must be as short as possible for good results. The limiting factor is the wing span of the test airframe, which can seen in Fig. 4(b). It would be possible to use a shorter length for the X and Y cases, but during testing, it was shown that the increases in accuracy did not warrant the extra effort in using two separate pendulum lengths.
5.1.1 1 DoF pendulum
The support frame for the 1DoF case was designed to accept the UAV horizontally for the X and Y axes and and lying on its side for the Z axis as shown in shown in Fig. 4. This way, all axes could be tested using the bifilar pendulum, avoiding the difficult trifilar pendulum method typically used for the Z axis(Reference Miller7-Reference Gracey9). The difficulty of the trifilar pendulum is the requirement to excite the pendulum in pure rotation about the CG. In practice, it is very difficult, if not impossible, to set the pendulum in motion without causing translations. In addition, the aerodynamic damping is large due to the vertical fin of the UAV. This makes it difficult to obtain a sufficient number of oscillations for a valid measurement.
In each case, the UAV CG was aligned precisely below the pivot point (along the Z axis). An advantage of the additional degrees of freedom of the gimbal is that the UAV does not have to be moved for the two horizontal cases, which minimises errors due to CG alignment. Each test was initiated from rest by manually deflecting the frame in one axis by about 5° and letting go. Using only very small initial deflections reduces the damping due to the drag. The oscillation was allowed a few seconds to settle from the disturbance of the release into pure unforced oscillation before the data recording was started. Each recording was about 40 seconds and was repeated at least five times.
5.1.2 3 DoF pendulum
The support frame for the 3DoF experiment is shown in Fig. 5. The test article has to be placed on the frame in a single, horizontal orientation only. This enables a shorter pendulum, as shown in the figure. The frame is essentially a flat version of the previous frame, which makes it easier to locate its vertical CG location. It also reduces the inertias of the frame itself, which have to be removed from the test results. The data acquisition system is located in the plane of the frame and is identical to the 1DoF case.
The tests were initiated manually as before. As will be discussed in the next section, the starting attitude is very critical to obtain good results with this method. It is also necessary to vary the initial deflections to obtain multiple solutions for a better judgement of the data quality. To achieve this, the pendulum was deflected between 5° and 10° about X and Y and released. This was repeated multiple times with varying attitudes. Each recording was 50 seconds, on average.
5.2 Data processing
The recorded data was then prepared for use with the output error system identification algorithm(Reference Klein and Morelli19). Due to the long datasets and the low-frequency content the sample rate was reduced by a third from the nominal rate of 100 Hz without loss of information. The down-sampling was done by low pass filtering the data with a 10 Hz cut-off and then re-sampling it at 33.3 Hz. This reduces the runtime of the algorithm considerably without affecting the accuracy of the parameter estimates.
5.2.1 1 DoF pendulum
The output error method for the 1DoF case uses the equations of motion of Equation (7). Parameters to estimate are the inertia IO and the drag coefficient CD . Initial values for the parameters were generated by trial and error, based on available information like previous test results or CAD results for the reference bodies. Figure 6 shows an example dataset with the model output Y and the experimental data Z plotted on top of each other for comparison. The figure also contains plots of the residuals Z − Y.

Figure 6. Example swing data with model fit and residuals.
The figure shows excellent agreement between the data and the model in both frequency and damping of the oscillation. The residuals for the pitch rate q are purely random noise with less than 1% of the signal amplitude. The pitch angle θ residuals still contain some sinusoidal component. This is caused by a small phase error between the model and the experimental data. This phase error is most likely the result of a small error in the initial value for θ and is of no consequence for the accuracy of the results. The quality of the model fit is similar across all three axes, and it is repeatable to a very high degree of accuracy as will be shown later. Therefore, the model of the pendulum motion as developed above is correctly describing the data and can be used to identify the inertia of the pendulum with high accuracy.
5.2.2 3 DoF pendulum
The system ID for the 3DoF case uses the model equations Equations (24). Estimated parameters are the four inertia terms Ix , Iy , Iz and Ixz , together with the three damping terms. Figure 7 shows a typical result of the process, plotting the model over the measured data and showing the residuals similarly to the 1DoF case. The model fit to the data is excellent, which proves that Equation (24) describe the motion correctly. The assumption of any aerodynamic force other than drag being insignificant appears correct. There are some minor phase differences in the residuals which are most likely caused by an imperfect pendulum release, but these have no influence on the final results. On release, the pendulum probably may have not been fully at rest or the disturbance of the release may not have completely dissipated throughout the recording.

Figure 7. Example of a 3DoF system ID result.
The Z-axis rotation is unforced and purely the result of the cross-coupling between the axes in the equations of motion. The IZZ component is also the largest element in the tensor for a typical aircraft. Figure 7 shows that the Z axis, denoted ψ in the figure, has very low information content due to these physical properties. Over the 20 seconds’ duration plotted, only a single oscillation occurs, compared to 12 oscillations in the Y axis.
This low information content in the Z axis has several implications for the experiment execution as well as for the processing of the data. During execution, it is important to choose starting attitudes which maximises the Z oscillations. This requires considerable trial and error, because these starting attitudes depend on the ratio between the inertias and the damping in the Z axis of the test article. They are, therefore, different for each body tested.
During processing, the system ID algorithm is essentially attempting to establish the frequency and damping of the motion of the pendulum. Attempting to do this with a single oscillation exceeding a period of 20 seconds will not be very accurate. This shows up in the uncertainties reported by the algorithm and is illustrated in Fig. 8. As shown, the uncertainties for the Z axis are an order of magnitude larger than for the X and Y axes. Naturally, this leads to a larger deviation between repeats, which in turn, requires more runs than the 1DoF pendulum to achieve similar accuracy. Another effect of the low frequency in the Z axis is that the time window chosen for the system ID can make a large difference in the results. This applies to the length of the window as well as to the location. For example, a 20-second window of a particular dataset can yield an estimate for Iz of 0.6 kg m2 or 0.56 kgm2, which equals a 7% difference, depending on the starting point. The same dataset returns an Iz estimate of 0.6 kg m2 or 0.62 kg m2 for a 20-second and a 30- second data window, respectively. This equals a 3% difference. Finally, some datasets with particular starting attitudes do not converge at all. The best results were obtained from starting attitudes that result in at least a full period of oscillation in the Z axis. Depending on the test article and its damping properties, this may not be possible at all and a careful selection of the data window is required. This is the case for the UAV under consideration, where the period of the Z oscillation can exceed 40 seconds.

Figure 8. Piper flight inertia test results with uncertainties of each test point for two data time windows.
To obtain a trustworthy result for Iz with the 3DoF method, it is therefore necessary to repeat the experiment often and use critical engineering judgement when interpreting and selecting the results. For this project, the final tests with the UAV were repeated 10 times. Each dataset was then processed with a 20- and 30-second window, and the final results were averaged. Obvious outliers with unrealistic parameter estimates were discarded in the process.
5.3 Verification
As the next step, it is necessary to investigate the magnitudes of corrections I mf required to extract the true inertial properties of the UAV. As mentioned above, the empirical formulas developed in Ref. 22 did not predict accurate values for I mf for the UAV. For example, using the method in Ref. 22, I mf for the X axis was calculated be 0.02 kg m2. The correct value, as determined experimentally, is 0.12 kg m2. This is a difference of 83%. The testing has also revealed that the corrections are not the same for the two swinging methods. It is therefore necessary to develop a two-step verification and calibration process to estimate I mf for the UAV.
The first step of verification is unique to this project. The UAV was tested extensively in the wind tunnel to determine its aerodynamic properties. This was done using conventional static tests as well as more involved dynamic tests, similar to Ref. 29. Some of the stability derivatives can be estimated from either static or dynamic tests and the results should be identical(Reference Carnduff and Cooke30). The dynamic test results contain the inertias of the UAV, while the static tests do not. The inertia estimates for the UAV could, therefore, be verified in a unique way by matching the wind-tunnel test results using the inertial properties from the swing tests and evaluating the differences.
To estimate the value of I mf experimentally, a known body was used as a benchmark. As shown in Fig. 9, this body initially was simply a flat plate model of the UAV. It was made from particle board with approximately uniform density and had similar weight and inertia properties as the UAV. The flat plate was modelled in a CAD package to determine its inertias with high accuracy.

Figure 9. Flat plate inertia simulator.
Based on the derivations of the correction methods in Refs 8 and 22, the corrections for the UAV were calculated from the flat plate tests by using the differences in the results to the CAD model. Preliminary testing, using the wind-tunnel data, showed that the flat plate corrections were too small. The corrections, however, were closer to the empirical values in Ref. 22. The experimentally determined correction for the flat plate model were 0.05 kg m2, versus 0.02 kg m2 from the calculations. Clearly, the flat plate model does not capture the full extent of the added mass quantity for the UAV. The reason for this must be the three-dimensional shape of the fuselage and vertical fin of the UAV, since the wings are essentially a thick flat plate (although streamlined). During swinging motion about the X axis, the flow is perpendicular to the fuselage walls, and there will be significant displacement of air. This might lead to a larger body of air being affected by the pendulum, and hence I mf will be increased.
The solution to the problem is shown in Fig. 10. A foam simulator of the UAV was constructed to have similar volume and surface area. It was then placed on the support frame and loaded up with aluminium bars to have similar inertial properties as the UAV. The arrangement is shown in Fig. 10(b). Figure 11 illustrates the CAD model for the simulator configuration used for the 3DoF case. Note the different location of the aluminium bars compared to the 1DoF case (Fig. 10). Because the 3DoF motion is more violent, the bars had to be secured to the frame more rigidly than in the 1DoF case, resulting in the given configuration.

Figure 10. Inertia simulator for the 1DoF case.
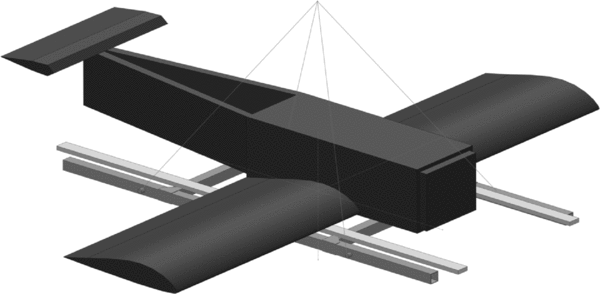
Figure 11. CAD model of the support frame with two reference bars and the foam plane simulator for the 3DoF case.
Since the foam density and dimensions, as well as the properties of the aluminium bars were known, the simulator could be modelled in the CAD package relatively accurately and its inertial properties determined this way. Given the geometric similarity of the simulator to the UAV, it is expected that the values for I mf obtained from testing this simulator will be fairly close to the corrections required for the UAV.
The mass m and the pendulum length l were measured with a precision of ± 1 g and ± 1 mm, respectively. To judge whether this accuracy is sufficient, a brief sensitivity study was performed using the 3DoF method. Firstly, a pendulum length change of 2mm during the system ID resulted in an error in the inertia estimate of 0.7% or less. Then a run was performed with the mass increased by 5g. This lead to errors of less than 0.5%. It is not expected to be able to estimate the size of the errors due to the aerodynamic effects with similar or better accuracy; therefore, the precision of the measurements of m and l was considered sufficient.
6.0 RESULTS
The first dataset presented and discussed in this section is for the flat plate, then for the foam UAV simulator, and finally for the UAV itself. All datasets include the support frame. All tables list the identified results for the respective inertias together with the uncertainty of the parameter estimate as reported by the output error algorithm for multiple runs. The mean and standard deviation of the results are calculated and compared to the CAD results. The differences are listed as an absolute value and as a percentage.
Because the support frame is different between the 1DoF and the 3DoF cases, the estimated inertias of the full pendulum cannot be directly compared between the methods. This is not a serious limitation, because corresponding CAD models were used to determine the corrections required.
6.1 Flat plate
The 1DoF results for the flat plate from Fig. 9 are presented in Table 1. The repeatability is excellent and the reported uncertainties are small over five runs in all axes. The comparison with the CAD results shows that the inertias of the flat plate are over predicted in all axes, as expected. This is caused by the added mass inertia I mf . Contrary to the corrections from Ref. 8, where the X axis required the largest correction by a factor of 2 or more, the flat plate here has the highest correction in the Y axis. The X axis correction is also more than twice as big as the result computed with the method from Ref. 22, as discussed earlier.
Table 1 1DoF inertia test results of the flat plate with support frame

The 3DoF inertia estimates for the flat plate are listed in Table 2. The flat plate is symmetrical about the xz and xy plane. Therefore, the product of inertia Ixz of the plate is zero, and the total Ixz of the plate on the frame is negligibly small. As a result, the system ID algorithm was unable to identify this parameter reliably because it is not sufficiently observable. Therefore, it was decided to remove the Ixz from the parameter vector and just identify Ix , Iy and Iz , while setting Ixz to zero. This also reduced the uncertainties of Iz .
Table 2 3DoF inertia test results for the flat plate with the support frame

Similarly to the 1DoF cases, the repeatability of the X and Y axes are very good, with small uncertainties. The Z axis, however, has uncertainties an order of magnitude larger than the two other axes. The estimates for Iz vary up to 10% between the runs.
Comparing the differences between 3DoF experimental results and the CAD data to the 1DoF case in Table 1, there are similar magnitudes of corrections for the X and Y axes. The Z axis, however, has a significantly smaller correction due to the added mass effect in the 3DoF case. This will be even more pronounced for the three-dimensional bodies tested next. For both cases, the corrections due to the added mass are too small to satisfy the verification test using the aerodynamic derivatives. Clearly, the flat plate model of the UAV is not a suitable simulator for the actual UAV, as expected.
6.2 Foam simulator
To estimate the magnitude of corrections required due to the added mass effect I mf the UAV foam simulator from Fig. 10 was tested next. The 1DoF results are listed in Table 3. Again, the repeatability is excellent with very small uncertainties, leading to high confidence in the results. Comparing the mean values for the estimated inertias to the CAD predictions shows significant deviations for all axes due to the aerodynamic effects. The additional inertias are 25% for the X axis, 18% for the Y axis and 15% for the Z axis, considerably more than for the flat plate and the full-scale airframe in Ref. 8. The IXZ term is too small to be estimated reliably and no attempt has been made to test for it in the 1DoF experiments.
Table 3 1DoF inertia test results of the foam simulator with support frame

The 3DoF test results are listed in Table 4. Each run was processed with a 20-second and 30-second data window, as discussed above. The results for the X and Y axis are perfectly repeatable, as for the flat plate, and they do not depend on the data window. The Z axis, again, shows more spread across the runs, and the results also vary depending on the data window.
Table 4 3DoF inertia test results for the foam simulator with the support frame (each run reported for 20 sec and 30 sec data)

Comparing the added-mass corrections between the two cases, significant differences can be seen between the two methods. The X and Y corrections of the 3DoF case are about half of the 1DoF experiment. The correction for the Z axis is even negative for the 3DoF case. Both corrections are, however, correct for their respective methods, as will be shown in the next section. It appears that the added mass corrections depend on the type of motion the pendulum performs. A possible explanation may be that the assumption of constant integral ζ, that is the volume of affected fluid in the derivation of the added mass in Section 4, is violated by the larger, more complex motion pattern of the 3DoF pendulum. More research with different bodies would be required to fully explain this phenomenon.
The foam simulator is geometrically similar to the UAV and was set up to have comparable inertial properties. Therefore, the deviations between the experimental data and the CAD results for the respective methods are expected to be valid to correct the experimental results for the unknown inertial properties of the UAV, as discussed next.
6.3 UAV
The 1DoF test results for the UAV are listed in Table 5. As before, the test results are fully repeatable over five runs and the reported uncertainties on the estimated inertias are very low. No test was performed for IXZ in the 1DoF case. The 3DoF tests were run 20 times to improve the accuracy of the Z axis. The individual results are plotted in Fig. 7 and a summary is listed in Table 6. The standard deviations for the 3DoF case are at least an order of magnitude larger than for the 1DoF case. The mean values were then corrected using the factors determined with the foam simulator for the respective method above.
Table 5 1DoF inertia test results of the UAV including the support frame

Table 6 3DoF inertia test results for each run including the support frame of the UAV

Table 7 lists the final results for the UAV’s inertial properties. The support frame contributions were removed using Equation (10). The agreement between the two methods is good, only the X axis shows a difference above 10%. Given the discussed issues with the 3DoF method and the added mass corrections, this is a good result. More research, however, should be done to improve the 3DoF method before it can be preferred over the 1DoF method for small fixed-wing UAVs. Once perfected, the 3DoF method will be easier and quicker than the traditional 1DoF method, because the UAV only needs to be swung in a single orientation to obtain the entire inertia tensor. For the current project, the 1DoF results were used for the subsequent flight dynamic analysis. Only the IXZ value was used from the 3DoF experiment. The final results also confirm that the added mass corrections are specific to the test article and the experiment used. For each test article, it will be necessary to construct a reference body of known inertial properties and determine the added mass corrections with the described methods. At this stage, no method exists to transfer the corrections between test articles. This will require a large database of different UAV shapes to be tested, similarly to the design data available for full scale aircraft(Reference Raymer31). This is beyond the scope of this project.
Table 7 UAV inertial properties final results in [kg m2]

Table 8 lists the results of the aerodynamic derivatives from the wind-tunnel tests. The static test data is used as the reference. It should be matched by the results from the dynamic tests, which include the inertial properties. The table shows that the obtained derivatives have large deviations when determined using the uncorrected inertial properties of the UAV. With the corrected data, the match to the static data is excellent. In the Z axis, the difference is higher than for the other two axes, which is most likely caused by a small remaining error in the added mass correction for that axis. To improve this result, one would need to use a simulator body for which inertial properties are more precisely known than it was the case for the foam simulator used here.
Table 8 UAV stability derivative benchmark using the 1DoF results

These results demonstrate that the devised test and correction methods are working correctly. The table also emphasises that without performing these corrections, the estimates for the inertial properties of the UAV will be in error by a significant amount.
7.0 CONCLUSION
Two methods have been tested and compared for the determination of the inertial properties of a small, fixed-wing UAV. The first method uses the standard 1DoF pendulum method. The second experiment implemented a novel and potentially easier 3DoF pendulum method, which yields the entire inertia tensor from a single swing test. Both methods used system identification of the pendulum motion to estimate the inertial properties of the UAV.
Substantial corrections due to the effect of added mass, caused by the acceleration of the pendulum immersed in the surrounding air, need to be applied to the results to obtain the correct values for the inertial properties of the UAV. It has been found that the methods presented in previous literature to determine the corrections for full-scale aircraft do not give the correct results for the small-scale UAV. At this stage, the only feasible method to generate these corrections are swing tests with a geometrically similar object of known inertial properties. It has also been found that the corrections are specific for the type of experiment and cannot be transferred between the 1DoF and 3DoF case. This has to be kept in mind when applying one of the methods.
Several benchmarking methods, including the innovative use of results obtained from static and dynamic wind-tunnel tests, have been utilised to prove the accuracy of the results obtained with both swinging methods. Very good agreement between the experiments and the reference data was achieved. Both methods agree well, but there is more research required before the 3DoF pendulum method can be used with equally high confidence to determine inertial properties of small, fixed-wing UAVs.


