


NOMENCLATURE
- a
cube side length m
- A
cross-sectional area m2
- CD, CL
coefficient of drag, lift
 $- C_{D} = {F_{D }}/\left(\frac{1}{2}{\rho AV}^{2}\right) C_{L} = F_{L}/\left(\frac{1}{2}\rho AV^{2}\right)$
- d
diameter m
- D
characteristic length m
- E
Young’s modulus N/m2
- f
frequency 1/s
- fcrit
critical rotational speed 1/s
- FD,FL
drag, lift force N
- g
gravitational constant m/s2
- I
moment of inertia kg m2
- kt
transverse stiffness N/m
- L
shaft length m
- P
point load N
- r
shaft radius m
- Re
Reynolds number − Re = ρ VD/μ
- V
flow velocity m/s
- u
equatorial speed m/s
- w
distributed load N/m
- α
spin parameter rad α = u/V = π Dω/V
- δ
deflection m
- ε
mean roughness height m
- μ
dynamic viscosity kg/m.s
- ρ
air density kg/m3
- ν
kinematic viscosity m2/s
- ω
rotational speed rad/s
- ωn
natural frequency of the combined system rad/s
- ωm
natural frequency of the point mass on a massless beam rad/s
- ωs
natural frequency of the shaft with a uniformly distributed load rad/s

1.0 INTRODUCTION
The ability to characterise the likelihood of runway debris impacting an aircraft during takeoff or landing is vital for aircraft designers and maintenance personnel alike. The damage caused by such impacts from runway stones, debris dropped from aircraft or airport vehicles needs to be avoided and this necessitates an accurate assessment of the impact threat(Reference Greenhalgh, Chichester, Mew, Slade and Bowen1). By doing so, more cost-effective and efficient runway maintenance schemes and impact tolerant aircraft structural designs can be realised. Observations of the dust plumes generated in the wake of both aircraft and road vehicles have shown that debris can reach heights of over several metres. Analyses of debris trajectories (Reference Beatty, Readdy, Gearhart and Duchatellier2) underneath commercial aircraft have suggested that lofting from the nose wheel tyre is of prime concern, as the corresponding trajectories are liable to cause impact on vulnerable areas of the aircraft. Debris greater than 10 mm in diameter could be projected by aircraft tyres along directions making angles of up to 60° with both the plane of the tyre or the horizontal ground plane (Reference Beatty, Readdy, Gearhart and Duchatellier2).
To date, most research into the runway debris impact threat has focused on the lofting mechanisms that occur through the interaction between the aircraft tyres and stones(Reference Nguyen, Greenhalgh, Olsson, Iannucci and Curtis3), with little research exploring the contribution from the aerodynamic forces acting on an irregular stone during its loft trajectory, or the importance of spinning. Analysis of the curvature of the trajectories of spinning objects(Reference Cross and Lindsey4) has revealed that these trajectories are considerably affected by the Magnus effect, although little is known about the Magnus effect for objects of irregular shape rotating at high speeds, such as lofted stones. The air flow around the vehicle(Reference Zhang, Toet and Zerihan5) is also an important factor affecting the debris trajectories. Numerical modelling has shown potential for predicting the trajectories of the lofted debris and constructing impact threat maps(Reference Nguyen, Greenhalgh, Graham, Francis and Olsson6). These maps were later validated for the case of a commercial aircraft using full-scale experiments. In the development of such maps, the magnitude of the Magnus effect was treated as a constant parameter; however, further research is needed to fully validate this methodology. The model predictions were critically dependant on the lift and drag coefficients assumed for runway debris; coefficients which can vary significantly depending on the exact shape of the debris(Reference Lin, Holmes and Letchford7); and the cross-sectional geometry presented to the surrounding flow field.
The present study aims to develop the techniques used to investigate aerodynamic lofting and provide the foundations for more comprehensive studies which characterise the aerodynamics of tumbling irregular bodies. Since every stone is different, it is important to find out whether it is possible to form generic models of stones and reduce the number of parameters needed to define an arbitrary stone without losing significant accuracy in simulating the aerodynamic characteristics. The aim is to deliver an improved capability for aircraft designers and airworthiness authorities to determine the probability of impact and requirements for impact tolerance. Incorporating the contribution from the characteristic aerodynamic forces into simulations that already capture the mechanics of debris lofting can help to achieve this goal.
1.1 Motivation
Reducing the occurrence of foreign object damage (FOD) on aircraft is vital to ensure safety and eliminate unsolicited costs required to address damage. Incidences such as the fan blade damage to an Aeroflot Airbus A330-300 during landing at Petropavlovsk-Kamchatsky airport(Reference Hradecky8) in April 2013 highlight the significance of FOD management. The following day, a post-flight inspection on another Airbus 330-300 revealed 111 dents to flaps and fuselage from the same runway. For the Mikoyan(Reference Tartar9) MiG-29, mud-flaps were required to be retrofitted to protect the MiG-29 engine from lofted debris, despite moving the nose gear back on the first four prototypes to reduce the debris intake. This was a four-year process that cost the Indian Air Force $300,000 in liabilities once their initial order was fulfilled.
1.2 Dimensionless groups and scaling
The most appropriate dimensionless groups(Reference Cross and Lindsey4) for the present study are CL, CD and Re as defined in the Nomenclature. Using these similarity parameters allows correct modelling of lofted debris by wind tunnel experimentation and easy comparison between sets of results for studies that employ different experimental methods. The most important similarity parameter is Re. As an example, a 15 g stone lofted by an aircraft travelling(Reference Greenhalgh, Chichester, Mew, Slade and Bowen1) at 50 m/s, with an average diameter of 25 mm, can be simulated in a tunnel with a model of average diameter 100 mm and flow speed of 12.5 m/s. Using the same scaling factor, an actual spin rate of 10,000 rpm may be modelled by spinning at a speed of 625 rpm in a wind tunnel.
1.3 Previous experimental methods
The rotating sphere(Reference Cross and Lindsey4) and cylinder have been the primary cases considered in previous literature relating to the aerodynamics of rotating bodies and their subsequent trajectories(Reference Aguirre-Lopez, Morales-Castillo, Diaz-Hernandez, Escalera Santos and Almaguer10). It is hoped that the initial stages of the present study will help to form a reliable basis to delve into greater irregularity in the shapes tested, an area that has not been investigated in the background literature. The earliest published work on a rotating spherical body entailed mounting a wooden sphere with a diameter of 152 mm on balance arms in a wind tunnel(Reference Maccoll11).
It was rotated at speeds of up to 1,800 rpm about an axis perpendicular to the oncoming flow, for five different Re between 3 × 10⁴ and 11 × 104. The wind speed was maintained constant by observing the pressure in the throat of a Venturi tube placed some distance ahead of the working section. Subsequent studies on rotating spheres have resized the support setup and spindle which accounted for 15% and 7.5% of the sphere diameter, respectively(Reference Maccoll11). Other experimental set-ups included using an air-gun with the ball mounted on a spinning tee in front of the muzzle(Reference Beasley and Camp12) and a wind tunnel in conjunction with a ball drop mechanism and high-speed digital imaging system(Reference Briggs13) so that there was no interference from a support assembly.
The lift and drag forces have been measured on spinning baseballs for three different orientations of the ball mounted on 6.3 mm diameter shafts(Reference Watts and Ferrer14). The lift and drag forces were measured via bending stresses in Plexiglas supports. Using hollow sphere halves was found to be favourable because the motor that produces the rotation can be located inside the sphere so that it is not in the airflow(Reference Kray, Franke and Frank15). This arrangement resulted in a small blockage ratio and therefore reduced interference. However, when the original solid sphere set-up was compared to the internal motor set-up, there was a reduction in coefficient values in the latter that needed to be accounted for and may not truly have represented the aerodynamic behaviour.
1.4 Magnus effect
Many sports balls which spin whilst travelling through the air, such as golf balls(Reference Jing, Tsubokura and Tsunoda16), base-balls(Reference Aguirre-Lopez, Morales-Castillo, Diaz-Hernandez, Escalera Santos and Almaguer10), cricket balls or footballs(Reference Passmore, Tuplin and Stawski17), present the ‘curveball’ phenomenon; a bending of the ball’s flight path. The relative velocity of the ball’s surface with respect to the flow causes an acceleration of separation on the side of the ball moving upstream. For example, a sphere rotating in an anticlockwise direction about an axis perpendicular to a flow moving from right to left will experience an upwards force Fig. 1(a) because the boundary layer separation is delayed on the upper surface and occurs earlier on the lower surface. The magnitude of the Magnus force(Reference Maruyama18) is mainly a function of the rate of spin(Reference Dobson, Ooi and Poon19), the flight velocity and the geometry of the body, with secondary effects arising from sideslip angle and surface roughness(Reference Seifert20).

Figure 1. Magnus force for (a) a rough sphere at high spin speeds, (b) a smooth sphere at low spin speeds (Reference Kim, Choi, Park and Yoo25).
Rotating cylinders(Reference Zheng, Lei and Wu21) have been thoroughly investigated, with the results often applied to methods of obtaining lift through the Magnus effect. For example, Flettner rotor ships used rotating cylinders in place of sails. The spanwise-varying boundary layer separation patterns present on the surface of a rotating cylinder sets it apart from the Magnus effect that a sphere experiences. The circulation around the rotating cylinder is a “consequence of the unsymmetrical flow pattern produced by the upper and lower boundary layers separating at different positions. The circulation is then a consequence of the flow pattern as determined by the boundary layer behaviour”(Reference Swanson22). Large fluctuations in the position of the separation points are inherently random due to the varying pressure distributions in their neighbourhood. Therefore, the magnitude and direction of the lift and drag forces that the cylinder experiences are expected to undergo fluctuations.
1.5 Negative Magnus force
A negative Magnus effect was first observed in experiments on rotating cylinders (Reference Lafay23) and this was followed by reports of a negative Magnus force acting on rotating spheres. The negative lift force acting at low rotational speeds in Fig. 1(b) for a certain range of Re was supported by similar observations (Reference Taneda24). The studies agreed that the force changed direction at an equatorial velocity to flow velocity ratio (α) range of 0.4 < α < 0.6. In another study (Reference Kim, Choi, Park and Yoo25), a negative lift was reported at low wind speeds, with the shift from negative to positive occurring at 0.1 < α < 0.5. This negative Magnus force was attributed to the different locations of the laminar-to-turbulent transition points on both sides of the body, and the separation points Fig. 1(b) (Reference Kim, Choi, Park and Yoo25).
The positive Magnus force acts due to the delay of separation caused by the difference in relative velocity of the sphere surface with respect to the flow, as discussed earlier. However, the transition region introduces shifts in the separation point downstream along the sphere surface as it is associated with a turbulent boundary layer, which contains enough momentum to delay the formation of an adverse pressure gradient, thus inhibiting separation. It is important to note that the negative Magnus force occurs close to the critical Re, i.e., the point at which the boundary layer becomes turbulent. Regarding the negative Magnus force on a foot-ball(Reference Kray, Franke and Frank15), the minimum CL was = —0.4 for Re = 43.2 × 10⁴, and a flow with Re = 15.1 × 10⁴ displayed a minimum CL of-0.35. No negative force was observed for Re = 6.8 × 10⁴. Thus, the transitional region was for 6.8 × 10⁴ < Re < 15.1 × 10⁴.
1.6 Spin parameter and Reynolds number
The smooth sphere data(Reference Cross and Lindsey4) has indicated that CL is primarily dependent on the spin parameter (the ratio of equatorial speed to flow speed): α = u/V = πDω/V. It has been suggested that lift is a linear function(Reference Briggs13) of V2ω. This would mean, from the Kutta-Joukowski theorem, that lift is also a linear function of the product of Re and α. However, Watts and Ferrer(Reference Watts and Ferrer14) have demonstrated that a conflict arose, by comparing the sets of published data(Reference Maccoll11,Reference Briggs13) . The dependence of the lift coefficient on Re (or equivalently flow velocity) for a fixed spin rate was weaker in recent studies as compared to that in older studies. For 6.8 × 10⁴ < Re < 15.1 × 10⁴, CL was seen to converge(Reference Kray, Franke and Frank15) at around 0.5. There has been some agreement that lift has very little or no dependency (Reference Swanson22) on Re. However, certain results have shown a strong linear dependence (Reference Briggs13) of lift on Re. Other research has conveyed slight increases in lift magnitude (Reference Maccoll11) for increasing Re, particularly at low spin. Overall, no definite conclusion could be made on the effect of Re over all the spin rates investigated. It should be noted that the expression of the lift coefficient has changed since Maccoll’s(Reference Maccoll11) study was carried out and these values have been multiplied by 8/π to compare with current values.
1.7 Cylinder aspect ratio, surface roughness and wet conditions
Larger aspect ratios of cylinders (Reference Seifert20) produced greater maximum lift values and corresponding velocity ratios. Modelling of a small stone with an aspect ratio of about 1.2 to 1.4 – the most common range in a sample of granite stones (Reference Greenhalgh, Chichester, Mew, Slade and Bowen1) – is subject to end effects including leakage flow and pressure equalisation around the ends, often investigated in cylinders (Reference Lafay23). The main conclusion that the literature offered was that higher lift and drag forces could be attained with increasing aspect ratio, primarily in the context of cylinders.
An increase in surface roughness(Reference Marzuki, Mohd Rafie, Romli and Ahmad26) was found to decrease the critical Re, leading to a delay in separation. Smooth non-rotating spheres usually have a higher drag associated with them compared to that of roughened spheres because the early separation brought on by the laminar boundary layer forms a wake region much larger than that of a turbulent boundary layer. The importance of surface roughness was demonstrated by spinning a golf ball with dimples on it, which experienced positive lift only (Reference Swanson22). This observation is contrary to what was observed on the smooth ball at the same Re, due to disturbances by friction and turbulence. A relationship between the surface roughness and lift has not been explored in depth in the literature, although the roughness of a sphere has been expressed as a ratio of mean roughness height to the sphere diameter, ε/D. The lift coefficient has been expressed as a function of the spin parameter, Re and roughness(Reference Marzuki, Mohd Rafie, Romli and Ahmad26), CL = f(α, Re, ε/D).
Studies have investigated the effect of heavy rain on the aerodynamic characteristics of aerofoils and similar considerations could be useful in the case of runway debris. Following the application of simulated heavy rain, a lift reduction was determined both numerically and experimentally to be 13.2% and 13.7%, respectively(Reference Wu, Cao and Ismail27), with corresponding drag increases of 47.6% and 56.3%. If such data were to be applicable for a smooth surface, regardless of the object’s geometry or orientation, it may be possible to provide an indication of how the aerodynamics of a smooth rotating body behaves in wet conditions. If so, this would imply that rain could significantly affect the trajectories of lofted runway debris, as well as the physics of the initial launching process.
1.8 Summary
Rotating bodies in a flow can be subject to a Magnus force (either positive or negative) which is primarily dependant on the rate of spin of the object and the flow speed, defined via the spin parameter. Previous studies have found varying effects on rotating smooth and rough spheres of varying Re, surface roughness and spin direction, all of which have been investigated in this study as well as spin orientation. This study has explored these factors for a sphere, a cylinder and other bodies representative of runway stones to characterise and understand their aerodynamic properties.
2.0 METHOD
2.1 Initial set-up
An experimental set-up was designed and developed to allow objects of various shapes to be spun by a 15 V variable speed motor in a wind tunnel such that the Magnus force on the object could be measured (Fig. 2). Sealed bearings constrained a shaft supporting the object to rotate about only about the x-axis and support struts prevented displacement of the shaft in any direction. To improve the vertical symmetry of the initial set-up, a dummy motor assembly was installed, as shown on the right-hand side of Fig. 3.

Figure 2. Schematic of the initial experimental set-up.

Figure 3. Initial experimental set-up with upper fairings only and dummy motor assembly supporting a 100 mm diameter sphere.
A three-component overhead mechanical force balance was used to measure the lift forces. Two struts held the model to the lift frame, which was suspended from the drag frame: the support being through a linkage of lift levers. This enabled the lift force to be measured by a weighbeam mounted on the drag frame. This drag frame and consequently the whole balance was suspended from four pillars on an earth frame by a Watts linkage to ensure that the small movements of the drag frame were indeed horizontal and could not be produced by a vertical force. The maximum loads measurable by the balance were 1,112 N for lift and 222 N for drag with minimum recordable values of 44 mN and 4.4 mN, respectively. Each test was repeated three times and the steps taken were: set Re and record the temperature, pressure, velocity, lift and drag for one spin direction; increase Re and record for the same spin direction; advance to the highest Re and record for the same spin direction; reverse the spin direction (remaining at the highest Re) and record; decrease to the middle Re for this spin direction.
A low-pressure microprocessor micromanometer (Furness FCO510) was used to observe the flow velocity and record the pressure and temperature, from which the air density and dynamic pressure was calculated. With these quantities, the flow in the tunnel was maintained around the desired Re. A laser tachometer recorded angular velocities using a reflective sticker on the model. The tachometer recorded the highest, lowest and most recent values and from this an average uncertainty of 10 rpm was observed. Motor voltages of up to 13 V were used and the corresponding spin rate at 13 V was just over 1,500 rpm, which represented a 28 mm diameter object spinning at 20,000 rpm. This was the upper limit of spin speed found from modified drop weight experiments to simulate stone lofting in previous studies(Reference Nguyen, Greenhalgh, Olsson, Iannucci and Curtis3). Therefore, the range used for testing was considered applicable to the typical conditions encountered by lofted runway debris.
Scaled models of various shapes were made as hollow shells from ABS plastic using a Stratasys Dimension BT 3D printer, followed by sanding and spraying with paint to produce a smooth surface. ‘Smooth’ and ‘rough’ are not used to describe the properties of the overall shape, but only of the surface. ‘Smooth’ means without sandpaper, whilst ‘rough’ means the model had sandpaper attached. Each model was designed such that the characteristic length was 100 mm. The terms ‘rolling’ and ‘tumbling’ are used for shapes, such as an ellipsoid, which are longer in one direction than in a perpendicular direction. ‘Rolling’ is used when the axis of rotation is aligned with the longest axis of the rotating body. ‘Tumbling’ is used to describe rotation about an axis aligned with the shortest axis of the body. Using this definition, if an ellipsoid was rolling along a flat, horizontal ground surface, its centre of mass would stay at the same height above ground. If the ellipsoid was tumbling, its centre of mass would vary in height above ground. The geometries used were a smooth sphere (Fig. 4), smooth and rough cylinders (Fig. 5), a rough cube, a rough diamond and smooth and rough ellipsoids, both rolling and tumbling.

Figure 4. Symmetric vertical fairing set-up supporting a 100 mm diameter sphere.

Figure 5. Models and shafts used in the wind tunnel to represent spinning objects.
2.2 Vertical fairings
One problem with the initial experimental set-up was that the struts supporting the assembly were very much exposed to the oncoming flow and thus presented disturbances and onset of turbulence in the flow around the model. The black fairings (Fig. 3) did not cover the struts the entire way down. To overcome this lack of symmetry, similar-sized fairings were screwed into the tunnel floor with the leading edges of the bottom fairings aligned with the top (Fig. 4).
Cardboard fairings were then introduced such that no part of the support system around the model was exposed to the flow. This was achieved by cutting slots in the card to accommodate the shaft and motor assemblies and bending the card into a symmetrical aerofoil shape. The positions where the cardboard fairings were taped onto the upper metal fairings were chosen such that the cross-sectional area at the joint matched that where the card met the bottom fairings, as fairings of constant cross-section the entire way down were desirable to improve the symmetry. For structural integrity, thick cardboard sections were first shaped and attached inside, and thinner, identically shaped cardboard was attached over these. The thin cardboard was smoother when bent into shape and promoted laminar flow. Cardboard was a suitable choice for this task because it provided flexibility in positioning. In such a case, the card could more easily be cut or bent compared to a more rigid structure such as ABS plastic, but the drawback was a greater susceptibility to deformation in the flow. However, easy movement of the structure was also beneficial for removing and inserting models without the need for disassembly.
2.3 Optimal shaft geometry
2.3.1 Shaft whirling
The requirement for a longer shaft length to reduce the effect of blockage from the fairings and improve the smoothness of the flow acting on the model demands a thicker shaft. This is because shaft whirling will occur at a critical angular speed for a certain shaft length and radius. Whirling is a phenomenon that occurs due to mass imbalance, gyroscopic forces or hysteresis damping in the shaft(Reference Dukkipati and Srinivas28). In the present study, if whirling were to occur, it would most likely be due to the deflection of the shaft resulting from the weight of the attached model and external wind forces during rotation. The deflection of the shaft with a uniformly distributed load is given (29) by Equation (1) and the deflection of the shaft with a point load P for x < a and the deflection for x > a (Fig. 6) is given by Equations (2) and (3), respectively.
 \begin{equation}
\delta =wx^{{\rm 2}}{\left(L-x\right)}^{{\rm 2}}{\rm /(24}EI{\rm )}\end{equation}
\begin{equation}
\delta =wx^{{\rm 2}}{\left(L-x\right)}^{{\rm 2}}{\rm /(24}EI{\rm )}\end{equation}
 \begin{equation}
{\delta }_{x \lt a}=-P\left[\left({\rm 3}ab^{{\rm 2}}x^{{\rm 2}}{\rm /}L^{{\rm 2}}\right){-b^{{\rm 2}}x^{{\rm 3}}\left(L{\rm +2}a\right)}^{{\rm 2}}{\rm /}L^{{\rm 3}}\right]{\rm /(6}EI{\rm )}\end{equation}
\begin{equation}
{\delta }_{x \lt a}=-P\left[\left({\rm 3}ab^{{\rm 2}}x^{{\rm 2}}{\rm /}L^{{\rm 2}}\right){-b^{{\rm 2}}x^{{\rm 3}}\left(L{\rm +2}a\right)}^{{\rm 2}}{\rm /}L^{{\rm 3}}\right]{\rm /(6}EI{\rm )}\end{equation}
 \begin{equation}
{\delta }_{x>a}=-P\left[\left({\rm 3}ab^{{\rm 2}}x^{{\rm 2}}{\rm /}L^{{\rm 2}}\right){-b^{{\rm 2}}x^{{\rm 3}}(L{\rm +2}a)}^{{\rm 2}}{\rm /}L^{{\rm 3}}+{{\rm (}x-a{\rm )}}^{{\rm 3}}\right]{\rm /(6}EI{\rm )}\end{equation}
\begin{equation}
{\delta }_{x>a}=-P\left[\left({\rm 3}ab^{{\rm 2}}x^{{\rm 2}}{\rm /}L^{{\rm 2}}\right){-b^{{\rm 2}}x^{{\rm 3}}(L{\rm +2}a)}^{{\rm 2}}{\rm /}L^{{\rm 3}}+{{\rm (}x-a{\rm )}}^{{\rm 3}}\right]{\rm /(6}EI{\rm )}\end{equation}

Figure 6. Load cases to determine deflection and shaft whirling speed: (a) uniformly distributed load along shaft, (b) point force representing each aerodynamic force acting on the model(Reference Dukkipati and Srinivas28).
A Matlab program calculated these forces based on the model and shaft masses, and wind speed as inputs, and then plotted the static deflections of the shaft and model. The critical rotational speed was then determined using the Rayleigh-Ritz formula Equation (4) and is based on the maximum static deflection and natural frequency, which is obtained using Dunkerley’s method of superposition(Reference Krüger30) Equation (5). Pythagoras’ theorem was applied to obtain the maximum possible static deflection, which was inserted into Equation (4).
 \begin{equation}f_{crit}=\surd {\rm (}g{\rm /}{\delta }_{max}{\rm )/(2}\pi {\rm )}\end{equation}
 \begin{equation}{{\rm 1/}\omega }^{{\rm 2}}_n={{\rm 1/}\omega }^{{\rm 2}}_m+{{\rm 1/}\omega }^{{\rm 2}}_s\end{equation}
Table 1a shows the results for critical frequency (or spin speed) and critical whirling speed for variations in length of a shaft with diameter 5 mm, for flow speed of 23.0 m/s.
The wind speed was set such that the maximum operating wind speed of 17.5 m/s was 75% of this value. The shaft-model mass was the other input; this was initially 0.19 kg for a 300 mm shaft. For each 50 mm increase in length, the shaft-model mass increased by 0.01 kg. The maximum deflections and critical frequency posed no threat, being well below and above operable values, respectively, but the critical whirling speed was too low for lengths above 300 mm, based on a maximum safe value of 75% of the critical speed.
2.3.2 Transverse stiffness
Considering the conditions to be reliable with regard to shaft behaviour (no whirling or vibrational issues were recorded), it provided a target value of transverse stiffness for a longer shaft. This value was calculated(Reference Krüger30) as kt = 3πEr 4/4L 3 for the shaft diameter of 5 mm and length 300 mm. Silver steel shafts were available in diameters of 5 mm, 6 mm and 8 mm from RS Components (RS stock numbers 682-056, 682-062 and 682-078, respectively). A larger shaft diameter, e.g., 10 mm, would have been 10% of the sphere diameter of 100 mm, and was anticipated to have interfered with the flow excessively. The spin directions relative to the flow direction are shown in Fig. 7 and Fig. 8 displays the required shaft length for a diameter of 5 mm up to 8 mm.

Figure 7. Transverse stiffness as a function of shaft length between the supports for various shaft diameters.

Figure 8. Definition of spin directions.
A shaft diameter of 6 mm required the length to be around 380 mm to achieve the target transverse stiffness of 716 N/m, so this new thickness and span were chosen. An equal shaft length of 380 mm but with a diameter of 5 mm was also machined to investigate the effect of a 1 mm reduction in diameter. The motor was then operated and observations on the motion recorded using an out-of-tunnel set-up. It was found that the minute deflections existing with the 300 mm shaft had amplified into more noticeable vibrations with the 80 mm length increase. This was because the transverse stiffness had reduced accordingly, to roughly 50% (Fig. 8). Applying the new geometry in the code also revealed preferable quantities for the 6 mm shaft than for the 5 mm shaft as shown in Table 1b.
Table 1 (a) Salient quantities for varying shaft length between the supports, based on a silver steel shaft of 5 mm diameter. (b) Differences between shaft diameters for a length of 380 mm.

An operating value of 75% of the critical whirling speed was the safety margin(Reference Krüger30) used in practice. For the 5 mm shaft case, this fell just below the maximum spin rate. The 6 mm shaft case had a critical speed well above the maximum operating speed. It could be concluded that a 5 mm shaft was unsuitable for lengths over 350 mm, based on an operating spin value of 75% of the critical whirling speed (Table 1). The analyses carried out as discussed in Section 2.3 eliminated pin shearing, stress concentrations at the hole and cracking as potential failure modes; sufficient safety margins were found between the critical values and material properties.
2.4 Reynolds number range
The ability to make comparisons to previous studies and applicability to real-life debris modelling was the main influence in the choice of Reynolds numbers investigated. The maximum wind speed of the tunnel was 37 m/s, which approximately corresponded to Re = 30 × 104 for a 100 mm diameter sphere. The average characteristic size from a sample of granite stones was 20–25 mm, matching earlier studies(Reference Beatty, Readdy, Gearhart and Duchatellier2); hence, this was taken as the focal debris size. Such debris diameters could be characterised by a 100 mm wind tunnel model for Re chosen to be comparable to that in previous literature(Reference Maccoll11,Reference Kray, Franke and Frank15) : Re = 5 × 10⁴, 8 × 10⁴ and 11 × 104. These values corresponded to tunnel speeds of 7.5, 12.5 and 17.5 m/s, which scaled to takeoff speeds of 30, 50 and 70 m/s, respectively, an appropriate range for most commercial and military aircraft(Reference Greenhalgh, Chichester, Mew, Slade and Bowen1).
2.5 Sources of error
2.5.1 Wind tunnel blockage
The ratio of the frontal areas of the support system and the model to the tunnel’s cross-sectional area represented the tunnel blockage ratio, which was estimated to be 12–15%. The magnitudes of drag and the critical Re region are the parameters that suffer an increase with increasing blockage ratio(Reference Achenbach31). Since the results from the present study had only a slightly lower critical Re than that in most of the literature, it was thought that blockage did not play a major role.
2.5.2 Motor interference
The active and dummy motors were both immersed in the flow as in Fig. 9(a). By taking tare readings on the set-up prior to experimentation, the effect of these were eliminated, but the contributions to the flow interruption would have been made due to the nature of their geometry which may have affected the measured lift characteristics, particularly at low spin rates corresponding to small values of lift. The effect of one motor has been quantified using Fig. 9(a) by gauging the height of the downstream wake as a percentage of the tunnel height (1.37 m), using wool tufts aligned on the outer wall of the fairings. The experimental set-up could be improved by shielding the motors from the flow by applying fairings or arranging to have the motors outside of the tunnel completely.

Figure 9. Wake regions produced by (a) active and dummy motor and (b) shaft.
2.5.3 Shaft interference
Fig. 9(b) illustrates the effect of the shaft using a line of wool tufts positioned on the inner wall of the fairing and describes the resultant wake height as a ratio of the tunnel height. This effect could have been limited by including the length of shaft exposed to oncoming flow in the tare readings or predicting the influence on the overall aerodynamic force produced by modelling the shaft as a cylinder. Improved tare force readings could include the portion of shaft exposed to the flow, based on a rotating cylinder model.
2.5.4 Tape adhesion
While the tunnel was operating, the internal temperature gradually increased. The duct tape used to connect the card fairings to the assembly lost tackiness due to the increased temperature, especially when left overnight. Tape replacement was essential because leakage would occur if gaps were left on the tunnel walls and fragment scatter had to be prevented at all costs to avoid damage. This was sometimes required during testing, but intermittent disturbances were undesirable during wind tunnel experimentation, because opening the tunnel may have caused fluctuations in the temperature and pressure, and having to restart the fan was detrimental to the flow steadiness.
2.5.5 Dummy motor
Initially, there was a lack of symmetry between the two spin directions for the sphere using the initial experimental design. To resolve this issue, the symmetry of the set-up was improved by the dummy motor and vertical fairings. During testing of the cylinder and certain sphere tests, the MDF platform on which the dummy motor was attached vibrated strongly when the voltage reached 8 V, corresponding to 940 and 905 rpm for the sphere and the cylinder, respectively. The assembly in its entirety contained the active motor, support struts, force balance and dummy motor. It was postulated that the rotations at this speed caused a frequency of vibration close to the natural frequency of the MDF/stainless steel bracket, where the rotational energy at the bearing-strut interface was translated into lateral deflections in the dummy motor assembly.
2.6 Error quantification
2.6.1 Temperature variation
The temperature inside the tunnel gradually increased by a rate of about 5°C every 10 mins. Apart from this steady rise, no significant temperature fluctuations occurred. The temperature and pressure were recorded with each force reading, so any changes were incorporated into the measured coefficient value.
2.6.2 Velocity fluctuations
After being switched on, the wind tunnel was left for some time to allow the flow to stabilise such that the experiments could be carried out with the flow having reached a steady state. There was, however, a random variation in wind speed displayed by the micromanometer averaging δV = ± 0.5 m/s. The wind speed was also recorded with each force reading to account for any significant changes, but the value tended to fluctuate constantly.
2.6.3 Tachometer readings
Before each tunnel test, the models were rotated at each voltage and the corresponding spin rate measured using a basic laser tachometer which produced values that had a variation of about 10 rpm. The tachometer expressed three values: a minimum, a maximum and the most recent. The most recent value was recorded in most cases. This variation in spin rate measurement has been incorporated into the uncertainty quantification as it ultimately influenced the equatorial speed of the model and thus the spin parameter.
2.6.4 Force resolution
The resolution of the force balance stated in Section 2.1 pointed to uncertainties of ± 22 mN and ± 2.2 mN for lift and drag, respectively. Between tests, the drag value did not vary considerably – about 1.78 N at a maximum, where the resolution is 4.44 mN. The biggest variations in lift occurred for the sphere with the initial set-up, the cylinder at low spin speeds and the smooth tumbling ellipsoid at low spin rates (particularly for low Re).
2.6.5 Uncertainty quantification
Based on the discussion above, the uncertainties were quantified as: δV = ± 0.5 m/s, δω = ± 0.167 Hz, δu = ± 52 mm/s, δFL = ± 22 mN, δFD = ± 2.2 mN. Uncertainty quantification for the dependent variables has been achieved based on the uncertainties of the related independent variables (Reference Coleman and Steele32). For example, CL had an uncertainty based on U and FL (the other quantities in the expression for CL were constants). The following equations summarise the uncertainties for the relevant dependent parameters based on the individual uncertainties in the experimental measurements.
 \begin{equation}
\mathrm{For\ the\ spin\ parameter~:~}\delta\alpha=\alpha \surd \left[\left(\delta u/u\right)^2 + \left(\delta V /V\right)^2\right]\end{equation}
\begin{equation}
\mathrm{For\ the\ spin\ parameter~:~}\delta\alpha=\alpha \surd \left[\left(\delta u/u\right)^2 + \left(\delta V /V\right)^2\right]\end{equation}
 \begin{equation}
\mathrm{For\ the\ lift\ and\ drag\ coefficients~:~}\delta C = C \surd \left[\left(\delta F / F\right)^2 + \left(2\delta V /V\right)^2\right]
\end{equation}
\begin{equation}
\mathrm{For\ the\ lift\ and\ drag\ coefficients~:~}\delta C = C \surd \left[\left(\delta F / F\right)^2 + \left(2\delta V /V\right)^2\right]
\end{equation}
Plots with error bars are included for the sphere in Fig. 13. At low Re, the error tended to be greater for both the coefficient value and α because δ V/V was greater. The error measuring the cross-sectional area was assumed to be negligible compared to the other parameters. The error bars showed a reduction in relative error as Re increased, because low wind speeds produced small lift forces that were difficult to measure accurately.
3.0 Results and Discussion
This section begins by presenting the results used to develop and validate the test set-up, followed by the results and discussion of the wind tunnel tests in the form of plots showing the CL and CD for five different model geometries. The subsequent results show the effects of surface roughness and spin orientation on the aerodynamic characteristics.
Before embarking on this study, one hypothesis was that the irregular shape and rough surface of real runway stones, which are made to spin in a flow, might enhance the Magnus effect and drag on the stones compared to idealised spherical objects (Fig. 1). Without prior evidence to support this, a proposed mechanism was that spinning stones would effectively cause more air to be dragged around its surface by being rough and irregular. The sharp corners of angular stones were thought to amplify this effect and increase both the lift and drag values. A discussion of the results gleaned from the wind tunnel tests on the five different shapes are presented in this section, along with discussion of the additional influences of the spin parameter, Re, surface roughness and orientation on the lift and drag.
3.1 Experiment validation
The preliminary results for the smooth sphere corroborated the experimental design and test methodology. Regarding the preliminary results for CL of the sphere with the 6 mm shaft (Fig. 10), the trend was similar to that of Kray (Reference Kray, Franke and Frank15) for α < 0.85. However, for α > 0.85, the present study values were much lower than those of Kray(Reference Kray, Franke and Frank15).

Figure 10. Coefficient of lift for a sphere for low Re (stated in the legend) compared with Kray et al. (Reference Kray, Franke and Frank15)
To monitor the effect of the set-up conditions, smooth sphere tests were run with each alteration of the experimental rig (Fig. 11) and the effect of the sphere’s orientation was also investigated. The dashed black lines in Fig. 12 show that the sphere’s orientation had no notable effect on the results. Compared with the 5 mm shaft, using the longer 6 mm shaft produced more stable results as the spin rate increased, along with a shift in the CL magnitudes. An improvement was made with the cardboard fairings in that the behaviour and magnitudes had greater agreement with recent literature. The addition of the dummy motor in the 5 mm shaft case improved the symmetry but there was still a degree of disparity in the results. However, there was an improvement when the shaft length and diameter increased. Overall, the agreement between the plots for α < 0.85 endorsed the set-up with the 6 mm shaft. The final configuration used for subsequent results was the set-up with the 6 mm shaft, dummy motor and symmetric connected fairings Fig. 11(f). A comparison of the plots at all Re tested (Fig. 13) using the final configuration showed that the aerodynamic characteristics matched fairly closely for both spin directions, and at higher Re, the lift changed from positive to negative at similar values of α. However, there remained some discrepancy in the coefficient magnitude for some rotation speeds due to fluctuations in flow velocity, interference and blockage effects, which are discussed in Section 4.6.
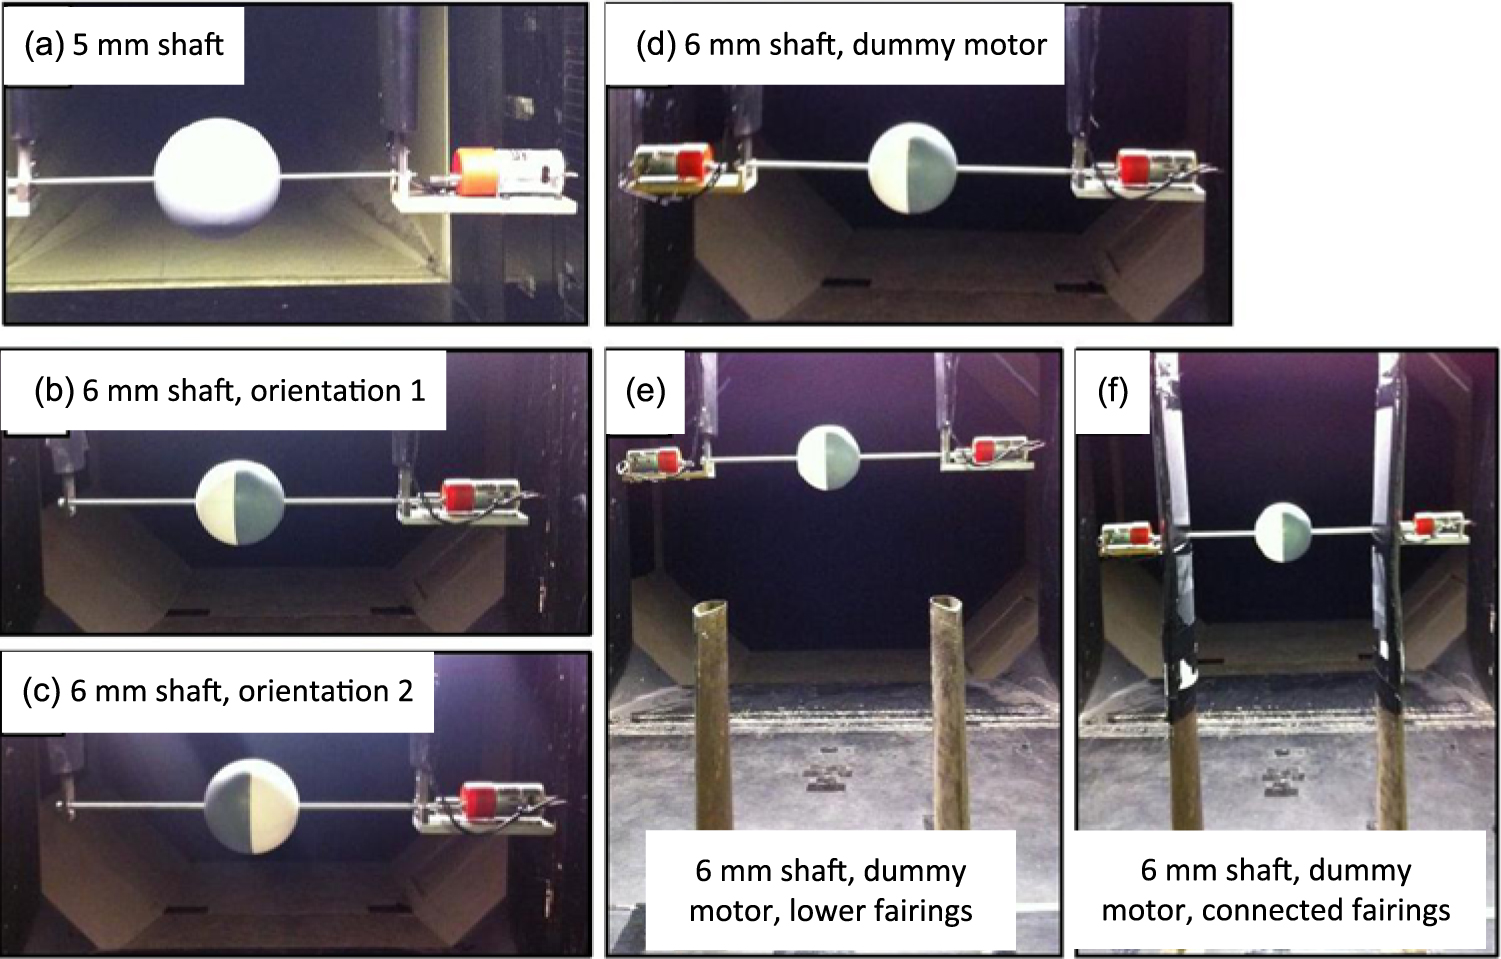
Figure 11. Setup development stages for the 100 mm diameter sphere.

Figure 12. Coefficient of lift for a sphere at Re = 8 × 10⁴ for various experimental stages from initial to final set-up.

Figure 13. Coefficient of lift for a sphere as a function of spin rate for both directions at various Re. To aid comparison, the dashed lines show the data for direction 2 with the lift direction reversed in sign.
3.2 Lift characteristics of a sphere
There was an approximately linear relationship between CL and α for the sphere at Re = 5 × 10⁴ up to approximately α = 0.5, due to pressure distribution changes about its surface and the Magnus force. This force was caused by the increasing suction on the side rotating in the streamwise direction (the upper surface for direction 1 as shown in Fig. 13) and a pressure buildup near the lower surface. The sudden drop at α = 0.5 may have been explained by the movement of the separation point on the lower surface such that the boundary layer stayed attached for longer, resulting in a pressure drop towards the front of the model.
At Re = 8 × 10⁴ and Re = 11 × 104, a negative Magnus force was recorded on the sphere (Fig. 13) and the CL converged to a value of around −0.3. This meant that above a certain Re, lift was no longer a function of the spin parameter and the turning point was attributed to movement of the separation point. This was a result of a turbulent boundary layer on the lower surface causing the flow to stay attached for longer and the laminar character of the boundary layer on the upper surface forcing an earlier separation, higher pressure, and thus a downwards force. Applying an increasing spin resulted in sudden turbulent boundary layer separation on the upper surface manifesting as a jump in the sphere plots, where zero lift occurs at α = 0.48 and α = 0.31 for Re = 8 × 10⁴ and 11 × 104, respectively. This jump is caused by surface roughness.
The sphere results corresponded to the set-up with a 6 mm shaft (unless otherwise stated) which were more consistent than those with the 5 mm shaft. The sphere experienced a negative Magnus force for the two higher Re. The sphere’s converging Magnus force as seen in Fig. 13 around a value of CL = 0.3 suggested that lift was no longer a function of spin parameter. This value agreed with Briggs(Reference Briggs13) (however, older studies all had conflicting coefficients) but one variation between Kray(Reference Kray, Franke and Frank15) and the present study was that the onset of the negative Magnus force occurred at a higher Re. One possible explanation for this was that in the present study, the sphere mounted on the 6 mm diameter shaft had one-half painted and one-half sanded ABS, because of the tests to investigate symmetry, which could have contributed to erratic separation patterns. The separation lines on a spinning object immersed in a flow for a long time could gradually shift downstream on the streamwise-moving surface.
3.3 Lift characteristics of non-spherical geometries
Lift coefficients for the non-spherical test objects spinning in direction 1 are presented as a function of spin parameter in Figs. 14 to 16 at Re = 5 × 10⁴, 8 × 10⁴ and 11 × 104, corresponding to wind speeds of 7.5, 12.5 and 17.5 m/s, respectively. For clarity, error bars have not been included in these plots, since the errors were similar to those shown for the sphere, based on the uncertainty values and calculations made in the error analysis in Section 2.6. For all non-spherical shapes, only positive lift was observed. The cylinder had similar CL characteristics at all three Re with a maximum CL of 0.74 at α = 1.1 and Re = 5 × 10⁴ and a similar value of CL at α = 0.66 for Re = 8 × 10⁴. Interestingly, for Re = 5 × 10⁴, the diamond’s lift characteristics followed a similar trend to that of the sphere (Fig. 10 and dashed line in Fig. 13): both had a maximum lift for 0.5 < α < 0.6 and lift decreased after this point. Across all Re, the smooth tumbling ellipsoid CL did not appear to be a function of α (Figs. 14 to 16), but a linear relationship between CL and α was present for the rolling ellipsoid.

Figure 14. Lift as a function of spin parameter for each model at Re = 5 × 10⁴.

Figure 15. Lift as a function of spin parameter for each model at Re = 8 × 10⁴.

Figure 16. Lift as a function of spin parameter for each model at Re = 11 × 104.
Differing degrees of roughness between the glass particles on the cube surface and the sandpaper on the cylinder surface may have produced some discrepancy between the recorded values, but in all cases, the cube and cylinder plots (Fig. 17) followed similar patterns for α > 0.3. These comparable trends in the lift characteristics for the rough cube and rough cylinder led to the hypothesis that a rapidly spinning irregular object (i.e., a runway stone) could behave aerodynamically like a regular shaped spinning object, e.g., a cylinder. There did not seem to be a clear relationship between lift and Re, although there was close agreement between all cube models, which experienced lift forces that were higher than the corresponding values in the three plots for the cylinder.
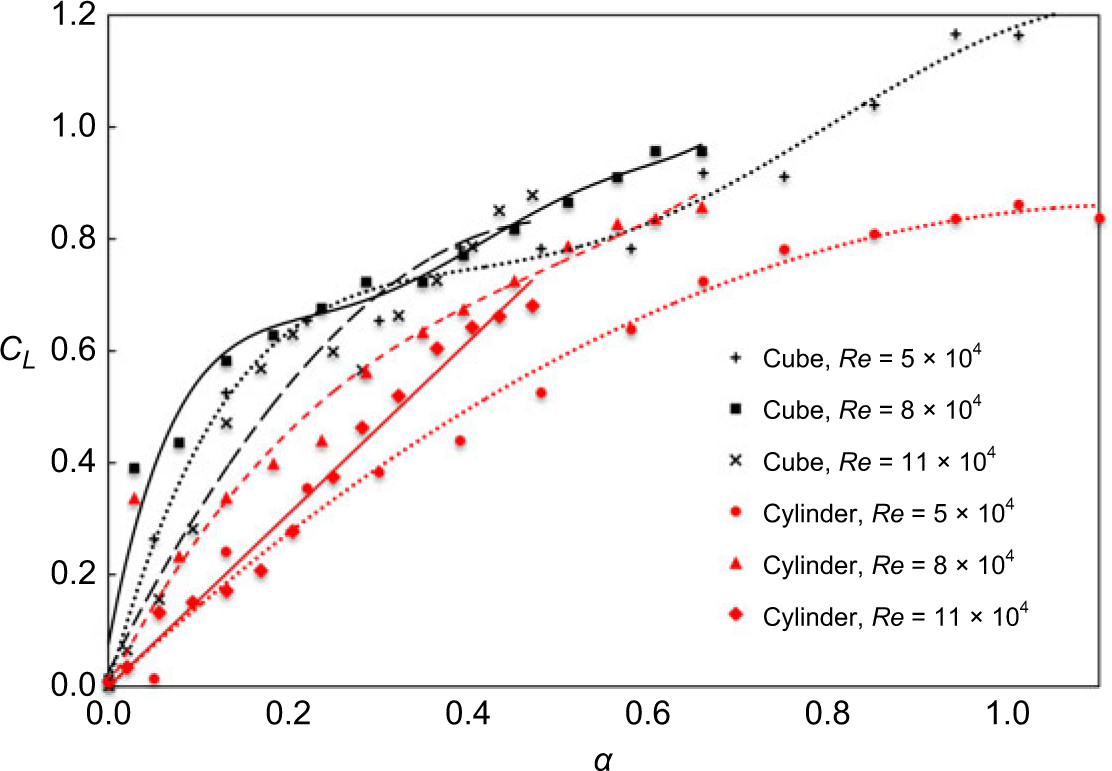
Figure 17. Coefficient of lift of a rough cube and rough cylinder.
3.4 Surface roughness and spin orientation
For the cylinder, cube and diamond, the increasing CL with α suggested that if allowed to rotate faster, a higher achievable lift could be expected. The rough surface on the cylinder led to an average lift increase of 24% compared to the smooth surface (Fig. 18). This was caused by earlier tripping of the boundary layer from laminar to turbulent. The turbulent boundary layer contained more momentum and tended to stay attached to the body for longer, leading to a separation point that was further along the surface than for a smooth cylinder. In the case of the ellipsoid (Fig. 19 and Fig. 20), a more obvious effect occurred after changing the surface roughness. Across all Re, the CL roughly doubled after the surface was covered in sandpaper.

Figure 18. Cylinder lift as a function of spin parameter for varying surface roughness at Re = 11 × 104. The surface was roughened by attaching strips of sandpaper over the whole body.

Figure 19. Coefficient of lift of a rolling ellipsoid.

Figure 20. Coefficient of lift of a tumbling ellipsoid.
The ellipsoid model was first spun maintaining a rolling configuration and again with a tumbling configuration and comparisons showed that CL was directly proportional to α (Figs. 21 and 22), congruent with the cylinder and cube case. No firm conclusion could be made of the effect of Re in these cases, as there was no consistent pattern, but higher Re caused the Magnus force to diminish for the tumbling ellipsoid. For the smooth tumbling ellipsoid, the lift tended to CL = 0.2 for Re = 5 × 10⁴ (Fig. 21); roughness doubled this value. The plateau in CL was akin to that of the sphere (Fig. 13) and this similarity may have been explained by the model taking on the appearance of the sphere at high spin rates (Fig. 23) and thus similar separation patterns may have developed. However, for Re = 11 × 104 (Fig. 22), CL started to reduce for α > 0.4.

Figure 21. Lift on rolling and tumbling ellipsoids at Re = 5 × 10⁴ with two surface roughness levels.

Figure 22. Lift at Re = 11 × 104 for two different ellipsoid orientations both smooth and rough.

Figure 23. The tumbling 100 mm long ellipsoid takes on the appearance of a sphere at high spin rates.
3.5 Equivalent diameter analysis
The equivalent diameter of the sphere and cylinder ‘baseline’ models (Fig. 5) could be found as a proportion of the other shapes’ diameters that give best agreement between the two cases. Steady regions of the cube and cylinder comparison plots (Figs. 14 to 16) have been examined and the relationship between their lift values has been determined as follows:
Taking d = cylinder diameter and a = cube side length
 \begin{align*}
C_{L}^{\kern.5pt cyl}/C_{L}^{\kern.5pt cube}=\left(1/A^{\kern.5pt cyl}\right)/\left(1/A^{\kern.5pt cube}\right)=0.8\Rightarrow (a/d)^{2}=0.8\pi/4 = \pi/5\Rightarrow d/a =\sqrt{5/\pi}\approx 1.26
\end{align*}
\begin{align*}
C_{L}^{\kern.5pt cyl}/C_{L}^{\kern.5pt cube}=\left(1/A^{\kern.5pt cyl}\right)/\left(1/A^{\kern.5pt cube}\right)=0.8\Rightarrow (a/d)^{2}=0.8\pi/4 = \pi/5\Rightarrow d/a =\sqrt{5/\pi}\approx 1.26
\end{align*}
The similarity in behaviour between the two models at higher spin rates means this relationship can be used to model the cube as a cylinder with a diameter equal to 1.26 times the cube side length. This analysis was based on the analogous relationship between CL and α. It was likely that the equivalent diameter was a function of this relationship. For example, it was possible to see that the diamond model (Fig. 14) had followed a similar trend to the sphere (Fig. 13) in that it increased before reaching a maximum lift around α = 0.5 and then decreased. However, the rates at which they increased and decreased differed, which prevented an accurate equivalence in their diameter from being obtained using the same analysis as above.
3.6 Drag characteristics
Plots of CD for various models are shown in Figs. 24 to 26. Again, these were for spin direction 1 only as there was no considerable variation in CD versus α between the two spin directions. Only the cube and diamond had rough surfaces. By comparing the two different sphere-shaft set-ups, a slight drag increase was observed on the sphere attached to the longer 6 mm shaft. For most of the geometries studied, CD was essentially independent of α. However, the drag on the diamond model increased significantly for α < 0.5, above which it began to decrease. This matched the model’s lift behaviour which followed a similar pattern (Figs. 14 to 16). The highest drag recorded was CD = 1.97 for the cylinder at the maximum spin rate and lowest Re.
The tumbling ellipsoid had a consistently higher drag than the rolling ellipsoid, albeit by a very small margin (Figs. 24 to 26). On average, across all spin rates, for Re = 5 × 10⁴, 8 × 10⁴ and 11 × 104, the rolling ellipsoid drag values were 70%, 99% and 90% of the tumbling ellipsoid values, respectively. This suggested that drag was determined much more by the shape than the spin orientation. At low Re, there was higher variability in the drag results, which may have led to the smaller value (70%) compared to that (90%) at the higher Re.

Figure 24. Drag characteristics of various bodies at Re = 5 × 10⁴.

Figure 25. Drag characteristics of various bodies at Re = 8 × 10⁴.

Figure 26. Drag characteristics of various bodies at Re = 11 × 104.
3.7 Implications for runway stone impact models
In relation to previous numerical models designed to generate impact threat maps for aircraft(Reference Nguyen, Greenhalgh, Graham, Francis and Olsson6), the maximum values of CL measured in this study were generally lower than those considered in the numerical models. This study implied that only stones with shape characteristics similar to a tumbling cube could have given rise to CL > 1, which were initial values used in the models to give conservative impact threat maps. An implication of shapes with angular corners (cube and diamond) having had the highest CL values could be that the impacts on aircraft structures are more likely to come from stones with sharp corners or blunt faces. These impact conditions would be very different from those generated by the hemispherical impactors typically used in tests to mimic the damage caused by medium velocity impacts. Aside from the tumbling diamond, the curved surface bodies were measured to have CL values much less than 1, and if the threat map models were rerun with these experimentally measured values, the impact zones would be expected to shift further to the rear of the aircraft due to the reduced upward curve in the trajectories.
What was unexpected before this study had been undertaken was to find such a large range of CD values across the various bodies tested. The implication for this large spread in CD is that, directly behind the wheel of a vehicle where the greatest upward flow fields may be found, the upward forces acting on various debris can be highly sensitive to the debris geometry. Furthermore, stones having geometries similar to cylindrical objects (maximum CD = 1.97 at Re = 5 × 10⁴) would be affected by such flows to the greatest degree. Given the large variations in CL and CD with the shape of the body, the current evidence does not suggest that accurate threat predictions can be made by simply assuming single constant CL and CD values. Such constants would not adequately represent the entire range of stone shapes potentially lying in the path of a vehicle.
A more representative approach would be to attempt to characterise realistic stone geometries and classify them into broad categories to make further analysis tractable. The statistical distributions of the numbers of stones falling into each shape category could then be quantified and used to build up corresponding statistical distributions of CL and CD. Such distributions would be better able to capture the variations in aerodynamic characteristics of stones having a plethora of different geometries. The improved fidelity of this aerodynamic aspect of the models would enable threat maps based on stochastic modelling techniques to provide much more accurate, physically based predictions.
4.0 CONCLUSIONS
The aerospace industry has a need to understand and predict the likelihood, threat zones and severity of impact from runway debris to aircraft structures. There are already detailed numerical models to determine how runway stones may be lofted from aircraft tyres and increasing knowledge as to the nature of damage that can be induced upon impact. However, to accurately predict the trajectory of irregular objects which may possess significant angular velocity, it is vital to venture beyond our current knowledge of spinning body aerodynamics, which is largely limited to spherical objects, cylinders and sports balls. To address this necessity, wind tunnel experiments were carried out to measure the lift and drag forces acting on a range of spinning objects. The model dimensions and flow speeds were scaled to give Re representative of those encountered by runway debris entrained in an aircraft wake. The focus of the study was to investigate the effect of the spinning body geometry on its aerodynamic properties. To this end, a range of regular shapes having both curved surfaces (sphere, ellipsoid, cylinder) and angular edges (cube, diamond) as well as smooth and rough surfaces were tested. The key findings are summarised below:
The Magnus lift was approximately proportional to the spin parameter (α, defined as the ratio of the rotating body equatorial velocity to the flow velocity) for all models except in certain cases:
The sphere at high Re could experience a negative Magnus force, and increasing the spin rate was accompanied by converging CL.
For the sphere and diamond, high spin rates at low Re resulted in decreasing lift due to the movement of the separation point.
For the tumbling ellipsoid, lift was not a function of α beyond a certain value of α (due to similar separation patterns to that of the sphere at high spin rates).
Surface roughening of a cylinder by attaching sandpaper resulted in an average lift increase of 24%. The same technique applied to an ellipsoid doubled the lift for both the rolling and tumbling configurations.
The cube may be modelled as a cylinder for α = 0.3. It was quantitatively inconclusive whether the other shapes may be modelled as either of the baseline cases (sphere or cylinder).
The maximum CL measured was 1.31 for a cube at Re = 5 × 10⁴. The maximum CD was 1.97 for a cylinder at Re = 5 × 10⁴.
4.1 Future research
To corroborate the findings in this study, similar experiments could be carried out using an alternative methodology, for example, using high-speed cameras and a drop mechanism that could track and compare the trajectories. The critical regions of boundary layer transition for the sphere and cylinder in this study were lower than the theory would predict. Future studies should therefore investigate a broader range of Re and plot lift and drag against Re to identify the sub-critical, critical and super-critical regimes, as is commonplace in the literature.
Since all the tests in this study were conducted in dry conditions, further research is needed to establish whether the findings would be applicable for wet runway stones. Experiments on a smooth aerofoil in simulated heavy rain(Reference Wu, Cao and Ismail27) found that the CL dropped by up to 14% and CD increased by up to 56%. It is debatable whether such results provide a useful representation of wet debris because heavy rain acting on an aerofoil causes boundary layer tripping along the entire surface. However, the size of raindrops relative to runway debris may cause earlier or more erratic separation patterns compared to those from raindrops on an aerofoil. Therefore, the results of previous research may not provide a good indication of how a wet stone might behave aerodynamically during the lofting process.
There is no reason why a rotating body generating lift by the Magnus force effect should react to having a wet surface in the same way that an aerofoil is known to be affected. The lift process is quite different, and separation is likely to be controlled much more by the geometry and the rotation speed than by small-scale surface roughness associated with surface wetness. If it is a smooth, round stone and water stays adhered to it, then depending on the Reynolds number and the spin rate, there could be a significant effect on lift due to the influence of transition leading to separation effects. Outside these critical ranges for a smooth stone, and in all cases for a sharp-cornered irregular stone, it is most unlikely the wetting will have any significant effect, since separation will not be affected. Another factor to consider is whether a stone rotating(Reference Nguyen, Greenhalgh, Olsson, Iannucci and Curtis3) at up to 15,000 rpm is likely to retain any water on its surface in any case, because of the large centrifugal forces. Further tests on spinning bodies under wet conditions are therefore recommended to determine whether rain is likely to have a significant effect on CL and CD.
These results could be used to refine runway debris trajectory predictions, which currently rely on simple, conservative assumptions based on the well-known aerodynamic characteristics of spherical objects. To extend the application of the results, it is important to expand the range of test models to include arbitrary stone-shaped models and subsequently refine models to generate impact threat maps(Reference Nguyen, Greenhalgh, Graham, Francis and Olsson6). This could be carried out by 3D scanning stones collected from runways and 3D printing scale models to investigate whether irregular shapes have similar aerodynamic characteristics to regular shapes. This research has the potential to enable development of more realistic numerical models to capture additional complex interactions, which may be brought about by the rapidly changing geometry presented to a flow field by an irregular spinning object. Future research in this field could eventually lead to significantly more accurate impact threat predictions for aircraft or indeed many types of road vehicles.
ACKNOWLEDGEMENTS
The authors gratefully acknowledge the support provided by Roland Hutchins, Mark Grant and Ian Pardew for assisting with 3D printing of models and machining, Franco Giammaria for electronic instrumentation and Ian James for valued advice on designing the experimental rig and preparing the wind tunnel.


