


NOMENCLATURE
Abbreviations
- MDO
multidisciplinary design optimization
- CFD
computational fluid dynamics
1.0 INTRODUCTION
The geometrical shape and location on the fuselage of aircraft air intakes play a pivotal role in defining the engine performance, which in turn is governed by the conversion of the chemical energy of fuel into mechanical energy in terms of forward thrust and work done in compression of air. An optimal inlet design ensures sufficient thrust by providing the requisite airflow pressure to the compressor. As a consequence, several researchers(Reference Mossman and Randall1–Reference Barr, O’Gara and Sinha3) have explored different inlet designs and identified the critical parameters to improve the airflow pressure and the overall aerodynamic features of the aircraft. Amongst these designs, the submerged inlet (also called the flush inlet) has attracted significant interest from researchers due to its unique architecture(Reference Miansari, Ghezelsofloo and Toghraie4–Reference Akram, Prior and Mavris9), especially for aircraft operating in the subsonic flow regime. Submerged inlets were first introduced in the early 1940s. Since then, they have commonly been used as auxiliary air sources for aircraft, and sometimes as the primary source of air induction for unmanned aerial vehicles. The submerged inlet is flush to the contour of the aircraft fuselage and is approached by way of a long, gently sloping ramp, normally divergent in shape. The operating principle of a submerged inlet is based on the formation of two counter-rotating vortices that transfer a considerable proportion of the air past the ends of the entry and out into the external stream. Submerged inlets offer the advantages of low drag, low Radar Cross-Section (RCS) and very low protuberance drag. These types of inlet are effective at subsonic speeds. Particular features of submerged inlets, such as the requirement for a bleed system and their low maintenance complexity and high reliability, have made them promising to improve overall aircraft performance. Furthermore, low fuel use and enhanced range–payload ability and survivability have also been observed as by-products of this peculiar design.
Despite all these advantages, various design challenges have inhibited the full exploitation of submerged inlet technology. The complex flow field generated by their peculiar geometrical features includes mixing of inviscid and viscous flows amid boundary layer development. The vortices generated by the submerged inlet ramp represent another challenge that requires computationally expensive research based on the full potential of existing CFD methodologies and modern tools for their correct investigation and prediction. Several researchers have applied CFD simulations to optimise the design of such inlets(Reference Koch, RÜtten and Rein10,Reference Panidis, Stalewski and ŻÓŁtak11) . Alhough CFD simulations have produced encouraging results, their computational time remains a challenge for such research. Some empirical methods are available in literature, enabling analysis with the fidelity required to simulate anticipated the performance of submerged engine inlets. It has been found that the off-design flight conditions dictate the performance of submerged inlets. For instance, a 20% reduction of the total pressure recovery in comparison with a cruise-optimised design is noted when operated off-design at low speed(Reference Simpson, Lin and Chen12). However, most such inlets do not have wide scope for use in different flight regimes but rather address a particular operating environment. Moreover, extensive empirical/analytical models for inlet design are scarce. There is therefore a strong need for careful consideration of inlet performance across the entire flight regime. However, optimisation techniques for the design of flush inlets require intricate and extensive computations.
The recent impact of data-driven models for the optimisation and solution of complex problems is undeniable. Several researchers have used data-driven models to solve complex fluid dynamics problems. For instance, Reynolds-averaged Navier–Stokes flow predictions including shock waves have been improved by treating the case as an inverse problem and solving it using machine learning algorithms(Reference Singh, Duraisamy and Pan13). In other research, the authors modelled functional forms of turbulent and transitional flows by employing machine learning algorithms on computational and empirical results. The authors found improved functional forms as compared with traditional CFD analysis(Reference Duraisamy, Zhang and Singh14). The cited studies suggest that data-driven models can be used effectively in CFD-based applications. However, to the best of the authors’ knowledge, no existing research is available on design space optimisation of engine inlets. Furthermore, the concept of data fusion, where both computational and data-driven models are used to optimise the design space, has not been researched before. This paper thus describes an attempt to develop a novel hybrid two-stage model by utilising data-driven techniques coupled with CFD analysis. Data mining and surrogate modelling are verified using conventional CFD analysis. The proposed methodology aims to accelerate the submerged inlet design process. This paper presents two novel aspects. First, experiment-based data mining and the surrogate modelling technique are used for low-fidelity prediction of the design parameter interactions and optimisation. This includes the screening of third-order response surface effects and neural network-based sensitivity analysis to characterise the design variable sensitivities. Next, a CFD-based design of experiments is used to sample the design space around the candidate design geometry, produce a higher-fidelity surrogate model and further refine the submerged inlet design. The use of automated shape optimisation within the CFD framework further enhances the capability of the methodology to predict even better designs. The overall process enables designers to explore the whole design space in a much more efficient and effective way when compared with the traditional approach adopted for submerged inlets.
2.0 METHODOLOGY REVIEW
A four-stepped methodology, based on previous work by the authors(Reference Akram, Prior and Mavris9), is proposed for the submerged inlet design, as illustrated by the flowchart shown in Fig. 1. The four key steps include (a) data mining by filtered DOE, (b) the surrogate model design, (c) optimisation using a genetic algorithm and (d) CFD simulation for enhanced design refinement. Moreover, the work is extended by validation of the methodology when implemented for a UAV inlet.

Figure 1. A flowchart of the proposed methodology.
2.1 DOE for data mining
The methodology initially requires an information base of recently run experiments or simulations to provide test cases. The DOE model and nearest point filtering are applied for this purpose. DOE is performed in this research to minimise the work required in the experimental tests and/or to maximise the information content. The DOE is formulated so as to mitigate the influence of performance metrics and variable interactions on the results. Furthermore, DOE is applied to minimise the number of test cases required. A new DOE scheme with reduced orthogonality is obtained by using the nearest point filtering scheme.
In this research, the process of acquiring the nearest point filtered DOE is facilitated by pre-selection of cases from a database of already executed experiments. Since the filtered DOE approach offers greater variation compared with the conventional process of formulating newly assessed cases through a “virgin” DOE, lower-fidelity surrogate models are obtained from the considered DOE. Such surrogate modelling thus enables the acquisition of a first-pass, “coarse” global design optimisation.
At this juncture, interaction effects and design variable sensitivities are characterised by employing third-order polynomial Response Surface Equation (RSE) model effects on the filtered experimental database in Minitab®. The results of the substantial variable interactions are presented as a Pareto plot in Fig. 2, showing the predicted relative impact (%) versus the pressure recovery variability. It can be inferred from this figure that a strong interaction effect exists between the inlet width-to-depth ratio and the ramp angle. Furthermore, the possibility of other, higher-order interactions is indicated by low R 2 values.

Figure 2. An illustration of the variable interaction sensitivities (Pareto plot).
2.2 Creation and validation of a surrogate model
In the second step, a surrogate model through the nearest points filtered by the design of experiments is presented. Surrogate models are chosen to obtain an analytical estimate of the relationship between the input and the yield for a preparation informational index. Surrogate models help by providing fluid-physic-based investigations, for example, CFD simulations, to expedite the design procedure. However, it is observed that speeding up the analysis and configuration measures reduces the applicability and limits the accuracy of the model because the surrogate model is precise inside the space provided by the data.
Neural Networks (NN), RSE, Radial Basis Functions (RBF) and Gaussian Process (GP) models are widely accepted types of surrogate model(Reference Xiao, Zuo and Zhou15,Reference Cozad, Sahinidis and Miller16) . The formulation of a surrogate model involves the following steps:
-
1. Selection of the type of model
-
2. Application of the previously acquired DOE
-
3. Validation of the surrogate model
-
4. Validation corresponding to the nearest-point-filtered DOE
The modelling process may be implemented iteratively, thereby providing the tuned results for the type of surrogate model and its boundaries. When the surrogate model provides adequate results, it may be selected for optimisation purposes. In this research, a surrogate model sensitivity profiler is employed to characterise the interactions between the design variables (Fig. 3). This figure also presents two previews of a neural-network-based sensitivity profiler. A non-linear, univariate relationship from the output to an individual input can be observed for any static preview. Each contour is formulated by the supposition of other design variables which are fixed to a selected design point that can be adjusted to indicate changes in all the univariate relations. The intersection point indicated by a dotted crosshair in each plot represents the chosen design point where the values of the variable are appropriate. Note that further characterisation of the interactions between and sensitivities of design parameters can be obtained through this dynamic adjustment. Figure 3 presents the effect of variation of the designed inlet velocity ratio for given ramp angle and Width-to-Depth (W/D) ratio. Investigation of these interactions enables the identification of improved designs while considering the correlations among the design variables.

Figure 3. Dynamic sensitivity profiler with different designed inlet velocity ratios.
2.3 Optimisation
Surrogate-model-driven optimisation is performed in the third step of the proposed methodology. This step entails the implementation of a stochastic optimisation heuristic for quick execution and to avoid becoming trapped at local optima. A candidate globally optimal design is the outcome of this design phase, while the approximation error can be obtained from the surrogate modelling process, the error tolerance of the stochastic optimisation protocol and the non-orthogonal DOE. This chosen design will serve as the starting point for further conventional CFD- and gradient-based optimisation techniques. Negligible processing time is required to generate this result, as the data are “mined” rather than being “framed.” The computational time required for the CFD-based refinement steps is reduced due to the availability of this initialisation point.
2.4 Verification and refinement of design point using CFD
The final phase of the proposed methodology entails the verification and refinement of the candidate design using the state-of-the-art computational technique, CFD.
CFD analysis utilises different equations such as Newton’s second law of motion, the mass continuity equation and the first law of thermodynamics to describe the flow of a compressible, nonreacting, viscous fluid. The Navier–Stokes equations are typically used for this purpose. A modified form of the Navier–Stoke equation, viz. Reynolds-Averaged Navier–Stokes (RANS), is generally employed for engineering analysis, utilising models such as Spalart–Allmaras,
 $k-\varepsilon$
and its variants,
$k-\varepsilon$
and its variants,
 $k-\omega$
and its variants and the Reynolds Stress Model (RSM). The Spalart–Allmaras model is a comparatively simple, one-equation model that provides a model transport equation for the kinematic eddy (turbulent) viscosity and is formulated explicitly for aerospace applications. It has proved to be viable and accurate for wall-bounded flows and has provided good results recently for boundary layers exposed to adverse pressure gradients. For these obvious advantages, the Spalart–Allmaras model was chosen for the current study(Reference Spalart and Allmaras17). After selecting the model, the following numerical solution procedures are applied to discretise and solve the general scalar transport equation until a final, optimised result is obtained:
$k-\omega$
and its variants and the Reynolds Stress Model (RSM). The Spalart–Allmaras model is a comparatively simple, one-equation model that provides a model transport equation for the kinematic eddy (turbulent) viscosity and is formulated explicitly for aerospace applications. It has proved to be viable and accurate for wall-bounded flows and has provided good results recently for boundary layers exposed to adverse pressure gradients. For these obvious advantages, the Spalart–Allmaras model was chosen for the current study(Reference Spalart and Allmaras17). After selecting the model, the following numerical solution procedures are applied to discretise and solve the general scalar transport equation until a final, optimised result is obtained:
-
1. Domain discretisation
-
2. Discretisation of one or more governing equations of interest
-
3. Solution of the resulting discrete algebraic equations
Once the optimised design parameters have been obtained from the conventional CFD simulations, a novel data-fusion methodology is adopted to verify and refine the design point. The proposed methodology selects one of three different techniques, viz. the DOE, surrogate model and optimisation study, based on the “farmed” data obtained from a CFD simulation. Gradient-based optimisation is then employed in connection with the CFD analysis. Towards the end, a finite-difference gradient calculation is employed on the candidate design point to demonstrate its local optimality. These three models (that is, DOE, surrogate and CFD) can be used to enhance the reliability, accuracy and efficiency of the results.
3.0 DESCRIPTION OF UAV SUBMERGED INLET DESIGN PARAMETERS
The section describes the implementation of the proposed model on a formulated benchmark problem. The key components of the problem include the baseline inlet geometry and fixed engine geometry, a particular flight condition, the performance metrics, the design variable selection, the CFD model creation and the database selection for the low-fidelity prediction and nearest points DOE filtering.
3.1 Component geometries, baseline flight condition and design objectives
The performance of a submerged inlet is strongly related to its geometrical design. From this perspective, the key design characteristics for this research are taken to be a flat UAV skin with a submerged inlet, an engine entry face and a duct. Figure 4 illustrates the dimensions of the UAV engine. The targeted design objectives of the UAV submerged inlet are presented in Table 1.
Table 1 Design objectives for the UAV inlet


Figure 4. Dimensions of engine face.
NACA Research Memorandum A7I30(Reference Mossman and Randall1) dictates the definitions of these inlet characteristics, while the parameter values are also based on references give in the NACA report. The values for the supplementary baseline design parameters were extracted and are presented in Table 2. Figure 5 presents the final inlet geometry with all its dimensions (in centimetres).
Table 2 Baseline design parameters

Table 3 Grid independence analysis


Figure 5. Submerged inlet geometry.
3.2 Formulation of CFD model
The solid model and grid for the whole geometric model were generated using CATIA® and ANSYS Gambit® CAD software, respectively. The whole design domain was meshed using an unstructured tetrahedral grid scheme. A half model with a symmetry plane is constructed, considering zero sideslip and zero angle-of-attack. The throat area, inlet plan form, diffuser section, an engine with a protruding dome and the side edge of the ramp floor are included by connecting volumes with shared joining faces. Sizing functions were utilised at the inlet ramp entrance area, due to the anticipation of a high gradient flow. Rectangular-domain boundary conditions were applied, with the bottom wall contacted through the inlet cavity. To study grid independence, a coarse mesh was selected for further analysis. Figure 6 presents the entire geometry and domain, showing the tetrahedral mesh with the x–z symmetry plane that is valid for the whole geometry. Symmetrical boundary conditions were defined for the top plane of the flow field domain, the longitudinal plane far from the plane of symmetry and the upper plane. Pressure inlet and pressure outlet boundary conditions were imposed at the inlet and exit planes. No-slip boundary conditions along with the adiabatic wall condition (no heat transfer across this wall) and zero normal pressure gradient (∂p/∂y = 0.0) were applied on the duct and engine dome. The remaining solid walls of the geometry were specified as having zero shear to reduce the effort required for the boundary-layer solution saved. The boundary conditions are illustrated in Fig. 6.

Figure 6. Baseline CFD mesh.
Three meshes were generated using Gambit® software for the grid independence study, and three performance parameters were observed: the mass flow rate, the pressure recovery and the average Mach number at the engine face. Since there was only a 1% difference between the values, the medium-sized mesh including 536,978 tetrahedral elements was selected for further computational study and analysis purposes. Mesh deformation was performed using Sculptor by Optimal Solutions® to save computational time without compromising the solution. The numerical simulations were carried out at Ma = 0.8.
3.3 Simulation approach adopted for CFD design
ANSYS Fluent® and Sculptor® were used for the optimal solutions to enable high-fidelity simulations for the new designs and convergence of aerodynamic parameters such as the pressure recovery of the inlet. The solution for the baseline geometry was used to initiate the other transient simulations. Approximately 2,000 iterations were required to achieve convergence. The application of Sculptor® significantly reduced the run time of the CFD simulations by enabling automated mesh deformation. Grouping of control points placed manually in the mesh was used to achieve its deformation. The effect of linear scaling was applied by grouping the control points for the mesh of the inlet ramp, the inlet ramp width length and the inlet ramp depth. These three scales were then changed to vary the throat ramp angle and W/D ratio while preserving the baseline inlet throat area. Figure 7 shows the basic concept of the control point grouping.

Figure 7. Mesh deformation using Sculptor®.
3.4 Experimental database for low-fidelity approximation
DOE sampling was applied based on the data from a previously published article(Reference Mossman and Randall1). The scatterplot matrix shown in Fig. 8 illustrates the combinations of sampled design variables. The database corresponded to almost a full-factorial examination of the five design parameters with a bias ramp shape and a ramp angle of 7°. Scenarios with a ramp angle of 5° or 15° were sampled in detail in areas of low and high W/D, respectively. It was expected that the predicted results would exhibit bias due to the discrepancy in flow conditions between the experimental results published by NACA and the benchmark problems. this difference is largely governed by the difference in Reynolds number between the flows and the relative thickness of the inlet boundary layer. However, the response of the performance to the slope of the inlet is sufficiently comparable to permit reasonable estimates. The aim of using the experimental database is to obtain a reasonable initial guess for the optimised values of this model in terms of the optimal inlet geometry for use in a design that will lie close to the basin of the global optimum.

Figure 8. Database input space coverage(Reference Akram, Prior and Mavris9).
3.5 Optimisation of parameters
The aim of the considered problem is to maximise the inlet pressure recovery for a given throat area of the inlet. The W/D ratio of the inlet throat and the ramp angle were regarded as the Degrees of Freedom (DOF). The ratio of the inlet to duct exhaust velocity was consistent (
 $\sim$
0.6) for each simulation. A straight ramp shape and curved divergent wall type were preserved(Reference Mossman and Randall1). The W/D ratio ranged between 1 and 6, while the ramp angle was varied from 5° to 15°(Reference Akram, Prior and Mavris9).
$\sim$
0.6) for each simulation. A straight ramp shape and curved divergent wall type were preserved(Reference Mossman and Randall1). The W/D ratio ranged between 1 and 6, while the ramp angle was varied from 5° to 15°(Reference Akram, Prior and Mavris9).
4.0 RESULTS
This section presents each step required for the application of the proposed methodology to the defined baseline design problem, i.e., a UAV submerged inlet.
4.1 Step I: use of DOE for data mining
Observation of Fig. 8 (the database used for sampling) reveals that a condensed set of training cases can be obtained without applying nearest points filtering. This is primarily because of the limited possibilities of the presented data and the insignificant bias observed in the dataset. Hence, the surrogate model training (step 2) utilises the complete database. No population was thus retained to evaluate the errors in the model due to this lack of data filtering. The model fit error and cross-validation error will thus define the decisive criteria to confirm the legitimacy of the surrogate model in this problem.
4.2 Step II: creation and validation of surrogate model
A surrogate model was formulated to illustrate the pressure recovery as a function of the ramp angle, wall type, W/D ratio, inlet velocity ratio and ramp plan form. A multilayer perceptron (MLP) neural network was selected for the surrogate model due to its enhanced ability to capture the non-linear response behaviour that is expected in the considered design problem. The key plan including pressure recovery as a component of slope point, inclined plan form, W/D ratio and velocity ratio was anticipated in this evolution. The training dataset is acquired from a 1948 NACA wind-tunnel study of subsonic submerged inlets, described in NACA Research Memorandum A7I30(Reference Mossman and Randall1). A 15-node neural network was trained using the preliminary information based on eightfold Gauss–Newton least-squares fitting and tenfold cross-approval in JMP® software by SAS®. The model was then confirmed by plotting and analysing the R 2 values, the actual versus predicted results and the residual errors versus the predicted model fit. A low possibility of overfitting was confirmed by the typical R 2 value of 0.99, with a mean of 0.02% and 1.3% standard deviation for the model fit error.
4.3 Step III: genetic algorithm
The next step involves design optimisation by employing the surrogate model as an inlet performance predictor. The MATLAB GA Toolbox was applied for the current analysis. To maximise the pressure recovery, the optimiser was defined with a curve divergent wall type, a fixed inlet velocity ratio of 0.6 and a straight ramp shape. The objective functions for this study are chosen as the ramp angle and the W/D ratio, which should be maximised. Similar to Ref. Reference Akram, Prior and Mavris9, the population size was defined as 20, rank scales were employed to categorise individuals’ scores and the selection was made using the uniform stochastic method. An elite count of 2 was applied. The adaptive feasible and scattered methods were used for mutation and crossover, respectively. The optimisation yielded a ramp angle of 5° and a W/D ratio of 2.66. This candidate optimum design is denoted as candidate optimum #I and will be utilised as the preliminary condition for the next step in the inlet design.

Figure 9. (a) Predicted versus actual results, and (b) predicted versus residuals.
4.4 Step IV: CFD for design verification and improvement
The candidate optimum design obtained in the previous stage was further validated and refined in this stage by developing a higher-fidelity CFD-based method. For this purpose, the candidate optimum geometry was initially run using the ANSYS Fluent® solver on a mesh deformed by Sculptor®. The operating principle of the submerged inlet can be seen clearly through the path lines shown in Fig. 10. The straight path lines show how the incoming air forms vortices as it reaches the ramp planform of the submerged inlet, pulling the airflow inside the ramp of the inlet.

Figure 10. Flow traces showing the formation of vortices over inlet sidewalls.
Figure 11(a, b) depicts the static pressure and velocity distribution on the symmetry planes for the
 $k-\varepsilon$
model, confirming that the flow characteristics are not affected.
$k-\varepsilon$
model, confirming that the flow characteristics are not affected.

Figure 11. (a) Static pressure distribution of the optimised NACA flush inlet. (b) Mach number distribution on the midplane of the optimised NACA flush inlet at Mach 0.8.
The distribution of the static pressure and the corresponding Mach number on the midplane of the submerged inlet confirm the smooth transition of the pressure and Mach number, with no sudden changes. These results are obtained for a Mach number of 0.8 and a backpressure of 109,984Pa, giving a mass flow rate of 6.5kg/s. These results indicate that a shockwave is not present in the duct. The flow in the inlet duct exhibits higher pressures and lower velocities as compared with the freestream. This is due to the deceleration of the flow caused by the change in area in the duct and the backpressure present at the duct exit. The flow adjacent to the walls of the submerged inlet indicates no flow separation regions as there is no abrupt change in the direction of the velocity vectors (Fig. 12). However, the effect of vortex generation at the sidewalls can be seen in the behaviour of the velocity vectors along the wall.
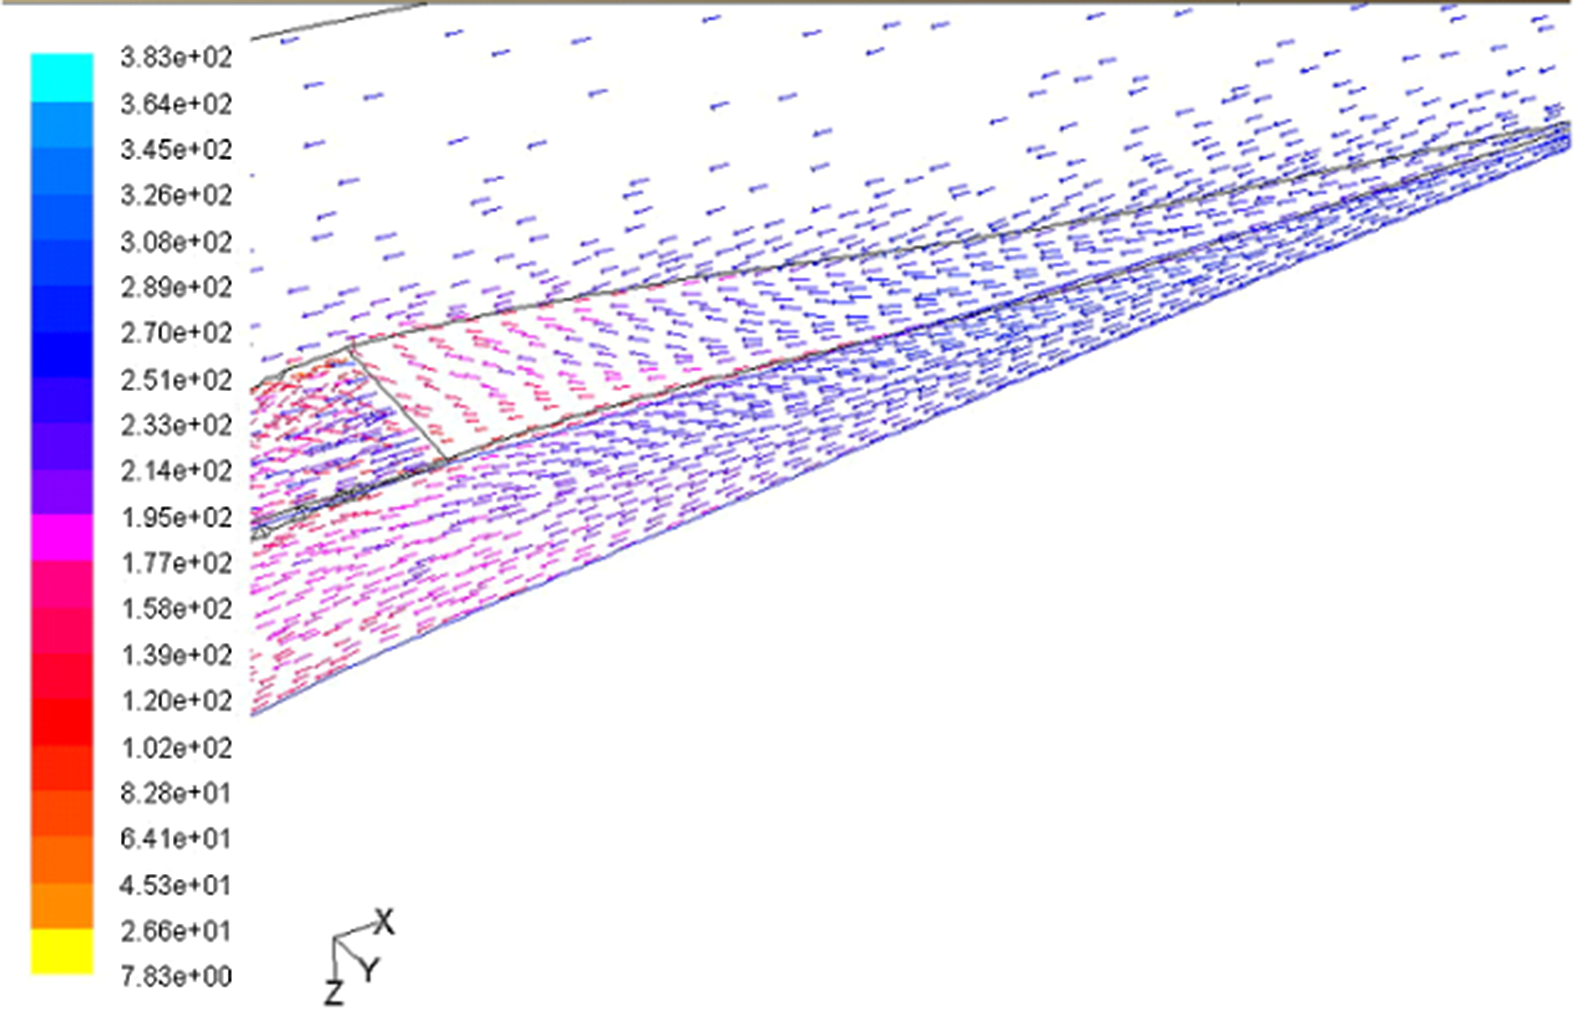
Figure 12. Velocity vectors adjacent to the submerged inlet at Mach 0.8.
Total pressure distortion calculations were carried out at the engine face. Figure 13a shows the total pressure distribution on the engine face when the submerged inlet is operating at a Mach number of 0.8 with a mass flow rate of 6.5kg/s. The distortion coefficient is 0.06 for this pressure distribution. The Mach number at the engine face is also of interest during the present study, showing an acceptable average value of 0.47. The distribution of the Mach number over the engine face shows even lower values (
 $\sim$
0.4) in the area of the root of the compressor blades (Fig. 13b). This helps keep the tip speed of the compressor blades below the speed of sound relative to the incoming air.
$\sim$
0.4) in the area of the root of the compressor blades (Fig. 13b). This helps keep the tip speed of the compressor blades below the speed of sound relative to the incoming air.
Table 4 Comparison of inlet design parameters


Figure 13. (a) Total pressure distribution on engine face at Mach 0.8, and (b) Mach number distribution on engine face at Mach 0.8.
5.0 DISCUSSION
A candidate optimum design that is predicted to offer improved performance was obtained through the CFD analysis considered herein. A substantial difference in the CFD pressure recovery and neural network predictions is observed because the low-fidelity analysis utilises experimental results corresponding to a different initial boundary-layer thickness and Reynolds number compared with the UAV benchmark inlet. Table 4 presents a comparison between the candidate optimal design acquired from the Genetic Algorithm (GA) optimisation versus the baseline design.
Inspection of the results presented in Table 4 reveals an enhancement over the baseline design. The predictions obtained using the neural network model are sufficiently accurate to define an enhanced inlet design. A higher-fidelity surrogate model is then created by conducting CFD-based DOE sampling. For this study, the optimisation of only two design variables is considered. A nine-case, full-factorial, three-level DOE is thus regarded to be a rational choice. This scheme enables an orthogonal DOE and permits the creation of a second-order local RSE. The parameters are adjusted within ranges designed to include a small region around the candidate optimum design while encompassing the improved design. The W/D design variable is chosen to take values of 2.3, 2.6 and 3.0, while the ramp angle is adjusted to 4.75°, 5.00° and 5.25°, leaving the wall type and ramp shape constant throughout the analysis. Figure 14 presents the DOE results obtained using Sculptor® and Fluent®. A second-order RSE surrogate model is constructed using these DOE results, achieving an R 2 value of 0.995. The mean and standard deviation for the model fit of the error distribution of the regression are calculated to be 9.44 × 10⁻⁷ and 0.0103, respectively.

Figure 14. Local DOE results based on CFD.
Figure 15 presents sensitivity profiler plots of the pressure recovery versus the ramp angle and W/D ratio using the newly formulated surrogate model. The solid lines in the sensitivity profile illustrate the univariate variation of the output statistic due to deviations in the input value when the other inputs are kept constant at the designated design points (the candidate optimum #I in this case). The dashed lines above and below the solid curves indicate the 95% confidence interval corresponding to the fitting error.

Figure 15. Second-order RSE sensitivity profiler.
It can be deduced from Fig. 15 that there is significant uncertainty in the pressure recovery owing to the model fitting error related to the ranges of the input variables and sensitivities to these variables. Based on the results, a 95% confidence interval region is estimated and shown in Fig. 16. Here, the true CFD optimum denotes the optimum that would be observed if the truncation error, discretisation error and numerical noise could be eradicated from the results. The 95% confidence interval is defined as the region where the input–output space includes the true CFD optimum with 95% confidence. The best design is seen to lie in the vicinity of the bottom of the 95% confidence interval curve, considering that the optimum design achieves equivalent or superior performance if the 95% confidence interval curves contain the true CFD-predicted optimum design. The lower horizontal boundary of the region including (with 95% confidence) the true CFD-predicted optimum is represented by the maximum point of the curve. The upper 95% confidence curve approximately indicates the boundary of the region that encompasses the true CFD-based optimum. Hence, the shaded region in Fig. 16 can be regarded as the 95% confidence interval. The size of the shaded area indicates the optimal input value combinations, independent of model uncertainty.
Applying this concept to the proposed CFD-based surrogate model, the optimum W/D ratio ranges between 2.47 and 2.83 and a ramp angle below 5° is obtained with 95% confidence.

Figure 16. Confidence intervals.
6.0 CONCLUSIONS
The development of a novel data-fusion hybrid model (a data-driven method coupled with CFD simulations) is presented to optimise the design of an inlet duct for a UAV. Applying the proposed methodology to the UAV design problem, it is shown that the proposed methodology provides improved results in terms of reduced computational time compared with the conventional CFD technique and yielded a high-fidelity model in comparison with standalone data-driven conventional models. Some of the key conclusions that can be drawn from this research are as follows:
-
1. Strong interactions between variables are observed based on the adjustment of the sensitivity profiles in the design space. The interactions cannot be quantified by merely investigating the surrogate model due to the interactions inside the network structure of the neural network. Similarly, a CFD-based surrogate model including a notable second-order interaction term between the ramp angle and W/D ratio is applied in the validation and refinement steps. This model considers a limited regime and provides understanding inside its domain of applicability. The evaluation of third-order RSE effects provides further insgiht into the interactions between the input variables. The sensitivity analysis permits the measurement of critical variable interactions. Pareto plots, sensitivity profiling and polynomial effect screening can provide important complementary views on the interactions between the input variables.
-
2. The proposed methodology provides an optimum design for the submerged inlet of a UAV based on the pressure recovery, with 95% confidence. However, the intrinsic unpredictability of the CFD-based prediction prevents further refinement. Nevertheless, the CFD evaluation improved the design by accounting for the bias resulting from the low-fidelity neural network prediction.


