


NOMENCLATURE
- d
diameter
- Wrs
weight loss with respect to (w.r.t.) the reference material
- Ws
weight of the sample tyre
- Wr
weight of the reference tyre sample, Wr = 214.7 mg
- D
mean density of the tyre samples, D = 1.1428 g/cm3
- ISO
International Organization for Standardization
- NASA
National Aeronautics and Space Administration
- NDT
Non-Destructive Testing
- SEM
Scanning Electron Microscope
ABBREVIATIONS
1.0 INTRODUCTION
Many safety studies on automobile tyres have been performed whereas only a few on aircraft tyres. The operating conditions and the structure of aircraft tyres are much more different tyrewhen compared to automobile tyres(Reference Konde, Rosu, Lebon, Brardo and Devesa1). Basically, aircraft tyres are made out of a specific combination of rubber compounds, cord and steel belts. The major parts of an aircraft tyre are the body, sidewalls, beads, and treads(Reference Konde, Rosu, Lebon, Brardo and Devesa1). Aircraft tyres require more attention compared to automobile tyres as aircraft tyres encounter sudden high speeds and heavy weights(Reference Behroozi, Olatunbosun and Ding2). For safety in an aircraft, tyres play a major role during the taxiing and landing processes(Reference Guo, Bastien, Blundell and Wood3). During the taxiing of an aircraft, tyres enable the aircraft to achieve the required speed to take off; while during landing, tyres provide a gripping surface, absorb initial loads, discharge electricity and also bear the weight of the aircraft.
Consider the rotational mechanism of aircraft tyres. The aircraft tyres first contact the runway and the wheels do not rotate at ground speed at that moment. This generates a speed difference between the translational ground speed of the aircraft and the tangential speed of the tyre radius, which causes the tyres to skid. By accelerating, the pilot can avoid the slipping of the wheels when the speed of the wheels matches the forward speed of the aircraft along the runway(Reference Alroqi and Wang4). The small cloud of smoke can be visualised at the exact touchdown point during landing of the aircraft due to high friction between the runway surface and the tyre surface. This friction generates a high amount of heat which can even burn the tyre(Reference Clark and Dodge5). The polymeric properties of the polymers in the aircraft tyres are susceptible to degradation in the presence of high temperature. Hence, the aircraft tyres may lose their strength when they undergo high-temperature conditions(6).
As per the literature(Reference Kongo, Rosu, Ebon, Brardo and Devesa7), most of the studies related to pneumatic tyres are about car tyres. Out of these studies, only a few research works were found for aircraft tyres. Three of these research studies were done by NASA(Reference Tanner, Dreher, Strubb and Smith8–Reference Clark and Doge10) and they considered only the influence of temperature on aircraft tyres. When determining the thermomechanical behaviour of aircraft tyres, the researchers mustdeal with such nonlinearity parameters as geometry, the properties of the aircraft tyre materials, the friction coefficient, the dissipative mechanisms, and the thermal coefficients(Reference Konde, Rosu, Lebon, Brardo and Devesa11). But it is very challenging to analyse those parameters as aircraft tyres experienced different operational and environmental conditions while in service(Reference Hamid and Ghoreishy12). Moreover, many attempts were taken to quantify tyre wear theoretically by aggregating the abrasion patterns, slippage, temperature effects and the geometry of the contact surface. But there is no literature which was related to tyre wear in Y12 aircraft tyres. The primary objective of this research was to analyse the discrepancies in polymeric properties of nose and main-gear tyres in Y12 aircraft after completion of 50 landings. The outcome of this research work would help solve the lack of knowledge about the materials properties in aircraft tyres.
2.0 METHODOLOGY
In this study, polymeric properties were analysed in the nose and main-gear tyres of Y12 aircraft after the completion of 50 landings. Polymeric properties in each tyre sample was measured using three testing methods, namely Uniaxial tensile test and elongation test, Abrasion test and Hardness test. The ISO standards were followed throughout the testing process in order to obtain the most accurate results for each sample. The tyres have worn out only on one side of the tyre along the perimeter, while the other half along the perimeter was not worn out at all. During the selection process of the control tyre samples for the study, several concerns were made such as it was not appropriate to select a brand new tyre as a control tyre sample as it is stored under specific conditioning temperatures whereas experimental tyres are not. Because the objective of this study was to analyse the discrepancies in polymeric properties that occurred in the Y12 aircraft tyre after the completion of 50 landings; hence the control sample also should have gone through similar environmental and operational conditions. Hence, the unworn side of the aircraft tyres were taken as the control tyre samples to do the comparison of polymeric properties.
2.1 Selection of samples for the experiment
The landing gear configuration of Y12 aircraft is the non-retractable tricycle type with a single wheel in each nose gear and two main gears(13). Three tyre samples were separately mounted to the nose gear, to the right main gear and also to the left main gear simultaneously. However, during the landing process, the main two gears support most of the weight of the aircraft compared with the nose gear, as the centre of gravity is forward of the main gear. Aircraft are usually designed to carry 10–12% of the aircraft weight on the nose gear and 88–90% distributed equally between or among the main gears(14). Hence, the three tyre samples were not subjected to the same loads. But the total weight of the aircraft with the passengers was maintained constant during every landing.
All the tyre samples were manufactured by the same manufacturer and the storage conditions were similar for all tyre samples before being mounted to the aircraft.
2.2 Preparation of specimens
The standard shape for each test method was obtained by standard dies and cutters. During the cutting process, the applied external forces were minimised as it adversely affected the tyre samples as polymers deform easily. Hence, all tyre samples were obtained only from the outermost layer (Fig. 1) of the tyre as it was the surface that was the most vulnerable to wear, unlike neither of the inner layers of the tyre. It was assumed that deformations did not happen in the process of obtaining the samples with the aid of dies and cutters.
Figure 1. Cross-section of an aircraft tyre.
As shown in Fig. 2, samples were obtained from each tyre sample having different shapes.
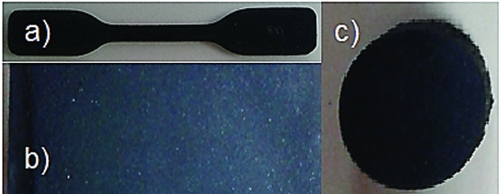
Figure 2. Standard shape types for tyre specimens; (a) Dumbbell shape; (b) Rectangular; (c) Circular shape.
2.3 Labelling system for tyre samples
In order to identify tyre samples separately, each tyre and also each tyre sample was given a specific label. The tyre number and the sample number from each tyre were used in this tyre sample labelling system. Hence, each tyre label gave a clear indication of the tyre number of a particular tyre sample belongs to and also the sample number in which sample that it belongs to in a particular tyre type. Four samples were obtained from each tyre for each test method. The labelling system for tested specimens was as follows:
Where if it was, XCY, X denoted the tyre number and Y denote the specimen number in each tyre. X = 0, 1, 2 and 3, Y = 1, 2, 3 and 4.
2.4 Material characterisations
All the tests were carried out as per ISO standards. The Uniaxial tensile test was carried out according to ISO 37 (5th edition, 2011-12-15) test standards, Abrasion test was done as per the ISO 4649 (3rd edition, 2010-09-15) and ISO 7619-1 (2nd edition, 2010-10-01) was followed for Hardness test.
2.4.1 Uniaxial tensile test and elongation test
The dumbbell shape test specimens were obtained (Fig. 3) after conditioning under the standard conditions as per the ISO 37 (5th edition, 2011-12-15) standard. The test samples comprised with the length of 25 mm, width 4 mm and thickness 2 mm.

Figure 3. Dimensions of the test specimen.
As shown in Fig. 4, the thickness of each specimen was measured using Absolute Digimatic Indicator ID-C Series 543, Mitutoyo -Japan and recorded.
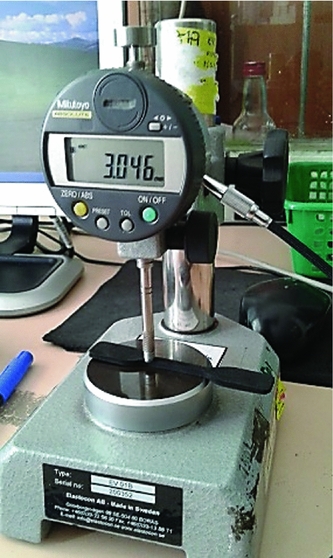
Figure 4. Measuring the thickness of each sample.
The clamping positions of each sample was marked using a sticky tape as shown in Fig. 5).
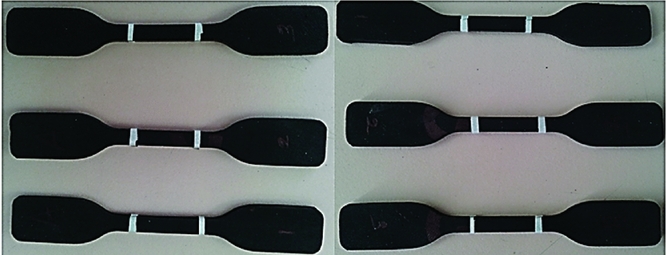
Figure 5. Clamping positions in each sample.
Each sample was mounted to the Tensometer (4486, Instron, US) individually as shown in Fig. 6 and the proper alignment of the laser beam was maintained along the centre of the sample.
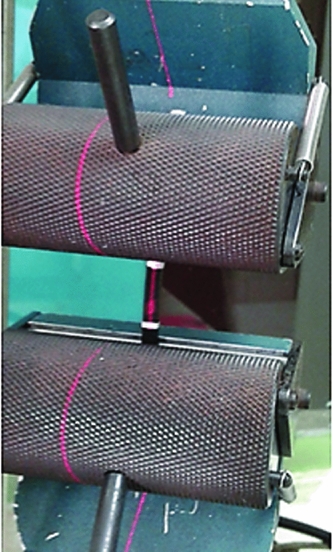
Figure 6. Proper alignment of the beam along the centre of the sample.
The Tensometer was operated in order to apply a force to the specimen. The respective elongations were recorded for each sample as shown in Fig. 7.
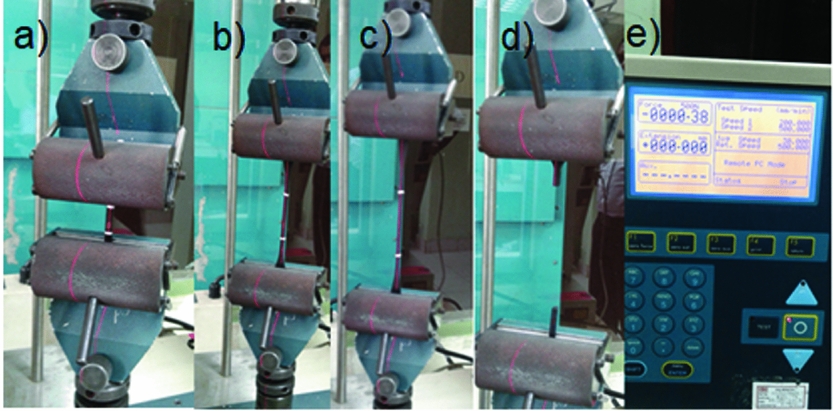
Figure 7. Sample testing in Tensometer (a) initial position, (b) elongation, (c) further elongation, (d) breakage, (e) recording.
2.4.2 Abrasion test
After obtaining all the circular shape specimens (Fig. 8(a)) from both Control and Sample tyres the initial weights were measured (Fig. 8(b)) in every specimen using Sartorius, Analytical Balance-Germany and recorded.
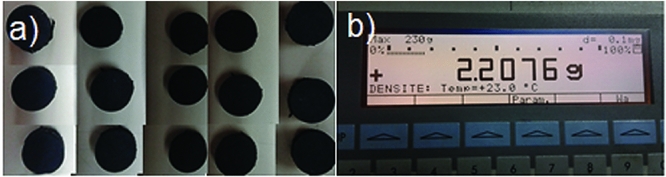
Figure 8. Samples used for the abrasion test; (a) Sample specimens; (b) Weight recorder.
The weighted specimen was clamped to the abrader machine (Fig. 9(a)) (HT8621B, Hung Ta Instruments, US) as shown in Fig. 9(b) and ISO 4649 (3rd edition, 2010-09-15) standard was followed to conduct the experiment.
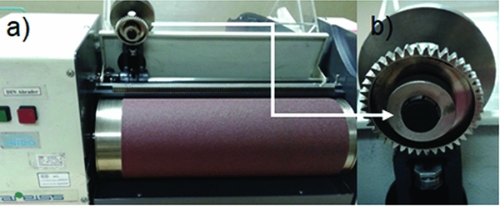
Figure 9. Abrader machine with the clamped sample; (a) Abrader machine; (b) Mounted circular tyre sample.
The final weight for each specimen was recorded after each test as shown in Fig. 10.
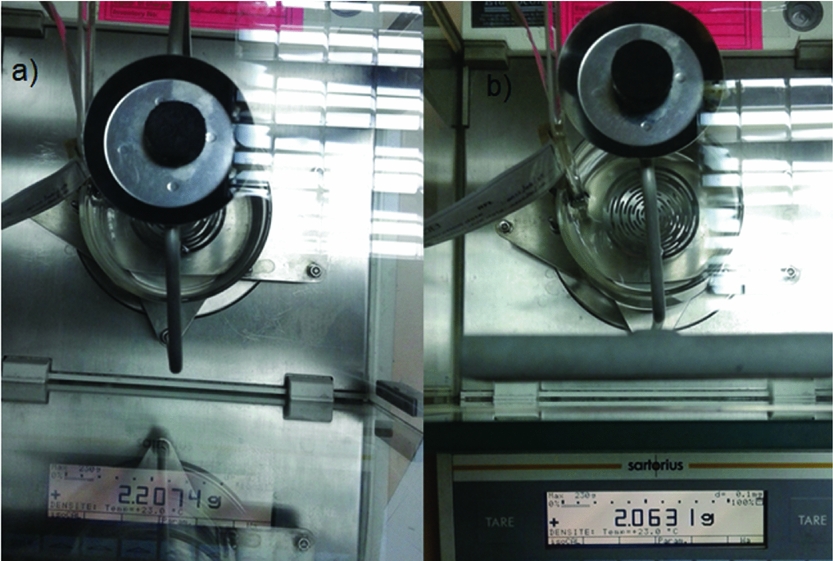
Figure 10. Measuring the weight of specimen; (a) before the abrasion test; (b) after the abrasion test.
The volume loss was calculated based on the weight difference.
2.4.3 Hardness test
After obtaining all rectangular-shape specimens (Fig. 11) from the tyres, the Hardness test was carried out for each specimen after clamping the specimen in the hardness tester as shown in Fig. 12. The experiments were carried out as per ISO 7619-1 (2nd edition, 2010-10-01).
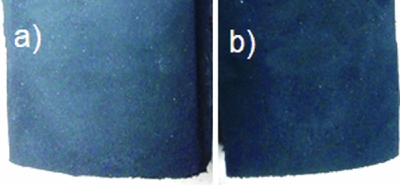
Figure 11. Specimens for hardness test; (a) Control tyre sample; (b) Worn-out tyre sample.
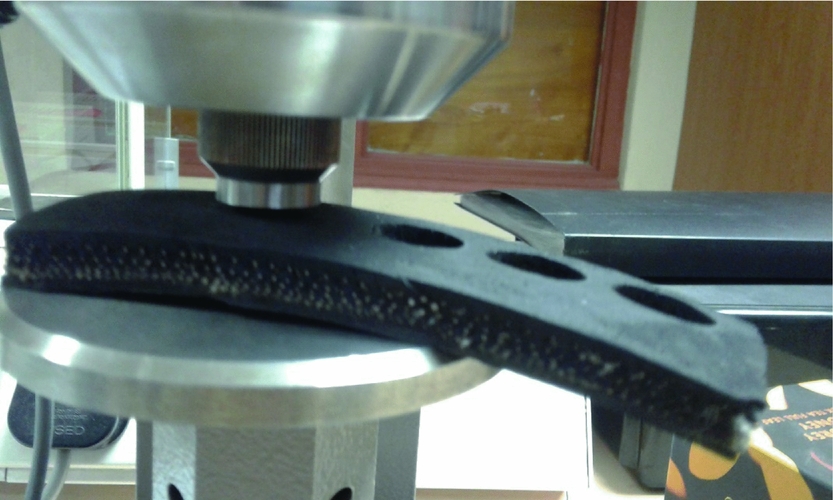
Figure 12. Clamped sample for hardness test.
The obtained hardness values for each specimen was recorded.
3.0 RESULTS AND DISCUSSION
3.1 Tensile strength and elongation test results
The dimensions of a tested samples were shown in Fig. 3. The dimensions given in Table 1 are compatible with the standard dimensions given in ISO 37 (5th edition, 2011-12-15).
Table 1 Dimensions for the tested specimens
3.1.1 Dimensions for dumbbell specimens
Table 1 shows the dimensions of all the tested samples for tensile stress and strain. There were 24 dumbbell shaped specimens from three different tyre categories. Namely, 0C1, 0C2, 0C3 and 0C4 belong to all control tyre samples, which were obtained from each tyre types. The notation of 1C1, 1C2, 1C3 and 1C4 belong to tyre type 1; 2C1, 2C2, 2C3 and 2C4 belongs to tyre type 2; and 3C1, 3C2, 3C3 and 3C4 belongs to tyre type 3. As per the values given in the table, the length and width were similar in all the dumbbell shapes. Although there was a small deviation of the thickness in each sample, these deviations were within the acceptable range as the deviated range of the width was ±0.274 mm. Therefore, during the test, the dumbbell-shaped specimens were considered as uniform in dimensions.
3.1.2 Calculated values for tensile strength and elongation at break, %
As shown in Table 2, tensile strength values were calculated (Equation 1) for the specimens obtained from Tyre 1. Four readings were obtained for both Control tyre 1 and Sample tyre 1. The median tensile strength was calculated and the similar procedure was repeated for the other tyre types as well.
 $$\begin{equation}
{\rm{Tensile}}\;{\rm{strength}} = \left( {{\rm{applied}}\;{\rm{load}}\;{\rm{at}}\;{\rm{break}}} \right)/\left( {{\rm{original}}\;{\rm{width}}} \right) \times \left( {{\rm{original}}\;{\rm{thickness}}} \right),
\end{equation}$$
$$\begin{equation}
{\rm{Tensile}}\;{\rm{strength}} = \left( {{\rm{applied}}\;{\rm{load}}\;{\rm{at}}\;{\rm{break}}} \right)/\left( {{\rm{original}}\;{\rm{width}}} \right) \times \left( {{\rm{original}}\;{\rm{thickness}}} \right),
\end{equation}$$
 $$\begin{equation}
{\rm{Percent}}\;{\rm{elongation}}\;{\rm{at}}\;{\rm{break}} = \left( {{\rm{elongation}}\;{\rm{at}}\;{\rm{rupture}}} \right) \times 100/\left( {{\rm{initial}}\;{\rm{gauge}}\;{\rm{length}}} \right)
\end{equation}$$
$$\begin{equation}
{\rm{Percent}}\;{\rm{elongation}}\;{\rm{at}}\;{\rm{break}} = \left( {{\rm{elongation}}\;{\rm{at}}\;{\rm{rupture}}} \right) \times 100/\left( {{\rm{initial}}\;{\rm{gauge}}\;{\rm{length}}} \right)
\end{equation}$$
Table 2 Median tensile strength values and median percentage of elongation at break values for Tyre 1
Similarly, the percentage of the elongation at break was also calculated (Equation 2) for each sample and the median value for the elongation was obtained for each tyre type.
When we consider the median tensile strength for the Control tyre samples obtained from Tyre 1, was 28.3 MPa and the median tensile strength for the Sample tyre 1 was 20.1 MPa. The percentages for the median elongation at break for Control tyre 1 and Sample tyre 1 were 240 and 224, respectively.
Similarly, Table 3 shows the tensile strength and elongation at break percentage for Tyre 2. When we consider Tyre 2, the median tensile strength for the control tyre samples obtained from Tyre 2, was 26.4 MPa and the median tensile strength for the Sample tyre 2 was 22.5 MPa. The percentages for the median elongation at break for Control tyre 2 and Sample tyre 2 were 235 and 229, respectively.
Table 3 Median tensile strength values and median percentage of elongation at break values for tyre 2

As given in Table 4, the median tensile strength for the Control tyre samples obtained from Tyre 3 was 28.5 MPa and the median tensile strength for the Sample tyre 3 was 19.9 MPa. The percentages for the median elongation at break for Control tyre 3 and Sample tyre 3 were 239 and 216, respectively.
Table 4 Median tensile strength values and median percentage of elongation at break values for tyre 3
3.1.3 Median applied force vs median extension curves
Figure 13 illustrates the variation of the median applied force under the increment of median extension for Tyre 1. As per the obtained trend of the curve, the median applied force was increasing while increasing the median extension for the sample. When the median applied force reached 310 N, Control tyre 1 obtained its median ultimate extension of 200 mm. Further extension caused the sample to break, as shown in Fig. 13. Sample tyre 1 achieved the highest median extension at 168 mm and the corresponding median applied force is 162 N, as shown in Fig. 13 below.
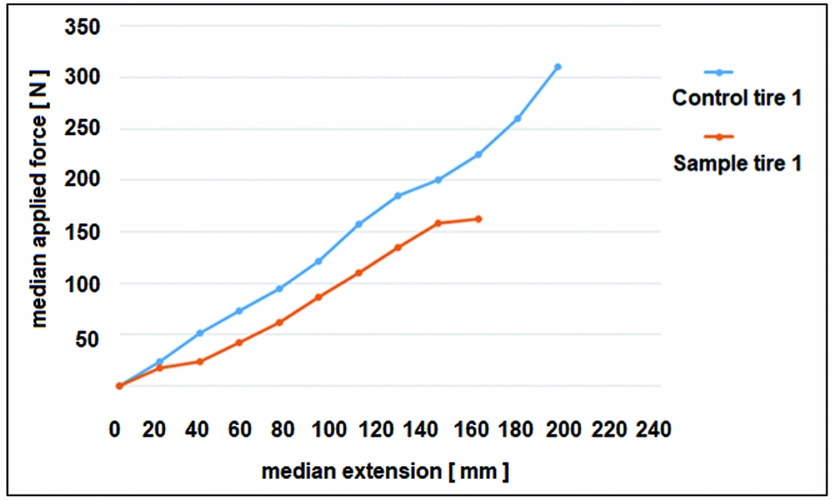
Figure 13. Median applied force vs median extension curves for Tyre 1.
Figure 14 illustrates the variation of the median applied force under the increment of median extension for Tyre 2. When the median applied force reached 255 N, Control tyre 2 obtained its median ultimate extension of 180 mm. Sample tyre 2 achieved the highest median extension at 168 mm and the corresponding median applied force is 150 N, as shown in Fig. 14. Further extension of the samples caused the tyre samples to break.
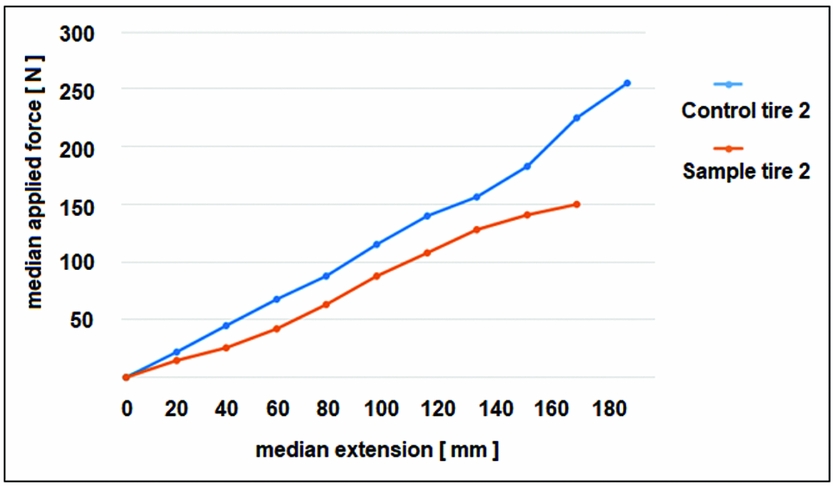
Figure 14. Median applied force vs median extension curves for Tyre 2.
Figure 15 below illustrates the variation of the median applied force under the increment of median extension for Tyre 3. When the median applied force reached 300 N, Control tyre 3 obtained its median ultimate extension of 200 mm. Sample tyre 3 achieved the highest median extension at 168 mm and the corresponding median applied force is 180 N. Further extension caused the tyre samples to break.
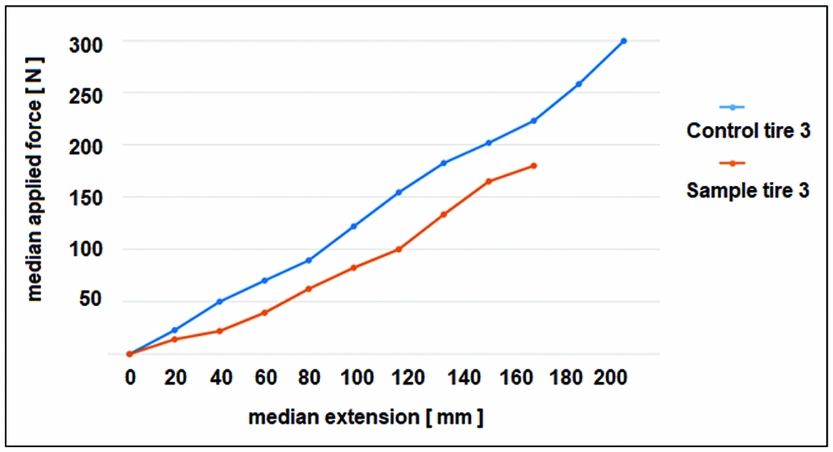
Figure 15. Median applied force vs median extension curves for Tyre 3.
3.1.4 Comparison of median tensile strength and median elongation
Figure 16 illustrates the summary of median tensile strengths achieved by tyre samples in each tyre type against the respective control tyres. But out of three Control tyre samples, Tyre 1 and Tyre 3 showed similar and the highest median tensile strength values compared with the Control sample in tyre 2. In addition, after the completion of 50 landings, the highest median tensile strength could be seen for Sample tyre 2 when compared with Tyre 1 and Tyre 3. Moreover, similar median tensile strength could be observed in Tyre 1 and Tyre 3 after the completion of 50 landings.
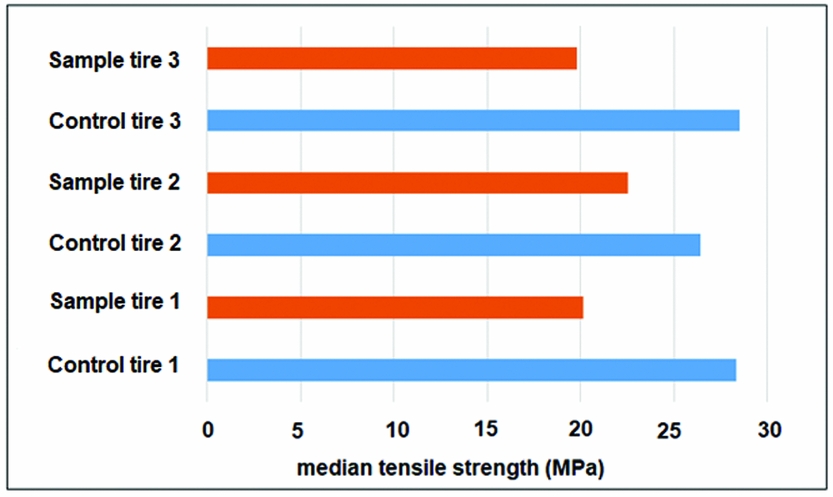
Figure 16. Comparison of median tensile strengths in each tested tyre sample.
Figure 17 shows the comparison of median elongation at break for each tyre type. The highest median elongation at break was reported for Control tyre samples when compared with tyre samples that had completed 50 landings.
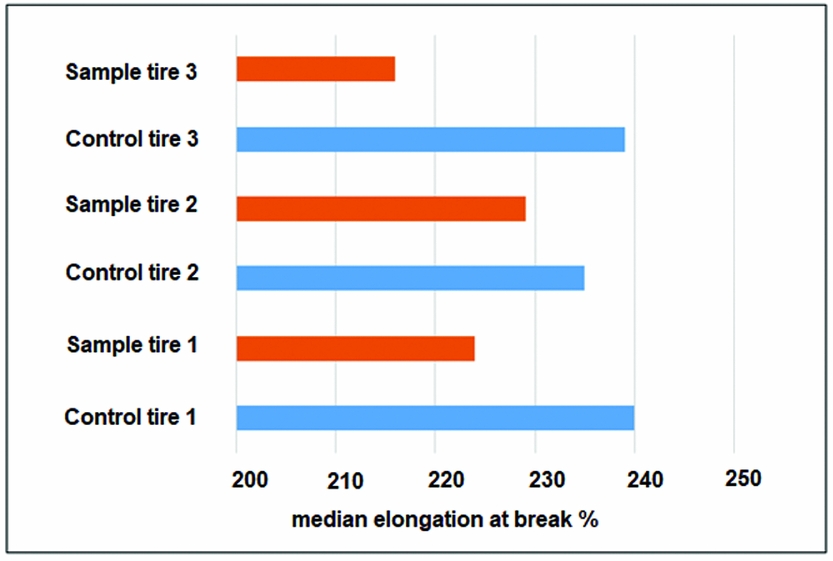
Figure 17. Comparison of median elongation at break for each tyre sample.
3.2 Abrasion test
3.2.1 Dimensions of the specimens for Abrasion test
Circular-shaped specimens (Fig. 18) were obtained from each tyre sample using a standard cutter. Hence, all the dimensions for 24 specimens could be assumed to be similar.
Figure 18. Dimensions of the specimen for Abrasion test.
3.2.2 Measurements for the specimens after Abrasion test
According to the data given in Table 5, the weight losses for the specimens obtained from Tyre 1 were calculated by considering the initial weight of each specimen and the final weight of each specimen after the Abrasion test was carried out. In addition, the rotational speed of the abrader machine was taken as 200 times/min.
Table 5 Weight loss of each specimen for Tyre 1 in Abrasion test
Based on Equation (3), the weight loss with respect to the reference material was calculated and the resulting values are shown in Table 5.
 $$\begin{equation}
\ Wrs = \left( {\Delta \ Ws/Wr} \right)\ \times 200\\
\end{equation}$$
$$\begin{equation}
\ Wrs = \left( {\Delta \ Ws/Wr} \right)\ \times 200\\
\end{equation}$$
 $$\begin{equation}
{\rm{Volume}}\;{\rm{loss}} = Wrs/D
\end{equation}$$
$$\begin{equation}
{\rm{Volume}}\;{\rm{loss}} = Wrs/D
\end{equation}$$
The mean density (D) for the tyre sample was taken as 1.1428 g/cm3 and the weight of the reference sample (Wr) was taken as 214.7 mg for the calculation. The ISO 4649 standard was followed even for the reference material.
By substituting the calculated values of Equation (4), the volume loss was calculated for each specimen and the mean volume loss was also calculated for each tyre type. Similar calculation method was applied for the data given in Tables 6 and 7 which are related to Tyre 2 and Tyre 3.
Table 6 Weight loss of each specimen for Tyre 2 in Abrasion test

Table 7 Weight loss of each specimen for Tyre 3 in Abrasion test
As given in Table 5, the mean volume loss for the control sample obtained from Tyre 1 was 128.05 mm3. The mean volume loss for Sample tyre 1 was 123.43 mm3.
As shown in Table 6, the mean volume loss for the control sample obtained from Tyre 2 was 128.35 mm3 and the mean volume loss for Sample tyre 2 was 124.53 mm3.
According to the Table 7, 128.08 mm3 of the mean volume loss was achieved by the Control tyre 3 sample while the corresponding Sample tyre 3 obtained 123.11 mm3 of the mean volume loss.
3.2.3 Comparison of the mean volume loss
According to Fig. 19, the maximum mean volume loss was shown in Tyre 3 and the minimum mean volume loss was observed in Tyre 2. Seemingly, Tyre 1 shows similar mean volume loss to Tyre 3.
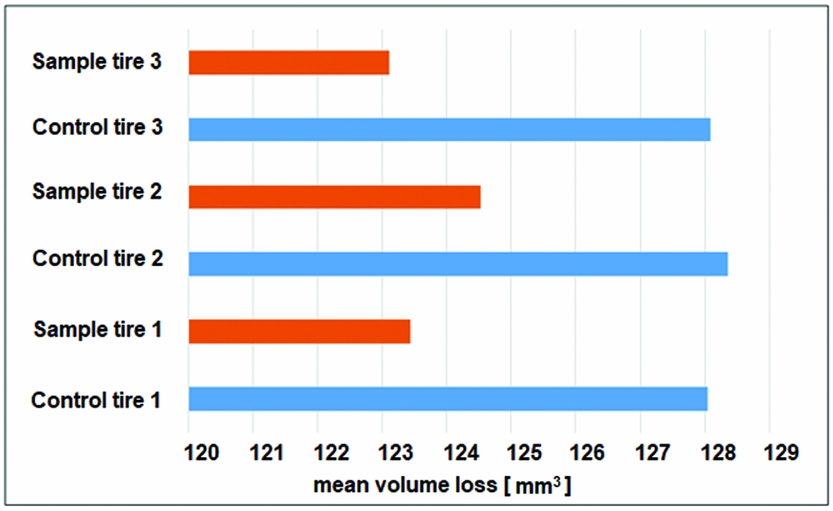
Figure 19. Comparison of the mean volume loss for each tyre type.
Figure 20 illustrates the percentage of mean volume loss in each tyre type compared to its Control tyre. Similar to the results obtained in Fig. 19, the maximum percentage of mean volume loss was achieved by Tyre 3 and it was 3.88% after the completion of 50 landings while the percentage of mean volume loss was 3.61% for Tyre 1. The least percentage of mean volume loss occurred in Tyre 2, which was 2.98% after 50 landings.
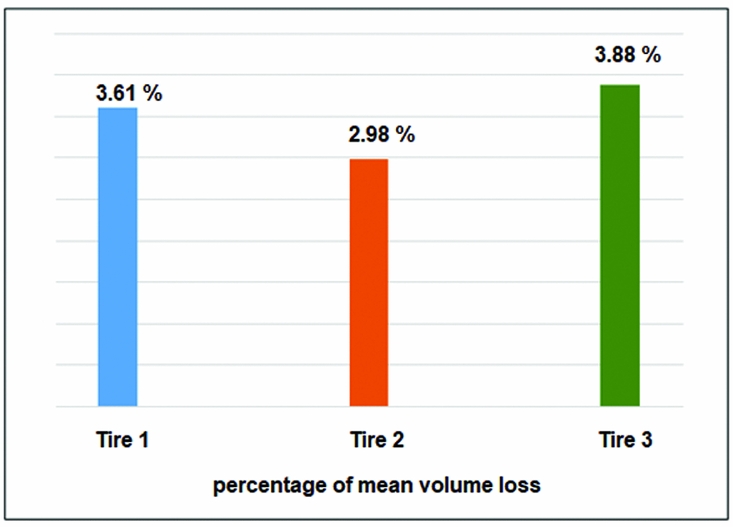
Figure 20. Comparison of percentage of mean volume loss.
3.3 Hardness test
3.3.1 Dimensions of the specimens for the Hardness test
As per ISO 7619-1 (2nd edition, 2010-10-01), the thickness of each specimen should be greater than 6.00 mm for the Hardness test. The average thickness for each tested tyre sample is given in Table 8 below.
Table 8 Thickness of tyre samples used for the Hardness test

According to the sample thickness values given in Table 8, all the sample thickness values were above the required minimum value for the thickness.
3.3.2 Measurements for hardness
As given in Table 9, the median hardness values of Tyre 1 was 61.5 Shore A for Control tyre 1 and 58.8 Shore A for Sample tyre 1. Similarly, the median hardness values of Tyre 2 was 59.2 Shore A for Control tyre 2 and 55.1 Shore A for Sample tyre 2. In addition, Tyre 3 demonstrated 61.7 Shore A median hardness values for its Control tyre 3 while Sample tyre 3 was measured at 58.6 Shore A hardness.
Table 9 Hardness values for each specimen and the Median Hardness values

3.3.3 Comparison of hardness
As shown in Fig. 21, hardness was dropped in all tyre types after the completion of 50 landings. However, the reduction of hardness in Tyre 1 and Tyre 3 looks similar.
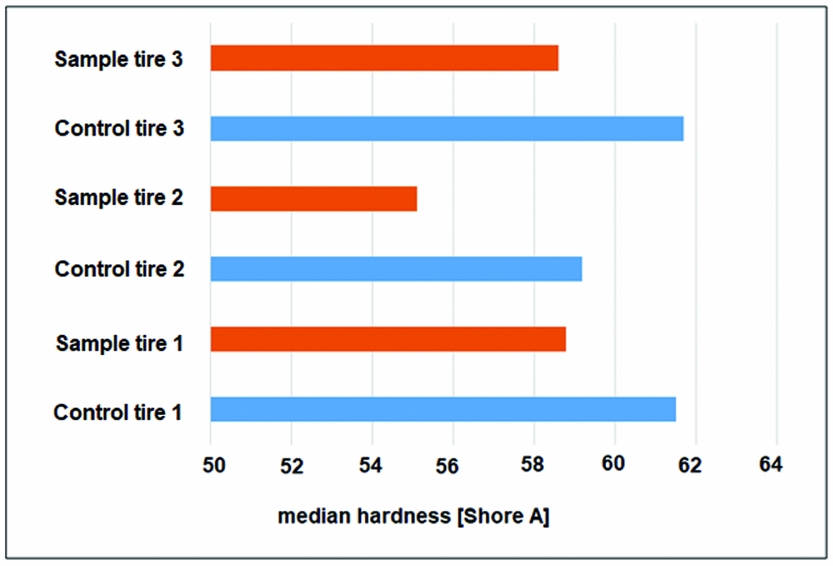
Figure 21. Comparison of median hardness in each tyre type.
Figure 22 shows the percentage of hardness reduction in each tyre type after the completion of 50 landings. The hardness reduction percentage was 4.4% for Tyre 1 and 5.0% for Tyre 3. The highest hardness reduction percentage was obtained for Tyre 2 with a value of 6.9%.
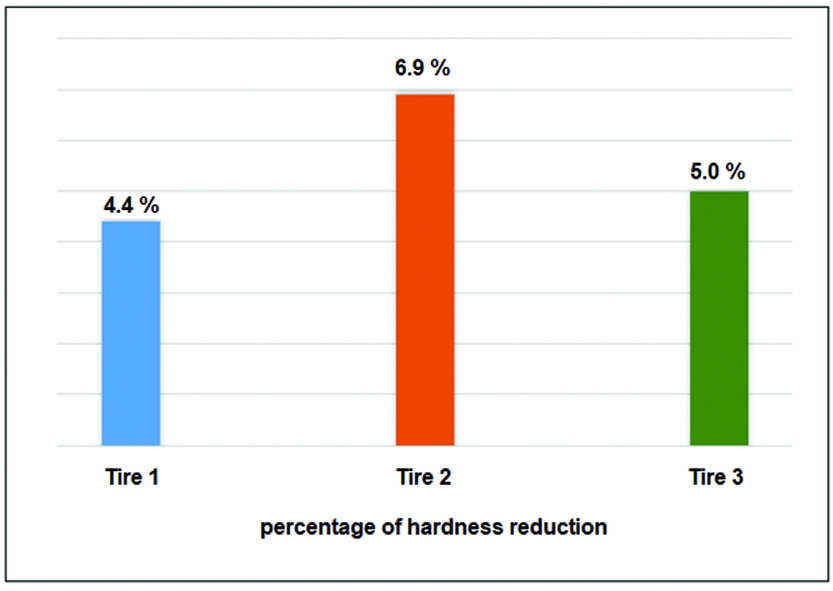
Figure 22. Comparison of percentage in hardness reduction.
3.4 Surface morphology of the samples
The physical appearance of the tyre samples was obtained using the Scanning Electron Microscope Hitachi SU 6600-Japan.
As shown in Fig. 23, there was a significant variation in the surface morphologies between the Control tyre sample and the worn-out tyre sample. The Control tyre sample showed smooth surface compared with the worn-out tyre sample.
Figure 23. Surface Morphologies of the tyre samples; (a) Control tyre sample; (b) Worn-out tyre sample 1.
4.0 CONCLUSIONS
This study is a novel empirical approach solely for the Y12 aircraft tyres. The outcome of this study will be important for engineering practitioners, tyre manufacturers and researchers. The engineers could carry out the relevant Non Destructive Test (NDT) to Y12 aircraft tyres after the completion of 50 landings in the absence of visible micro-cracks and recommend the tyres for further usage without discarding them. The outcome of this research will be useful for aircraft tyre manufacturers and researchers to further develop existing Y12 aircraft tyres thusly to withstand a higher number of landings in the presence of cyclic compressed/uncompressed loads, shear stresses and strains. This research work related to determine the variation of polymeric properties in Y12 aircraft tyres which is also one of the key factors in nonlinearity parameters that deal with the thermomechanical behaviour of aircraft tyres. Hence, this study fills the gap of finding the polymeric properties of aircraft tyres which will important in thermomechanical analysis of aircraft tyres(Reference Rafei, Ghoreishy and Naderi15). Three tyre samples were used for the experiment with one tyre from the nose wheel (Tyre 2), one tyre from left main gear (Tyre 1) and one tyre from right main gear (Tyre 3). There was a 29% of median tensile strength reduction in Tyre 1 and the reduction of the percentage of median elongation at was break reported as 6.6 for Tyre 1. The reduction of the percentages of both the median tensile strength and the elongation at break were 14.8 and 2.6, respectively, for Tyre 2. The median tensile strength reduction percentage was 30.2 for Tyre 3 while it recorded 9.6% of reduction of median elongation at break. As per the literature(16), the main gears touch down on the runway surface prior to the touchdown of the nose gear. The initial weight of the aircraft has to confront the main gear wheels(14). Hence, the reduction of the percentages of median tensile strength and elongation at break were higher in Tyre 1 and Tyre 3 compared with Tyre 2, as Tyre 1 indicates the left main gear tyre and Tyre 3 indicates the right main gear tyre. The reduction of the percentage of median tensile strength and elongation at break was lower in Tyre 2 which represent the nose-gear tyre as it has to tackle only 10–12% from the weight of the aircraft while the main gear tyres have to bear 88–90% of the weight(14). In addition, the percentage of mean volume loss were roughly similar in both Tyre 1 and Tyre 3, but those values were higher than the percentage of mean volume loss recorded for Tyre 2. These experimental results also concurred with the literature details as the nose-gear tyre has to bear the percentage of the lower amount of weight percentage from the aircraft compared with the main-gear tyres. Hence, the percentage of mean volume loss was higher for main-gear tyres compared with the nose-gear tyre. The highest percentage of hardness reduction was reported in Tyre 2, while other tyre types showed lower percentage of hardness reduction. The cross-section of the aircraft tyre consists with multiple layers(Reference Konde, Rosu, Lebon, Brardo and Devesa1,Reference Xie, Tang and Yao17) in order to make them more stronger. However, as the Y12 aircraft has a tricycle gear system, the main gear supports most of the weight; therefore, it is the strongest compared with the nose gear. The roll of the nose gear is to prevent the nose of the aircraft from tipping down as the centre of gravity is forward of the main gear. In addition, the diameter of the nose gear tyre is smaller than the diameter of the main gear tyres. Further, this smaller-diameter tyre has to bear 10–12% from the weight of the aircraft, which causes it to wear down sooner than the tyres in the main gears. This could be the reason to have a higher percentage reduction in hardness for Tyre 2 than Tyre 1 and Tyre 3.
As according to the SEM micrographs there is a significant variation in the surface morphologies of the control tyre sample and worn out tyre samples, where the control tyre sample has a smooth surface while the worn-out tyre sample has a rough surface.
5.0 SUGGESTIONS
Further, analysis could be done to identify the property discrepancies in internal layers as well.
ACKNOWLEDGEMENTS
The authors would like to express their gratitude to the General Sir John Kotelawala Defence University, Ratmalana, Sri Lanka for their support in characterizing the samples.


