The Naming of Cats is a difficult matter,
It isn't just one of your holiday games;
You may think at first I'm as mad as a hatter
When I tell you, a cat must have THREE DIFFERENT NAMES.
— T.S. Eliot, “The Naming of Cats,” 1939
The naming of things related to digital archaeology data is a difficult matter rarely explicated by textbooks or repositories. As an information scientist and data manager for the Chau Hiix Project in Belize, I consider the issues of data collection, management, and archiving through the lens of standardized vocabulary. The ultimate goal of archiving site data for validation through reproducible results or future repurposing is basically a problem of communication grounded in vocabulary.
As excavation begins, the archaeologist provides an analog description of their observations. Digital data may be born in the field or turned digital in the lab or during analysis. Digital files containing values and codes, named and organized into folders, represent the characteristics and survey locations of archaeological objects. Consistency in these alphanumeric representations is essential to data discovery for repurposing or reproducibility. Without standardized vocabulary, the researcher must perform three digital searches to collect data about those baked clay objects referred to independently as ceramics, pots, or sherds. Without consensus on how data are represented in the digital future, data validation and repurposing will be a frustrating endeavor leaving each project as a silo.
Chau Hiix is a small science project that has worked for the last 25 years to develop a comprehensive digital data archive for open publication. Digital technology, however, brings representation problems that were not required in analog recordkeeping. Data repositories tell us what types of files to create but not how to organize and name the data within. How are filenames and object names standardized; how are location schemes constructed? The following description of the Chau Hiix solutions provides an example of a simple, spreadsheet-based data collection plan and how names were created for the objects, locations, and files.
DATA MANAGEMENT PLANNING
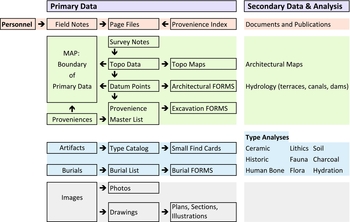
Data repositories such as the Archaeology Data Service (ADS) (2011) and the Digital Archaeology Record (tDAR) (Digital Antiquity 2013) advocate that a data management plan be developed at a project's inception and provide best practices and guidelines for data deposition. The repositories guarantee that if you follow their format requirements the data will be migrated and accessible for future scientists who may be using digital analysis tools such as geographical information systems (GIS) or computer-aided design (CAD). Projects incorporate repository format requirements as they operationalize the research design into a data management plan. As archaeology moves into a completely digital environment, how digital data are organized and represented within those formatted files is the first step: the data collection plan (Figure 1).

FIGURE 1. Overview of Chau Hiix data collection.
The data collection plan describes the words or numbers used to represent the data. This includes the terms used for each material type, how survey codes represent location, how photographs are named to indicate represented objects, how personnel information is managed, and more. The plan also documents how file naming, version control, and backups are handled during data collection and building the archive. The files themselves are formatted according to the repository requirements, guaranteeing access and migration. Data inside the files, however, are discoverable and comparable due to content that reflects standardized terminological representation.
Chau Hiix Digital Data Collection Plan
Chau Hiix is a Maya site located on a seasonal lagoon in the jungles of Belize. The research design focuses on intersite political relations to test competing models of ancient Maya political economy using complementary lines of evidence: area populations, agricultural features, Postclassic settlement, and a long-lived civic center (Andres Reference Andres2005; Andres and Pyburn Reference Andres, Anne Pyburn, Demarest, Rice and Rice2004; Cook Reference Cook1997; Cuddy Reference Cuddy2000; Goldsmith Reference Goldsmith2006; Pyburn Reference Pyburn2003, Reference Pyburn, Marcus and Sabloff2008; Wille Reference Wille2007; Wrobel Reference Wrobel2003). This research design challenged the data access status quo by needing primary data for intersite comparisons, not the results of analysis that are found in journal publication. In addition, this research design calls for a broad range of expertise: geophysical surveyors, ceramicists, lithic experts, osteologists, hydrologists, epigraphers, etc. The list of specialists involved in a single investigation is ever increasing, as is the specificity of their language (Beebe Reference Beebe, Barcelo, Briz and Vila1998).
To fulfill the research design, data collection and the management plan had to support data sharing across projects and a desire to make the primary data available for the next 100 years. Taking the very broad view that alphanumeric strings represent all data, building the digital Chau Hiix archive (CHARC) was approached as a problem of standardized representation. Being a small science project with basic digital technology expertise and limited finances, a bottom-up organization was developed based on the concept of Occam's razor: keep it simple. Thus, ASCII and TIF were selected as the basic archival formats.
The CHARC digital collection process began in 1996 as ADS was developing in England. The Archaeology Data Archive Project (ADAP) (Eiteljorg Reference Eiteljorg1994), an ADS precursor in the United States, was publishing technology documentation that remains today a comprehensive introduction to digital archaeology (Eiteljorg Reference Eiteljorg2008) and highly educational for a deeper understanding of applied technologies. At the same time, GIS software was migrating from arcane mainframe programs to desktop software, making it more accessible. The ability to import Chau Hiix primary data into GIS systems was identified as a goal for the analysis phase.
CHARC data are represented in spreadsheets, scanned versions of all primary notebooks, and thousands of well-pruned digital images, all documented in content-related README.txt files. Excavation activity at Chau Hiix ceased in 2007. Work on CHARC continues, however, to create the repository version: digitizing legacy data from 1990–1995, error checking, and the final pruning of redundant files. Having monitored current repository guidelines, the data will then be ready for deposit and the 100-year access goal.
Digital Text, Spreadsheet, or Database?
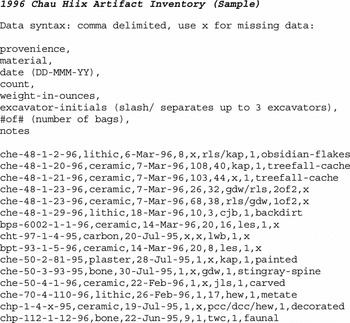
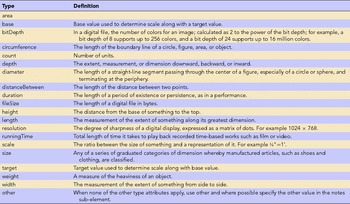
Chau Hiix data collection involves collecting and maintaining data both in physical and digital form. Physical data consists of collected artifacts and field notes from excavators and surveyors. Digital data consists of spreadsheets for artifact inventory, survey points, personnel data, digitized field notebooks, and digital images. While the physical data is most valuable, issues of preservation and accessibility limit its potential shareability. The digital record provides for sharing Chau Hiix data both today and in the future through global digital repositories. Prior to 1996, Chau Hiix recordkeeping was on paper with pencil. Digital data collection began when a computer-typed record replaced pencil and paper, thus exchanging penmanship readability with typing errors. These first Chau Hiix digital records were keyed into a text editor, creating text (TXT/ASCII) files, the selected archival format. Data were entered in this text file with a documented comma-delimited syntax (Figure 2), mimicking the .CSV spreadsheet output format of today.
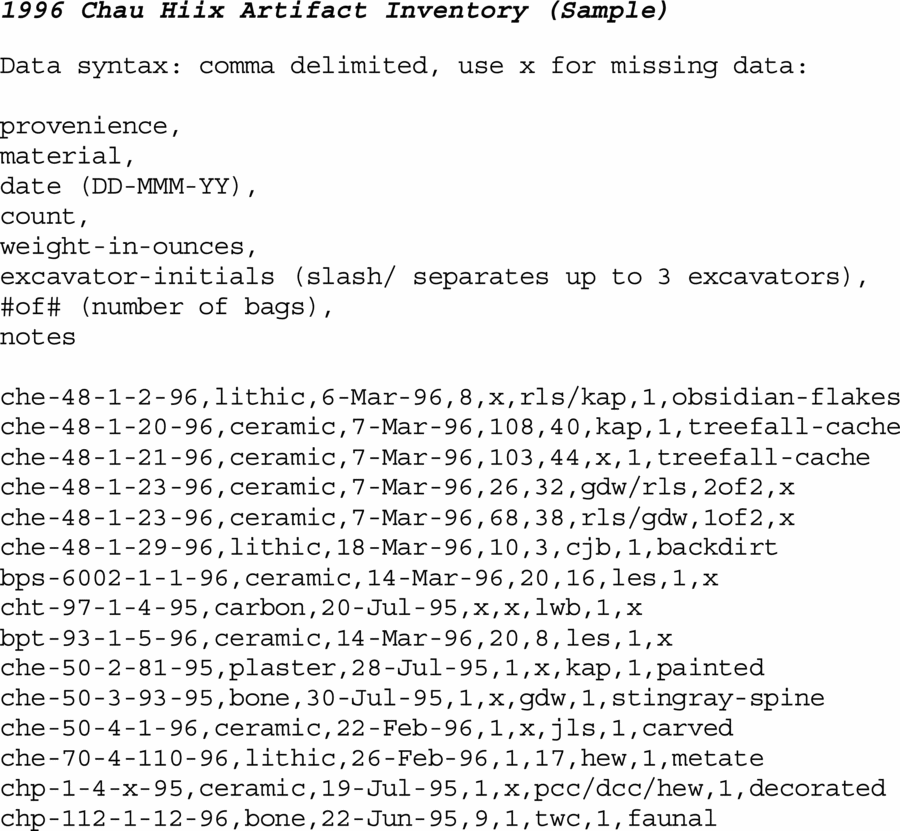
FIGURE 2. 1996 Chau Hiix artifact inventory (sample).
In 1996 it made sense to use a text editor to begin the Chau Hiix digital record due to software costs, lack of application expertise, and even lack of typing skills. By 2003 the technology skills of project personnel had standardized, software was more prevalent and affordable, and operating systems were more user friendly. Data entry was done directly into a spreadsheet. The lab manager had to constantly monitor the staff with greater spreadsheet expertise, as they would make changes to the default spreadsheet settings to facilitate easier data entry, such as turning on auto-complete for cell values. The next person, with perhaps less experience, would not notice any auto-complete errors they were making. At the end of the day, the spreadsheet was checked for errors, exported into a comma-delimited ASCII file, both spreadsheet and ASCII files were copied to multiple external devices, and ASCII files were printed as an archival-backup version. That backup system continues today as CHARC is finalized for a repository.
During the years of digital data acquisition at Chau Hiix, there was an ongoing discussion about using a database instead of either a text editor or spreadsheet. Some small projects with technically savvy principal investigators, and many large well-funded projects with technology support staff, were developing database systems for managing their data. Technically savvy Chau Hiix students and staff offered to build databases for the project. But none of the core, permanent staff had the expertise to maintain, modify, or migrate a database for ongoing use over two decades of excavation. If a relational database system is not developed with excellent documentation and a regular maintenance plan, the data are in danger of becoming irretrievable. The risk of losing data, whether by lack of maintenance or data migration, is exemplified and well documented for the Newham Archive and others (Simpson Reference Simpson2004). Developing, maintaining, and troubleshooting a relational database requires technical expertise and regular attention. Chau Hiix chose a simple spreadsheet system with ASCII backups.
Prior to each field season, as project finances and expertise were evaluated, the same decision was made: spreadsheet data recording was more than adequate for field data acquisition, data-entry errors notwithstanding. Once documented and error checked, field data would never change. Therefore, ongoing change management as afforded by a relational database, was deemed unnecessary. It was also determined that the ASCII format was still the best archival format for data preservation. For a publishable archive of ASCII primary data, a relational database was not necessary.
A spreadsheet is basically a single table database with rows (records, entities, or elements) and columns (fields or attributes), often referred to as a flat-file database, like a phone book. All the data contained in a spreadsheet can be exported as a text file, with each row on a line and related column data separated by a delimiter, such as a comma, separating the column values, effectively the same as Figure 2. For field archaeology recordkeeping, the spreadsheet is easy to create and tracks the simple lists of data being generated: what is found, where, when, and by whom.
While many projects now use relational databases in the field to manage their data collection, its advantages of managing changing data and multiple user access are not always essential in the field. Since archaeology records are never updated once free of data-entry errors, a small group of spreadsheets has continued to be an acceptable tool for data collection management. The spreadsheets form the foundation for potential data import into a relational database during analysis.
DESIGNING SPREADSHEETS AS DATA MODELING
The concept of data modeling describes the same process archaeologists engage in when planning for data collection in the field. For those with little database expertise, texts such as Sanders (Reference Sanders1995) or Carlis and Maguire (Reference Carlis and Maguire2001) make data modeling accessible. It is like indexing and involves identifying entities (things with related properties), attributes (the properties), and the relationships between the two.
Data modeling can also be understood as an exercise in building a research design–specific ontology (Gruber Reference Gruber2007); that is, a catalogue of the things shared in a domain and particular context, and the relationships between those things. CHARC constructed four basic spreadsheets:
-
• Personnel (with cross-reference to field notebooks)
-
• Survey (points, activity proveniences, descriptions)
-
• Proveniences (excavation activity list, administrative information)
-
• Artifacts (general artifact inventory, small finds identification)
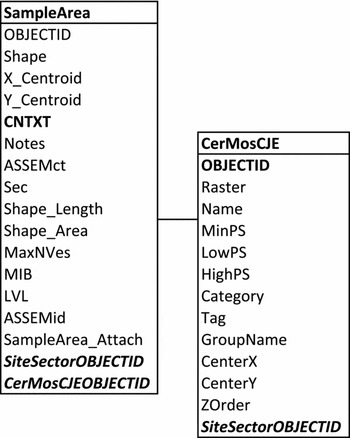
For each spreadsheet (Figure 3), column headings are spelled out and include the syntax when appropriate. When journal articles publish relational database schemas without documenting the attribute codes, the relationships between different tables are often too cryptic for the reader to understand or use as a model (Figure 4).

FIGURE 3. Chau Hiix data collection basic spreadsheets with colors indicating data redundancies.

FIGURE 4. Example of a relational database schema derived from Sharp and Litschi (Reference Sharp and Litschi2014:Figure 3).
Data Redundancy as a Spreadsheet Strategy
Before addressing the details of specific spreadsheet attributes, note the data redundancies in Figure 3. Row 1 indicates redundant “year” information across the spreadsheets. In row 2, the “initials” field of the personnel spreadsheet serves as a look-up for the initials recorded in the other three spreadsheets. In row 3, each provenience record is placed in the geophysical survey context through its unique point number. In rows 4–8 every artifact record is connected to a provenience record, which in turn is connected to a survey point. Notebook-number in row 7 links a specific provenience to the field notes of the assigned excavator. Note the bold text in rows 8–9, which indicates the need for controlled vocabulary.
Data redundancy is a strategic principle for Chau Hiix data collection. There is no data redundancy in a relational database, so when a piece of data changes, such as a customer moving to a new address, it is changed in only one place. Since the primary data in archaeology will not change over time, it turns out that during data collection spreadsheet redundancy is a positive situation. At the analog data collection stage, where artifacts are being dug from the ground, placed in bags, processed, and conserved in the lab, there are multiple opportunities for recording error before the digital record is created. These early, non-digital recording errors do not become evident until sorting the digital record.
The spreadsheet sorting tools readily identify data consistency problems. Consider the redundancy of “year” in each spreadsheet. Chau Hiix had a backlog of artifact accessioning due to the volume of material recovered each year. Each season, data recording staff would have to pay close attention to the specific year on the bag/lot being accessioned. Errors easily happened. Data-entry errors were confounded by excavator error when writing the provenience number on the artifact bag or overfilling the bags. In the lab, overfilled bags were re-bagged in manageable sizes, creating another opportunity for pre-digital data-entry error.
Excavator initials represented those making the actual data discovery choices. The lead excavator often had their crew take responsibility for collected material; thus, there would be multiple initials on each bag. Crewmembers were inconsistent in the recording order of initials and redundancy across spreadsheets allowed for clarification when researching field notes for discrepancies.
The redundancy in the data representation and entry process has made it possible to do error checking when there is an information discrepancy between the physical artifact, the notebook references, photographs with incomplete provenience references, lost surveyor locations, and even which staff were on site any given year. Redundancy across spreadsheets thus supports a chain of evidence model; that is, a digital archive containing the record of all activity, from the moment the earth is disturbed, through all stages of processing and analysis, until the resulting information/data is deposited in the final, publishable archive. At that point, data redundancy can be removed only if it served the archive-building and error-checking process.
Survey and Provenience Spreadsheets
Taken together, the survey and provenience spreadsheets are at the heart of data collection for a given research design. The research design identifies what to look for, the survey identifies the real-world context, and the provenience designation documents the specific activity locations. The surveyor performs the topographic survey, identifies geophysical features, and assigns each feature a unique number. When the project director assigns an activity number (provenience), the surveyor ensures that there is also a geophysical designation with a datum point. For the Chau Hiix project, all activity, material, and documentation are tied to the survey through the provenience designation. Every provenience number refers to a specific location. Every object removed from an excavation activity, either on or within the earth, is assigned a provenience number. In the case of “small finds” (objects of special interest such as complete vessels, jade, shell carvings, etc.), the provenience number is written directly on the object.
Provenience Numbers
The survey data begins a chain of evidence that links all other data through a well-constructed provenience numbering system. The provenience number is made up of six parts: location, activity type, activity number, operation, context, year (see examples in Figure 2). The general site location accommodates the issue of outlier areas of interest that are not contiguous with the area of focused activity. CH represents the main site, but to determine activity relationships there were several surveys, surface collections, and test pits in more remote areas, outliers such as Ben's Pass (BP).
There are four activity types: surface collection, posthole, test pit, and excavation. The surface collection (S) is either an area or a point provenience for any surface collected artifacts. There were several investigations that involved postholes (P), and this also accommodated any postholes created to construct buildings or living quarters. Test pits (T) were defined as preliminary investigations no larger than 1 × 1 m. Anything larger was considered a full Excavation (E). Each activity (E, T, P, or S) was given a unique number assigned by the lab manager. Activity numbers are never repeated and are tied to a specific datum as provided by the surveyor.
The operation number for each activity is a sequential number beginning with one (1). If an activity in a specific location spans more than one year, the second year becomes operation two (2), as when an excavation is reopened in another field season. Within each field season there is always the potential that a specific activity needs to be expanded from its initial size designation. In that case the expansion becomes a new operation number. For example, in 1994, excavation CHE-50 operation 1 (CHE-50-1) began in the main pyramid. In 1995, CHE-50 was reopened and designated CHE-50-2. A tomb was discovered but the crypt extended beyond the confines of the excavation shaft. Therefore, a new operation was opened, CHE-50-3, and a contiguous shaft was excavated until the crypt was reached. So, an operation number represents activity in a specific location, or contiguous locations, but is not necessarily tied to year. The redundancy of the year component helps clarify recordkeeping errors.
The context number is assigned by the excavator and can be used to identify material or features. For example, in CHE-50-2 the initial observation of the crypt was given its own context number, CHE-50-2-45. The meaning of the context number is documented in the excavator's notebook. The excavator may ask the surveyor to point provenience any given context. The surveyor shoots a point with a unique point number and uses the provenience number as the description.
Finally the provenience number ends with a two-digit year designation. Again, the redundancy helps with error checking and maintaining the chain of evidence.
The Problem with Features
Informed by the research design hypothesis, the archaeologist selects a specific x-y-z location in the world to excavate. As the digging begins, the excavators record their observations. These observations, however, are biased interpretations based on knowledge and experience. The more complex the area of excavation, the more interpretation can come into the observation record. An uncovered layer of broken pottery could be interpreted as “features,” such as the top of a midden, an indication of a hearth, burial goods, or simply a random broken pot that in later analysis indicates the presence of manufacturing. All are viable potential interpretations that must be considered in order to inform the ongoing observation and excavation technique. At what point does the observation (primary data) become interpretation (secondary data)? Each investigator must decide that for themselves, yet the recordkeeping system should be as focused on the primary data as possible.
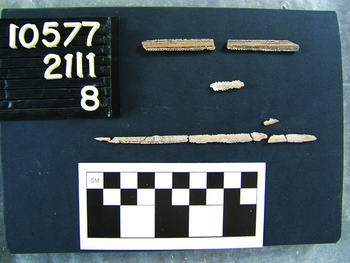
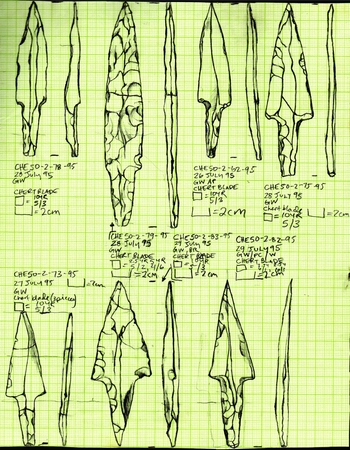
The key to the Chau Hiix provenience representation system is that all observations and material are given individual provenience numbers, since the concept of “feature” is considered a construct of the excavator and represents an interpretation that may or not prove valid in the future. With individual proveniences, collected materials can be grouped and regrouped as more observations occur over multiple operations. For example, after the burial recovery in CHE-50-2 and CHE-50-3, it was discovered that there was an even earlier burial underneath. Initial field assumptions assigning grave goods to specific burials were corrected during the analysis phase. Burials are recognized as a “feature,” but all associated materials are catalogued as independent objects. Since every artifact has its own number, it is easy to construct and deconstruct features or assemblages (Figure 5). In the CHE-50-2 crypt example, the 12 blades beneath the skeleton were each given individual context numbers (Figure 6). Features and assemblages do not fit the concept of Occam's razor and thus are minimized in the primary data by assigning individual object provenience numbers.

FIGURE 5. Post-collection assemblage of stingray spines with small find numbers.

FIGURE 6. Tomb 1 lithics with individual context numbers.
Not every artifact receives its own number. Excavators must still make field determinations about what data should be treated as a single piece of information. For example, artifacts in a midden that were deposited as a single event may be given a single provenience. Diagnostic artifacts from such contexts may be indicated with the addition of a small find number that becomes an additional data point in the artifact spreadsheet.
Ultimately, the purpose of this simplified notational system is to make the data as amenable as possible to reanalysis by future researchers. The aim is to reduce the number of assumptions made about an assemblage at the time of recovery that cannot be altered later, and to ensure that the assumptions that were made are explicit so that limits to possible reanalysis of the assemblage are clear.
Artifact Spreadsheet
The artifact spreadsheet is the inventory of collected materials. In the field, the excavator puts collected material into bags separated by material type. Bags are labeled with provenience, excavator initials, and date and sent to the lab. A given context may have just a single ceramic piece, or there may be so much ceramic material that it fills multiple bags. In the lab, each bag is considered to be a data record in the spreadsheet. Every artifact data record is assigned an arbitrary, unique accession number. This number supports analysis phase logistics when there are multiple bags from a single context: some contexts generated hundreds of individual ceramic pieces. Bag numbers help relocate specific pieces in the physical collection. Accession numbers facilitate analysis by multiple analysts, supporting bag for bag interpretation comparisons.
Note the redundancy in the fields “date-collected” and “provenience-year.” While the date-collected field could serve as the data access point for “year,” the inclusion of the “provenience-year” field allows for the collocation of artifacts from different collection dates and contexts in order to create assemblages.
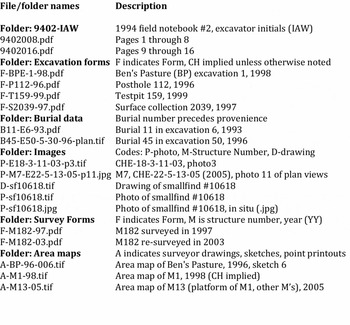
FILENAMES
Before determining the values that populate individual spreadsheet cells, consider how the provenience number can be used to name and collocate the many digital files that are created during data collection. Names are needed for directories, folders, documents, and artifact images. The computer processes these names as an alphanumeric string and is not concerned with whether filenames are meaningful or non-meaningful. Non-meaningful filenames are unique random numbers that reference each file, such as the names generated by digital cameras. These are not user-friendly when contemplating a directory structure and require a file management system that is easily managed with a relational database but difficult to establish with a spreadsheet.
Meaningful (descriptive) filenames allow the researcher access to data by browsing. Repositories are clear about the structural format of filenames: characters A–Z and 0–9, no spaces, etc. However, there are no examples and little guidance for how meaningful names are actually constructed (e.g., Burke et al. Reference Burke, Smith and Zimmerman2009 or Lloyd-Smith Reference Lloyd-Smith and Femenías2016). Meaningful filenames might include date, location, excavator initials, or any of the fields in the CHARC spreadsheets. CHARC uses the provenience number as the starting point for file naming (Beebe Reference Beebe2010) so that data can be assembled and reassembled based on this most basic attribute that links all other data and begins the chain of evidence.
The filenames for Chau Hiix excavation and survey forms, images (photos, drawings), burial data, etc., all include the provenience number, either partial or complete, depending on the level of reference required (Figure 7). Burial, structure, and small find numbers serve as provenience shorthand for a specific object or location. Within each directory folder, therefore, the files are sorted by provenience. Thus, during analysis, the spreadsheets can be sorted by the attribute of interest, and then the associated provenience value is used to locate specific files.

FIGURE 7. Implementation of CHARC filename system.
CONTROLLED VOCABULARIES
Consistency in the alphanumeric strings that constitute the values in each cell of a spreadsheet is at the heart of data representation in this simple, spreadsheet-based data collection plan. These consistent alphanumeric strings take the form of controlled vocabularies, such as provided in the Art & Architecture Thesaurus (AAT) (2015), or the prescribed type of numeric values. In the broadest sense, the allowable form of a numeric value can be considered a type of controlled vocabulary. Having control over these alphanumeric strings is essential when working with spreadsheets. It facilitates the search and discovery process, as well as the organization of files with meaningful names.
Personnel Spreadsheet
Consider how the personnel spreadsheet (Figure 3) exemplifies a basic tenet: every cell contains only one piece of data. In spreadsheet practice, the name of each person is represented in three separate fields: first, middle, and last. It is commonly understood that entering first-middle-last name in a single cell will result in a sorted list of all the John or Mary names grouped together, which is less useful than a Smith (John) and Smith (Mary) grouping. Note that in the “home” field, the three pieces of data are grouped together with a slash (/) delimiter and a required ordering. This exemplifies a controlled shortcut for entering data in the field. The personnel “home” data is not essential for fieldwork, but using spreadsheet tools the delimiter allows for expansion into three columns for the spreadsheet's final archival version.
The “status” and “job” fields exemplify the need for controlled vocabulary. Since the Chau Hiix project has spanned more than 25 years, keeping track of personnel and their status at the time of project participation became an issue. The evaluation of notebook data and observations might be impacted by knowing that undergraduate student A in 1996 participated as a graduate student in 1998, as a PhD candidate in 2000, and a professional archaeologist in 2005. Similarly, after 25 years and hundreds of participants, being able to sort by various jobs was helpful when considering specialists to contact.
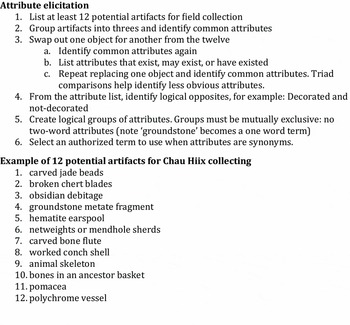
Facet Analysis
The personnel job field exemplifies the result of facet analysis to generate the controlled vocabulary for the job attribute (Figure 8). A facet analysis is a bottom-up categorization method (Hedden Reference Hedden2016; Ranganathan Reference Ranganathan1967) that considers what exists in a collection (or ontology), analyzes the component parts (characteristics), groups the components into related categories, then establishes relationships both between and within the groups. This is in contrast to an enumeration method that attempts to list all possible groups that exist, have ever existed, or may exist. A faceted scheme is initially not hierarchical, so it easily allows for the addition of new attributes or values. A well-constructed faceted scheme builds as need arises. Enumeration, as a top-down method, requires that all categories preexist, thus when a new category emerges there are problems putting it into the scheme. For example, the Library of Congress Classification (LCC) scheme is enumerative in that it provides for every book to have a call number that places that book on one and only one shelf location. When “computer science” emerged as a discipline in the mid-twentieth century, it was forced into the LCC class “QA Calculating Machines,” which was a subclass of mathematics (Miksa Reference Miksa1984:65).
FIGURE 8. Controlled vocabulary for personnel job and status.
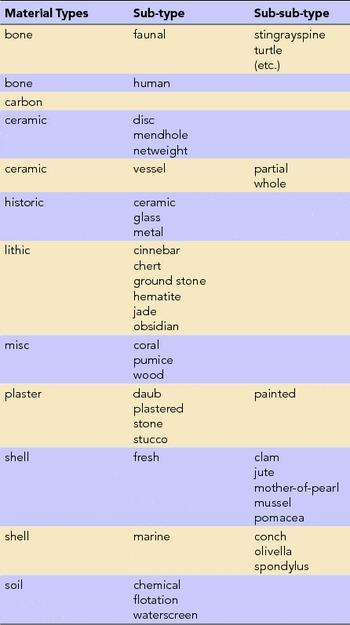
Rather than anticipating and enumerating every possible personnel job, the existing jobs were grouped and their characteristics identified. Characteristics were then grouped into categories that could be applied to multiple jobs. For example, rather than enumerating every possible excavator job (e.g., main site excavator, settlement excavator), the main concept is excavator and is qualified by location terms (Figure 8, List 2). This not only allows for a person to be a general excavator in multiple locations, but it also provides for the addition of other locations as qualifiers, should that situation arise. This is basically the same approach used in data modeling (Sanders Reference Sanders1995) and was applied later when developing material types (Table 1).
Table 1. Vocabulary from Facet Analysis of Material Type.

Both spreadsheets and relational databases allow for facets to be combined in various orders depending on the researcher's focus. In the CHARC artifact spreadsheet, the ceramicist sorts by material type first and then considers all the other fields (columns). Someone studying burials might sort first on small find number in order to get a subset of grave goods. The enumerative approach is to lump artifacts together under the feature concept. The faceted approach splits feature objects into individual representations for collocating later based on expert analysis. The artifact spreadsheet collects feature interpretations in the “field description,” but multiple interpretations are facilitated by the individual representation of every object.
Two other values used facet analysis to determine controlled terms: survey codes and material types. Problems establishing survey codes and syntax are documented elsewhere (Beebe Reference Beebe, Barcelo, Briz and Vila1998) but resulted in a simple list of elements (topo point, station point, mound number, provenience number) with sub-attributes of either “datum” or a directional reference (NE, SE, SW, NW, top, center, bottom). Descriptors were added to indicate feature interpretations (e.g., aguada). The problem of multiple parts to a “building” was addressed in the same way as any feature. Each part was given its own M-mound number, so as investigations progressed complex structures could be created out of the component parts, assigning a new M#. Flood et al. (Reference Flood, Johnson and Sullivan1989) provide more details for exploring survey description methods.
Prior to developing material type terms, the example of 12 artifacts in the facet analysis exercise (Figure 9) exemplifies the “field description” in the artifact spreadsheet. The field descriptions proved impossible for sorting, as did uncontrolled material names. For example, when the lithic analyst sorted the inventory, she had to look at groupings for G-groundstone, H-hematite, O-obsidian, C-chert, and J-jade. The controlled vocabulary (Table 1) that evolved from the materials facet exercise resulted in the use of the general term lithic, with groundstone, jade, and chert as a subset of mutually exclusive terms.

FIGURE 9. Facet analysis for material types.
Data attributes fall into three basic categories (Table 2): physical, conceptual, and contextual (Beebe Reference Beebe2006:4). Physical attributes are the focus of data repositories and include both administrative (e.g., access rights, repository, copyright, file type) and biographical characteristics (e.g., excavator, site). Conceptual are both naming (e.g., lithic, ceramic) and interpretation (e.g., ear-spool, metate). Contextual provides for the relationships among objects (e.g., cooking, debitage type).
Table 2. Attribute Types and Metatdata Scheme Crosswalk.

Conceptual and contextual attributes use controlled vocabularies as attribute values. CHARC relied on material type analysts to develop interpretation and contextual attributes, though excavator interpretations were captured in the field description. These were often corrected or clarified by the material specialist in the analysis phases. Analysis vocabularies are for item-level description and access. The AAT exemplifies a controlled vocabulary that could initially be used for archaeology, the lack of archaeological detail notwithstanding.
The AAT is a facet-like thesaurus that holds potential for item-level description but lacks the breadth and depth required for archaeological items. For example, the AAT has no terms for describing the details of a biface such as bi-pointed, macro-blade, or eccentric. Analysis level vocabulary is a starting place in archaeology for material specialists to build standardized vocabulary. The Archaeologist's Fieldwork Companion (Kipfer Reference Kipfer2007) provides preliminary vocabulary lists, some faceted, some enumerative, and some needing to be processed into facets or hierarchies.
In practice, most classification systems are a combination of enumerative and faceted categorization. Facet analysis creates subtypes that provide for various combinations of attributes. The facet structure results in attributes and values that can be ordered (enumerated) for a particular focus of research; for example, the sorting order used in the spreadsheet.
Attributes as Metadata
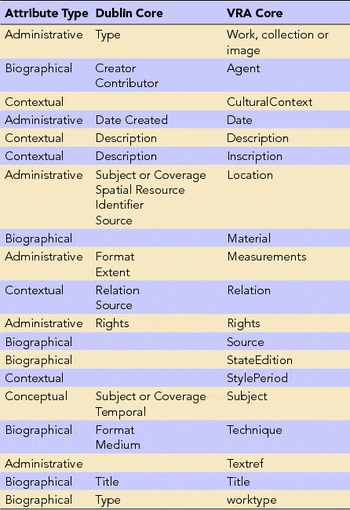
Metadata is a structured representation of information types that facilitates retrieval. Metadata uses ontologies to describe things. Dublin Core (DC) (2015) and VRA Core (Visual Resource Association 2007) are ontologies with metadata schemes composed of the three basic attributes. DC was designed as the minimum set of attributes for representing an object in the digital environment (Clarke Reference Clarke2015:Table 1). While DC is for general resources, VRA Core is specialized for images and cultural resources. Both emerged in the mid 1990s, VRA forming core elements that crosswalked to DC (Table 2). VRA recognized special needs with regard to locating and describing visual resources. For example, the three panels of Monet's triptych Agapanthus are located in three different art museums: St. Louis, Kansas City, and Cleveland. DC did not accommodate such a collocation problem. This is similar to archaeology's issues with features and assemblages. Consider, also, VRA's expansion of the DC Extents element to VRA's Measurement element with attributes more specific to image needs (Table 3).
Table 3. Definitions for the Measurement Element from the VRA Core.

For archaeology, the elements required for the tDAR repository serve as a specific instantiation of Dublin Core. tDAR documentation on creating and editing resources provides for the creation or import of ontologies as well as adoption or crosswalking to ontologies already deposited by other projects. These crosswalk opportunities facilitate the research community building ontologies with shared attributes and values from the bottom up, in the fashion of facet analysis. A focused effort by the domain of archaeology at this level of terminological standardization would facilitate item-level discovery and eliminate the need for each individual researcher to create vocabularies or crosswalks.
As individual archaeologists embrace the need to curate their digital data and the structural requirements for data reuse, consideration should be given at the data collection planning stage for the ontologies, attributes, and controlled vocabularies that will be needed. Kulasekaran et al. (Reference Kulasekaran, Trelogan, Esteva and Johnson2014:61) explored a metadata model for archaeology to illustrate “that DC metadata can act as an integrative platform for a non-traditional (but increasingly common) researcher-curated, distributed repository environment.” CIDOC CRM Core emerged in 2006 as a standard for semantic interoperability in a broadly defined cultural heritage domain (International Committee for Documentation 2006). CRM-Core (Conceptual Reference Model) is an ontology with an extensive set of entities, is based on the attribute of “event,” and can be crosswalked to DC. VRA Core and CRM Core are both at the foundation of ArchaeoCore (2015) emerging in the art domain (Berenz et al. Reference Berenz, Burns and Wall Stylianopoulos2013). Archaeologists might consider adapting and adopting this effort.
THE CHARC EXAMPLE
The CHARC data collection plan (Figure 1) demonstrates the functionality of simple spreadsheets. Spreadsheets are easily maintained, require minimal technology skill, and are affordable for small science projects. When relational database training and technology become as easy to use and ubiquitous as word-processing, then the data management plan can begin with a relational database tool. Any database tool, whether flat or relational, begins with the same problems of data communication outlined here in the data collection plan.
Communicating for future digital data sharing is a problem of vocabulary and organization. While resources and repositories call for organizational structure and naming conventions, the Chau Hiix vocabularies and provenience number provide an example of data representations. There is no “right” way to organize or represent data. A representation must reflect the scope of the content and the objectives of the user. The phone book is alphabetical, the TV guide by time, the QWERTY keyboard by frequency and speed.
The CHARC table of contents (Figure 10) is the result of a facet analysis and for 25 years has functioned well as the organizing scheme for Chau Hiix data collection and represents all data that will eventually reside in a repository. The faceted approach to organization supports the ability for researchers to access the data from their particular research interest. Analysis level vocabulary (conceptual and contextual) is a starting place in archaeology for material specialists to begin building standardized vocabulary. AAT provides a foundation, but needs archaeological detail, like introducing “provenience,” which currently in AAT defaults to the broader term “provenance.”
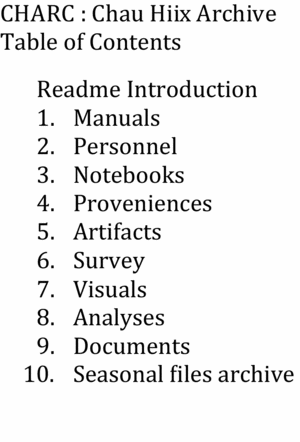
FIGURE 10. Chau Hiix Archive (CHARC) table of contents.
Creating standardized terminology to populate the values in the spreadsheets is a time-consuming process. Future archaeologists would benefit from a community effort to develop a thesaurus of archaeology terms using AAT as a starting place. Establishing common vocabularies and systems for numbering and collecting among the various site-based explorations would facilitate the promise of archaeological science in its ability to reproduce and support each other's theories and potentially create some knowledge about the past.
While ADS pioneered the field of data repositories, today there are many other repository projects to consider, Open Context (2007) being one that fits well with the CHARC spreadsheet approach. A focused effort by the archaeology community to create a clearinghouse of repositories, and to consider adoption of a specific metadata standard and controlled vocabulary governing attribute values, would support the usability, interoperability, and discovery of currently disparate data sets.
Data Availability Statement
No new data were used in this paper. When completed, CHARC will be available from the author or Dr. Anne Pyburn, Department of Anthropology, Indiana University, Bloomington (apyburn@indiana.edu).