


Dyes are an important class of synthetic organic compounds used in printing, dyeing, textile, food, cosmetics colouring, leather and paper industries. More than 100,000 commercially available dyes exist with >8 × 10⁵–106 tonnes produced annually. These compounds have very complex structures, are resistant to aerobic digestion and are stable to light, heat and oxidizing agents. Indeed, their presence influences water quality because many dyes and their metabolites have been reported to be toxic, carcinogenic and mutagenic (Tang et al., Reference Tang, Cai, Yang, Liu, Zeng, Zhou, Li, Wang, Zhang, Fang and He2014). Very small quantities of dyes can impart colour to large water bodies and make them aesthetically unacceptable, even if they may not be toxic (Sarma et al., Reference Sarma, Gupta and Bhattacharyya2016). Thus, it is important to treat dye wastes before discharging them into the environment.
The conventional methods for dye removal from contaminated water involve processes such as flocculation (Kono & Kusumoto, Reference Kono and Kusumoto2015), ozonation (Hu et al., Reference Hu, Xinbo, Songmin, Xiao-ming, Shou-Xiang and Lu2016), membrane filtration (Liu et al., Reference Liu, Chen, Lu, Huang, Lü, Zhou, Yu and Gao2017), coagulation/flocculation (Yeap et al., Reference Yeap, Teng, Poh, Morad and Lee2014), oxidation (Rodrigues et al., Reference Rodrigues, Carabineiro, Maldonado-Hódar and Madeira2017), electrochemical or photochemical degradation (Vasconcelos et al., Reference Vasconcelos, Ribeiro, Migliorini, Alves, Steter, Baldan, Ferreira and Lanza2015; Guz et al., Reference Guz, Curutchet, Torres Sanchez and Candal2014), photocatalytic or biological degradation (Abdel Messih et al., Reference Abdel Messih, Ahmed, Soltan and Anis2017; Esteves et al., Reference Esteves, Rodrigues, Boaventura, Maldonado-Hodar and Madeira2016) and adsorption. Among the proposed treatment methods, adsorption technologies are considered to be very viable due to their potential low cost, efficiency and simplicity of design and operation (Gupta et al., Reference Gupta, Carrott and Ribeiro Carrott2009). Several adsorbents have been tested to remove synthetic dyes such as activated carbon (Mokhtari et al., Reference Mokhtari, Ghaedi, Dashtian, Rahimi and Purkait2016; Pelaez-Cid et al., Reference Pelaez-Cid, Herrera-Gonzalez, Villanueva and Bautista Hernandez2016), hydrotalcites (Deng et al., Reference Deng, Shi, Peng and Zhou2016; Bouraada et al., Reference Bouraada, Ouali and Menorval2016), nanocomposites (Arshadi et al., Reference Arshadi, Mousavinia, Amiri and Faraji2016; Gholami et al., Reference Gholami, Vardini and Mahdavinia2016; Hassanzadeh-Tabrizi et al., Reference Hassanzadeh-Tabrizi, Motlagh and Salahshour2016), hydroxides (Ling et al., Reference Ling, Fang, Lu, Gao, Wu, Zhou and Hu2016; Ruan et al., Reference Ruan, Chen, Chen, Qian and Frost2016), and other low-cost adsorbents, in particular, clay minerals (Errais et al., Reference Errais, Duplaya, Elhabiri, Khodjac, Ocampod, Baltenweck-Guyote and Darragi2012; Leodopoulos et al., Reference Leodopoulos, Doulia, Gimouhopoulos and Triantis2012; Li et al., Reference Li, Liu, Zhao and Feng2016b). Among the clay minerals, montmorillonite is considered to be the most suitable adsorbent and it is used widely in dye removal due to its availability, non-toxicity, large specific surface area, high swelling capacity, high cation exchange capacity (CEC) and the presence of several types of active sites on its surface. Untreated and modified montmorillonite have been used successfully as adsorbents for various dyes such as Congo Red (Vimonses, Reference Vimonses2009), Acid Orange 7 and Acid Blue 9 (Gil et al., Reference Gil, Assis, Albeniz and Korili2011), Malachite Green (Tahir et al., Reference Tahir, Hammed, Sultan and Jahanze2010), Acid Blue193 (Özcan et al., Reference Özcan, Erdem and Özcan2005) and Basic Red 18 (Ho et al., Reference Ho, Chiang and Hsu2001).
The purpose of the present study was to evaluate the adsorption capacity of purified and surfactant-modified Tunisian clay for anionic and cationic dyes. For this reason, two typical dyes were used: MO (an anionic dye) and CV (a cationic dye). MO is a pH indicator and an industrial dye; it is commonly present in effluent discharges from textile, food, pharmaceutical, printing and paper-manufacturing industries. CV dye, which belongs to the triphenylmethane group, is used widely as an animal medicine in veterinary practice. It is also used for the dying of wool, silk, cotton, nylon, paper, leather, etc.
In the present study, the samples were characterized by XRD, FTIR and potentiometric acid-base titration. The effects of pH, contact time, initial dye concentration, and temperature were investigated in detail in batch experiments. Another objective of this study was to test various kinetics and equilibrium-isotherm models because a proper mathematical equation represents the relationship between equilibrium adsorption capacity and adsorbate concentration.
MATERIALS AND METHODS
Chemicals and materials
The surfactant salt used was hexadecylpyridinium bromide (95% purity), which is a cationic surfactant (C21H38N.Br), with molar mass of 384.44 g.mol–1 (Sigma Aldrich, St. Louis, Missouri, USA). The cationic dye, CV, and anionic dye, MO, were purchased from Sigma Aldrich (Steinheim, Germany). Some physicochemical characteristics of the dyes used are listed in Table 1. All the reagents were used as received.
Table 1. Physicochemical characteristics of the dyes used.
The Na+-exchanged clay (EP-Na) used in the present study was prepared according to the classical method of Van Olphen (Reference Van olphen1963). The <2 µm size fraction was separated by sedimentation in deionized water and was stirred for 24 h with NaCl (1 M). The clay consists of interstratified illite-smectite (I-S) with 78% smectite layers according to Reynolds and Hower (Reference Reynolds and Hower1970). A representative structural formula of the exchanged smectites derived from the chemical composition is (Si7.76 Al0.24)(Al0.93Fe0.39Mg0.68)Na0.62K0.2O22. The CEC and Brunauer Emmet Teller (BET) surface area of the sample are 80.0 meq/gclay and 94.93 m2/gclay, respectively (e.g. Gammoudi et al., Reference Gamoudi, Frini-Srasra and Srasra2012).
The HDPy+-modified clay (EP-HDPy3CEC) was prepared according to the batch method described in previous reports (Gamoudi et al., Reference Gamoudi, Frini-Srasra and Srasra2012). The molar ratio of surfactant HDPy+ to the CEC was 3.0:1.0 for the EP-Na clay.
Characterization of adsorbents
X-ray diffraction analysis was performed using a PANalytical X'Pert HighScore Plus diffractometer with monochromated Cu-Kα1 radiation (30 mA and 40 kV) over the range 3–20°2θ at a scanning speed of 2°2θ min–1.
Fourier transform infrared spectroscopy (FTIR)
Infrared spectra were obtained using a Perkin-Elmer FTIR (model 783) spectrometer with a smart endurance single-bounce diamond ATR cell. Spectra over the 400–4000 cm−1 range were obtained by the co-addition of 64 scans with a resolution of 4 cm−1 and a mirror velocity of 0.632 cm s−1. KBr pellets were prepared by mixing clay with KBr at 5 wt.% concentration.
Surface-charge density, σ H
The surface-charge density was determined by potentiometric acid-base titration using NaCl as a background electrolyte at constant ionic strength (0.1 M). The pH was measured using a Corning pH glass combination electrode which was calibrated with buffer solutions at pH = 4 and pH = 9.18. The σH was calculated as the difference between the total amount of H+ or OH– added to the dispersion and that required to bring a blank solution with the same NaCl concentration to the same pH (Schroth & Sposito, Reference Schroth and Sposito1997):
 $$\eqalign{&{\rm \sigma _H}\left( {{\rm mol}{\rm.} {\rm m}^{- 2}} \right) \cr & \quad \, = \, \displaystyle{V \over m}S \left\{\vphantom{\left( {\displaystyle{{K_w} \over {{\left[ {H^ +} \right]}_b}} - \displaystyle{{K_w} \over {{\left[ {H^ +} \right]}_S}}} \right)} \left( {{\left[ {H^ +} \right]}_b - {\left[ {H^ +} \right]}_s} \right)\right. \left. \,-\, \left( {\displaystyle{{K_w} \over {{\left[ {H^ +} \right]}_b}} \,-\, \displaystyle{{K_w} \over {{\left[ {H^ +} \right]}_S}}} \right) \right\}}$$
where V is the volume of the electrolyte solution equilibrated with the clay (mL); [H +] is the solution proton concentration; K w is the dissociation product of water, subscripts ‘s’ and ‘b’ refer to the sample and blank solutions, respectively; m is the mass of sample used (g) and S is the specific surface area (m2/g).
Adsorption experiments
Batch experiments of 0.1 g of sample (purified or modified clay) with 50 mL of dye solution were used to test dye adsorption. The clay/dye mixtures were shaken at 2700 rpm for a given time (see below). The suspensions were then filtered and analysed using a UV-visible spectrophotometer (Perkin Elmer model LAMBDA 20) at maximum wavelength absorption for each dye. The maximum was 584 and 464 nm for CV and MO, respectively. The experiments were carried out by varying initial dye concentration, pH solution, contact time and temperature. The dye quantities adsorbed by two samples were determined from the mass balance equation (equation 2):
 $$Q_{{\rm ads}\;} \left( {{\rm mg}/{\rm g}} \right) = \displaystyle{{\left( {C_0 - C_{{\rm eq}}} \right) \times V_{\rm s}} \over m}$$
Where C 0 and C eq are the initial concentration and equilibrium concentration of dye solution (g/L) respectively; V s the volume of dye solution (mL) and m is the amount of clay used (g).
Effect of pH solution
To test the effect of solution pH on dye adsorption, the experiments were carried out by adjusting the initial pH to 3.0, 5.0, 7.0, 9.0 and 11.0 using 0.1 M HCl and NaOH solutions with a pH-meter, at initial dye concentration of 200 mg/L, temperature of 298 K and contact time of 2 h.
Effect of contact time
The effect of time on adsorption was investigated by varying the time from 10 min to 6 h at 293 K for an initial dye concentration of 200 mg/L.
Effect of initial dye concentration
For two samples (purified or modified clay), adsorption equilibrium studies were performed by adding 0.1 g of sample to 50 mL of various dye solutions (10–500 mg/L) in stoppered bottles. The flasks were stirred for 24 h using a mechanical shaker at 2700 rpm.
Effect of temperature
The effect of temperature on dye adsorption was investigated at various temperatures (293–323 K) at an initial dye concentration of 200 mg/L and contact time of 2 h.
Theoretical considerations
Adsorption kinetics
The mechanism of adsorption was investigated using pseudo-first order, pseudo-second order, intra-particle diffusion and Elovich kinetic models to fit the kinetic experimental data. The pseudo-first order kinetics equation may describe the initial phase in the adsorption process but with the progressive adsorption, the data may deviate from the fitting curve. The pseudo-second order equation agrees with chemisorption as the rate-control mechanism. According to the intraparticle diffusion model, several mechanisms are involved and adsorption may consist of three steps: external surface adsorption, intra-particle diffusion which is the rate-limiting step, and the final equilibrium which is very fast. The Elovich equation was used to describe the rate of adsorption that decreased exponentially with increase in the amount of adsorbate but did not provide any mechanistic information about the adsorption process (Yan et al., Reference Yan, Qin, Yu, Li, Shan and Du2015). The linear form of the pseudo-first order (Lagergren, Reference Lagergren1898), pseudo-second order (Ho & McKay, Reference Ho and Mckay1999) intra-particle diffusion (Weber & Morris, Reference Weber and Morris1963) and Elovich (Chien & Clayton, Reference Chien and Clayton1980) kinetic rate equations are given by equations 3–6, respectively:
 $${\rm Ln}\left( {Q_{\rm e} - Q_t} \right) = {\rm Ln}Q_{\rm e} - {\rm k}_1t$$
 $$\displaystyle{t \over {Q_t}} = \displaystyle{1 \over {{\rm k}_2Q_{\rm e}^2}} + \displaystyle{t \over {Q_{\rm e}}}$$
 $$Q_t = {\rm k}_3\; t^{1/2} + C$$
 $$Q_t = \displaystyle{1 \over {\rm \beta}} {\rm Ln}\left( {{\rm \alpha}. {\rm \beta}} \right) + \displaystyle{1 \over {\rm \beta}} {\rm Ln}\left( t \right)$$
where Q t (mg/g) is the amount of dye adsorbed at time t (min), Q e (mg/g) is the equilibrium adsorption capacity, k1 (1/min) is the rate constant of the pseudo-first order equation, k2 (g/(mg.min)) is the constant rate of the pseudo-second order equation, k3 (mg/(g·min1/2)) and C (mg/g) are the rate constant and intercept of intra-particle diffusion equation respectively, and α (mg/g min) and β (g/mg) are the initial adsorption rate and the parameter related to the extent of surface coverage and activation energy of the Elovich equation, respectively.
The adsorption rate constant, k1, for the first-order kinetics was determined from the plot of ln(Q e−Q t) vs. t. The equilibrium adsorption capacity (q e) and the second-order rate constant, k2, may be determined experimentally from the slope and the intercept of plot t/q t vs. t. The plot of q t vs. t 1/2 yields a straight line passing through the origin in the case of intra-particle diffusion. The initial adsorption rate, α, and the parameter β, related to the extent of surface coverage and activation energy of the Elovich equation, were determined from the slope and intercept of the graph by plotting q e vs. ln(t).
Adsorption equilibrium isotherm
The adsorption isotherm is important in terms of establishing the most appropriate correlation for the equilibrium data for the adsorption batch system. The validity of the conclusions made from the isotherm depends on the adequacy of a model to describe a particular situation. Also, a proper mathematical representation of the equilibrium isotherm, which is based on a correct adsorption mechanism, is essential for an effective design of adsorption systems. In the present study, the adsorption data were tested with respect to the Freundlich, Langmuir, Temkin and Dubinin-Radushkevish isotherm models.
Langmuir isotherm model
The Langmuir isotherm is commonly applied in the case of a complete, homogenous surface with negligible interaction between adsorbed molecules. The linear equation of the Langmuir model is as follows (Langmuir, Reference Langmuir1916):
 $$\displaystyle{1 \over {Q_{{\rm ad}}}} = \displaystyle{1 \over {q_{{\rm max}}{\rm k}_{\rm L}}} \times \displaystyle{1 \over {C_{{\rm eq}}}} + \displaystyle{1 \over {q_{{\rm max}}}}$$
Where Q ad represents the mass of adsorbed ions per unit of adsorbent (mg/g), q max is the maximum adsorption capacity corresponding to monolayer coverage; kL is the equilibrium constant related to the energy of adsorption and C eq is the equilibrium concentration of the solution (mg/L).
The essential characteristics of the Langmuir isotherm may be expressed by means of a dimensionless constant, RL, known as the equilibrium parameter or separation factor. RL may be calculated using the following equation (8):
 $${\rm R}_{\rm L} = \displaystyle{1 \over {\sqrt {1 + {\rm k}_{\rm L} \times C_0}}} $$
where C 0 (mg/L) is the initial concentration of the dye. RL values >1 indicate unfavourable adsorption; RL = 0 indicates irreversible sorption; RL = 1 denotes linear adsorption and 0 < RL < 1 suggests favourable sorption (Robati et al., Reference Robati, Mirza, Rajabi, Moradi, Tyagi, Agarwal and Gupta2016).
Freundlich isotherm model
The Freundlich model is characteristic of heterogeneous surfaces. The Freundlich equation may be represented by the following, linear equation (Freundlich, Reference Freundlich1906):
 $$\log Q_{{\rm ad}} = \log {\rm k}_{\rm f} + \; \displaystyle{1 \over n} \times \log C_{{\rm eq}}$$
where Q ad and n represent adsorption capacity and intensity, respectively and kf is a constant indicative of the adsorption efficiency. The magnitude of n is indicative of the favourability of adsorption. Values of 1/n of <1 indicate normal adsorption; otherwise, it is indicative of cooperative adsorption. For all examples studied, 1/n was <1 suggesting that adsorption is favourable at high concentrations but less effective at lower concentrations.
Temkin isotherm model
Adsorbate–adsorbate interactions are best accounted for by the Temkin isotherm which assumes that the heat of adsorption decreases linearly with coverage due to adsorbate-adsorbate interactions.
The Temkin model is represented in equation 10 (Temkin, Reference Temkin and Pyzhev1940):
 $$Q_{{\rm ad}} = B{\rm ln}{\rm A}_{\rm T} + B{\rm ln}C_{{\rm eq}}$$
where $B = \displaystyle{{\rm R}.T \over {\rm b}_{\rm T}}$; bT is the Temkin constant related to adsorption heat, R is the gas constant, T is temperature (K) and AT is the Temkin parameter related to the equilibrium binding energy.
Dubinin-Radushkevich isotherm model
The Dubinin–Radushkevich isotherm is used to estimate the characteristic porosity and the apparent free energy of adsorption. It is useful for determining the nature of adsorption processes whether physical or chemical. The linear form is given in equation 11 (Dubinin & Radushkevich, Reference Dubinin and Radushkevich1947)
 $${\rm Ln}\; Q_{{\rm ad}} = {\rm ln}q_{\rm s} - k_{{\rm ad}}{\rm \varepsilon} ^2\; $$
where q s is the theoretical isotherm saturation capacity (mg/g), k ad is the activity coefficient related to adsorption mean free energy (mol2/J2) and ε is the Polanyi potential given by equation 12:
 $${\rm \varepsilon} = {\rm R}T{\rm ln}\left( {1 + \displaystyle{1 \over {C_{{\rm eq}}}}} \right)$$
The mean free energy of adsorption (E, kJ/mol) may be determined using equation 13:
 $${E} = \displaystyle{1 \over {\sqrt {2K_{{\rm ad}}}}} $$
This energy gives information about chemical or physical adsorption. For 8 < E < 16 kJ/mol, the adsorption is chemical, whereas for E < 8 kJ/mol, the adsorption is physical (Muthukumaran et al., Reference Muthukumaran, Sivakumar and Thirumarimurugan2016).
Thermodynamic parameters
The thermodynamic parameters of adsorption, Δ°H (kJ mol–1), Δ°S (kJ mol–1 K–1) and Δ°G (kJ mol−1) might be evaluated using equations 13 and 14 (Freitas et al., Reference Freitas, Mendes and Coelho2007):
 $$\Delta ^\circ G = - {\rm R}T\; {\rm ln}K_{\rm d}$$
 $$\Delta ^\circ G = \Delta ^\circ H - T\Delta ^\circ S$$
Equations 13 and 14 may be expressed as:
 $${\rm ln}{\rm K}_{\rm d} = \displaystyle{{\Delta ^\circ S} \over {\rm R}} - \displaystyle{{\Delta ^\circ H} \over {{\rm R}T}}$$
where K d is the distribution coefficient of the adsorbate (=Q ad/C e), Q e is the amount of adsorbate at equilibrium (mg/kg), C e is the equilibrium concentration (mg/L), T is the absolute temperature (K) and R is the gas constant = 8.314 × 10⁻³ kJ K–1 mol–1. The plot of ln K d vs.  $\displaystyle{1 \over T}\; $ is linear with the slope and the intercept yielding values of Δ°H and Δ°S. All these relations are valid when the enthalpy change remains constant in the temperature range studied.
RESULTS AND DISCUSSION
Characterization of the adsorbents
X-ray diffraction analysis
The modification of the EP-Na by cationic surfactants HDPy+ through incorporation into the interlayer space was monitored through the swelling of the clay (Fig. 1) In all samples the d 001 basal spacing shifted towards higher values after addition of the surfactant, indicating successful intercalation of the surfactant within the clay layers. The EP-Na and EP-HDPy3CEC displayed d 001 basal spacings of 12.36 Å and 43.97 Å, respectively. The TOT layer thickness of smectite is 9.7 Å (He et al., Reference He, Zhou, Frost, Wood, Duong and Kloprogge2007) and the molecular size of HDPy is 23.1 Å for the “nail-body” (Bors et al., Reference Bors, Dultz and Riebe1999) (i.e. the non-polar hydrophobic tail and polar hydrophilic head of the surfactant). Thus, the HDPy molecules in the modified clay obtained a paraffin-type bimolecular arrangement.
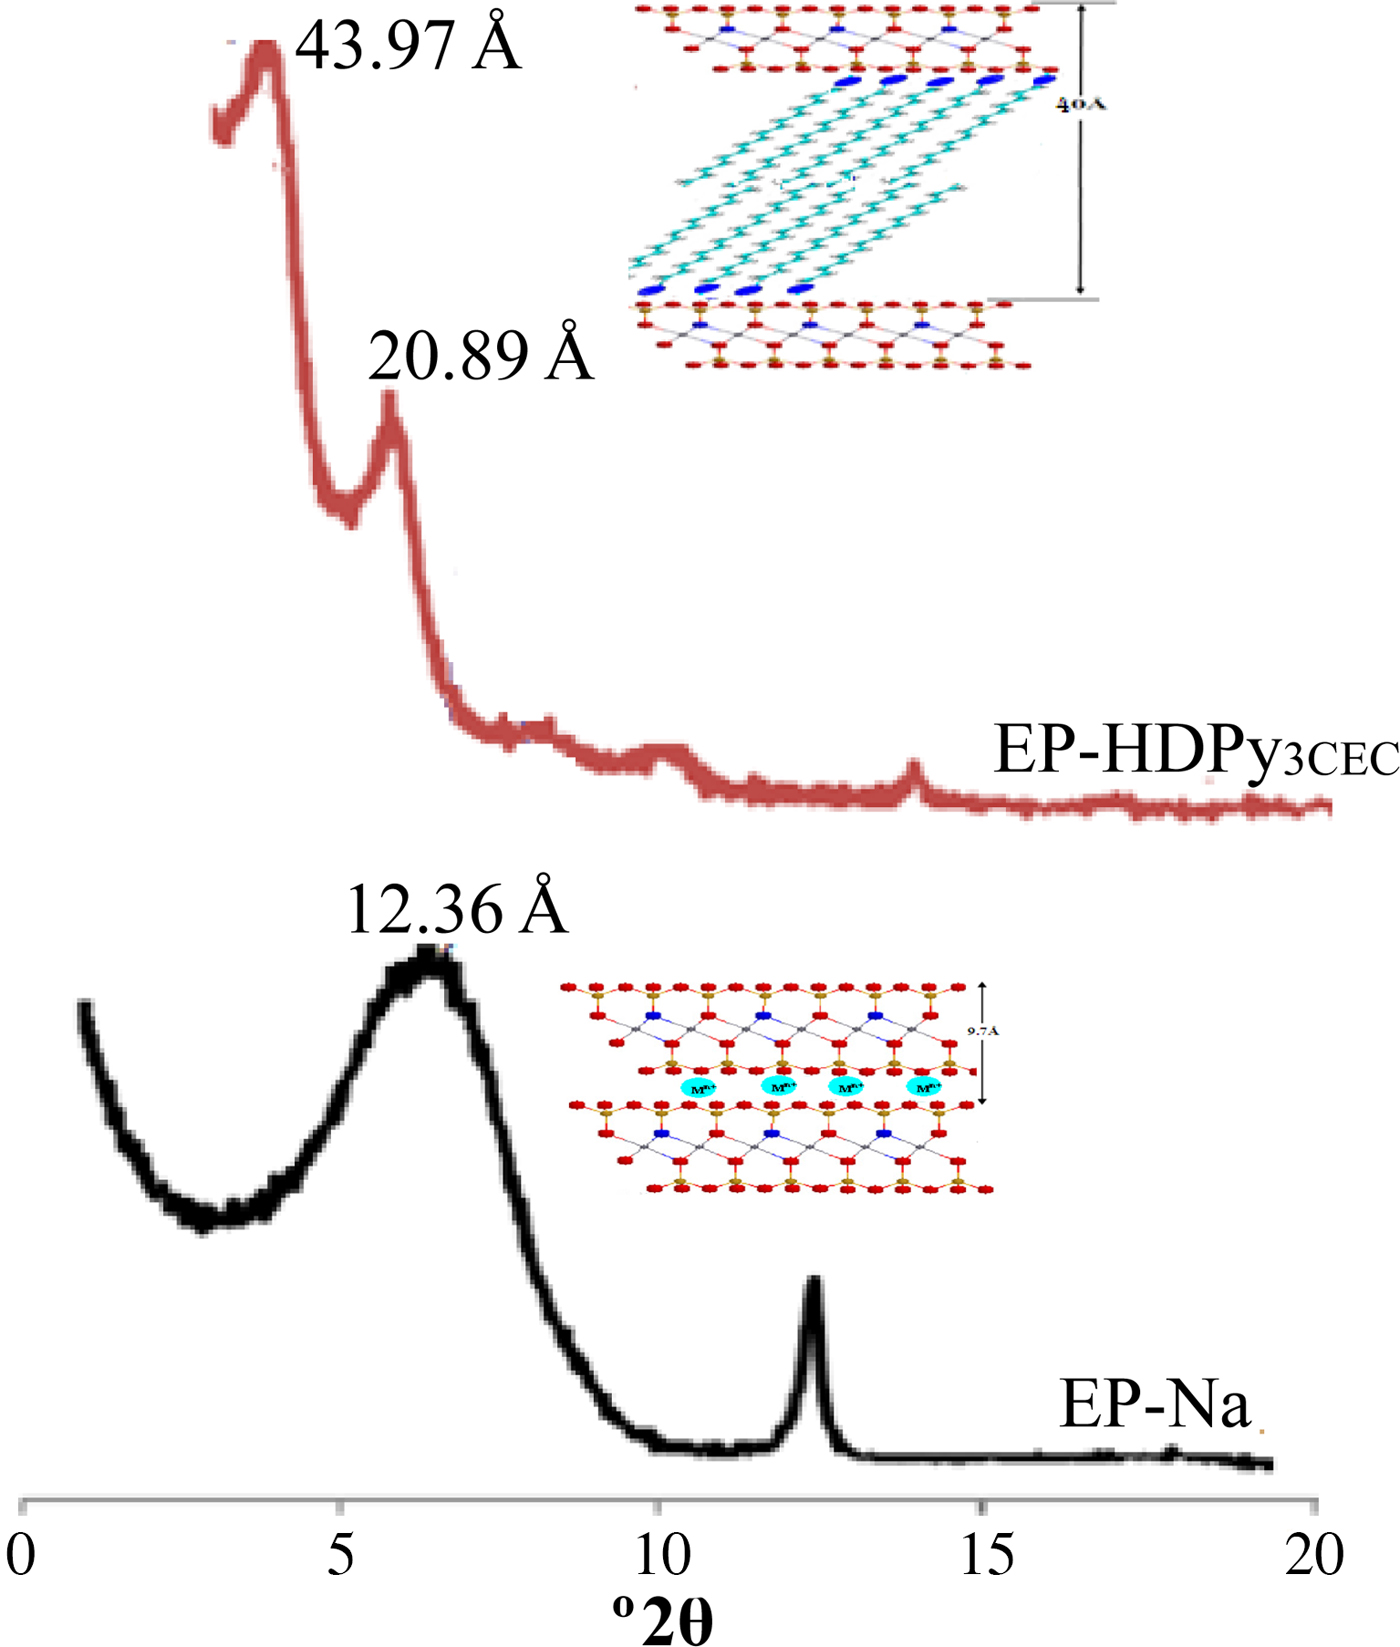
Fig. 1. XRD patterns of purified and modified clays.
Infrared spectroscopy
The FTIR spectra of the HDPy surfactant molecules, the purified (EP-Na) and the organo-clay EP-HDPy3CEC samples are shown in Fig. 2. The spectra of the HDPy-modified clay are characterized by a N–H stretching band at υ = 3452 cm–1, pyridine vibrations at 1639 cm–1, C–H stretching bands of CH2 at 2920 and 2850 cm–1 and finally, aromatic C=C vibrations at 1473 and 1373 cm–1 (Bors et al., Reference Bors, Patzko and Dekany2001). The IR spectrum of the organoclay also contains absorption bands at υ = 3620 cm–1 corresponding to Al–OH–Al stretching vibrations and characteristic Si–O–Si vibrations at 1052 cm–1. Antisymmetric and symmetric Si–O bending modes are also present at 542 and 532 cm–1.
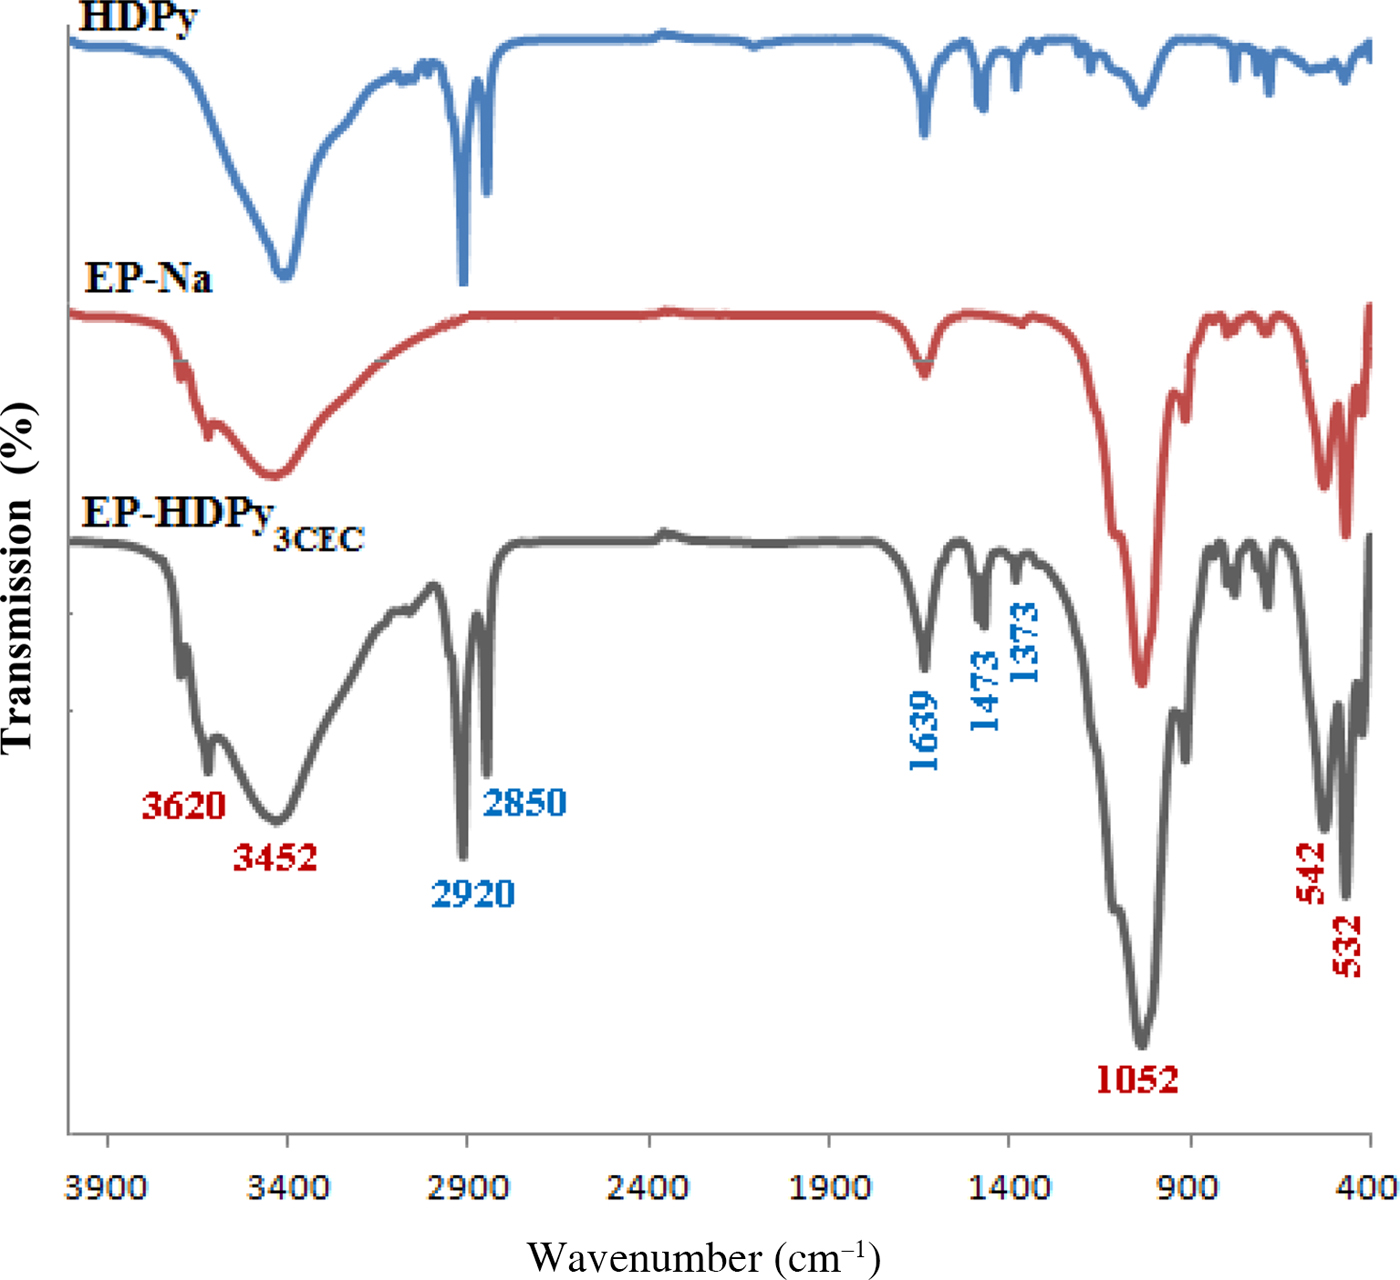
Fig. 2. FTIR spectra of HDPy surfactant, purified and modified clays.
Surface charge density
The surface proton density σH data vs. the pH of the clay and organoclay dispersed in 0.1 M NaCl in the pH range 2.5 to 11 are shown in Fig. 3. The titration curves were similar in shape for the range of pH used and comparable to those published in the literature (Hamdi & Srasra, Reference Hamdi and Srasra2014). For the purified clay, the titration curves have two branches: σH is positive in the acidic pH range due to the protonation of surface functional (Al-OH and Si-OH) groups and negative in the alkaline range due to deprotonation. The organoclay has a surface charge density which is greater than that of the purified clay, which was produced by protonation and deprotonation of surfactant-hydroxyl surface complexes formed at variable-charge hydroxyl groups at the edges of the clay (Hamdi & Srasra, Reference Hamdi and Srasra2014). The purified clay has a point of zero charge (PZC) of 6.8. After modification by HDPy equivalent to 3.0 CEC the PZC shifted to 7.8 in agreement with similar studies (Ma et al., Reference Ma, Cui, Dai and Li2011; Hamdi & Srasra, Reference Hamdi and Srasra2014).
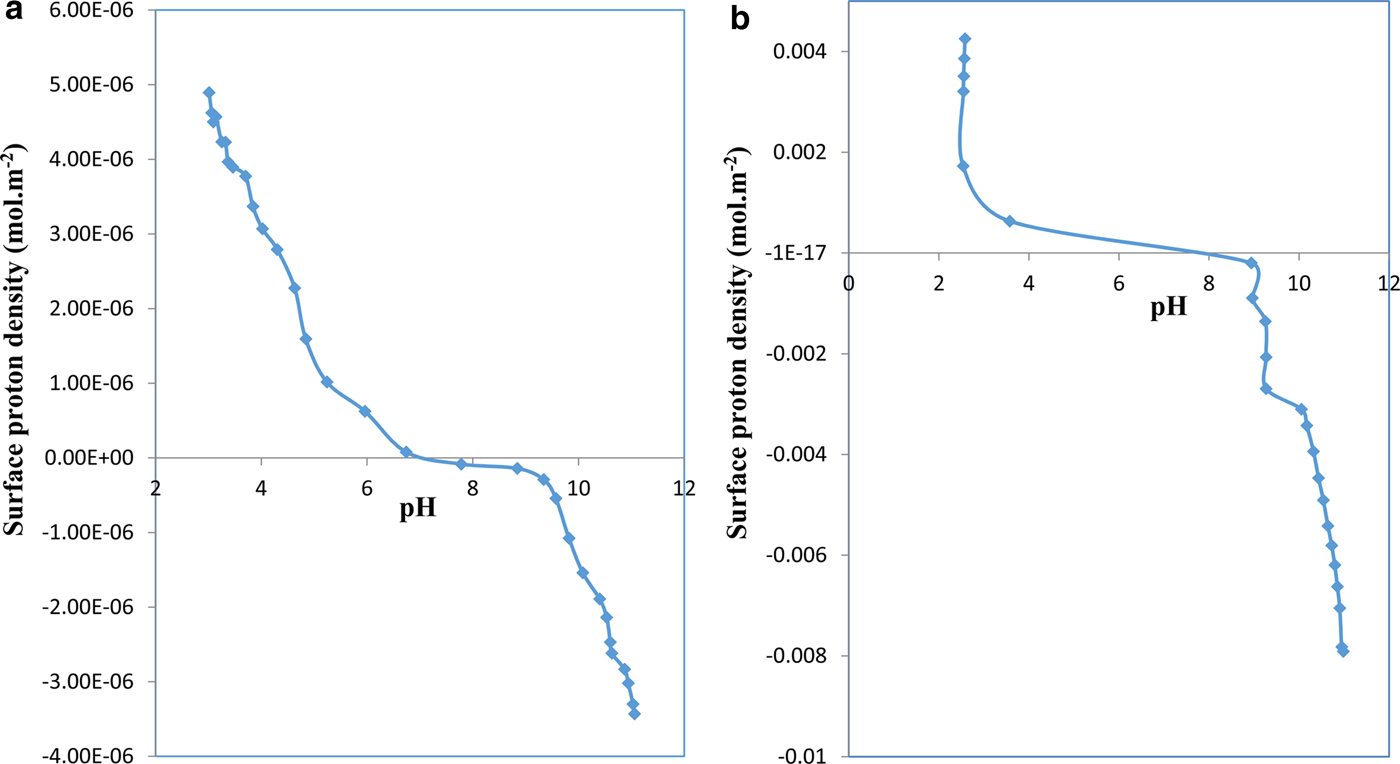
Fig. 3. Potentiometric titration curves vs. pH at ionic strength of 0.1 M and at 279 K: (a) EP-Na and (b) EP-HDPy3CEC.
Removal of dyes
Effect of pH
The pH of the solution is a vital factor in terms of controlling the capacity and mechanism of adsorption. It influences the surface charge of the adsorbent, the solubility of dyes (Subbaiah et al., Reference Subbaiah and Kim2016) the dissociation of functional groups on the active sites of the adsorbent as well as the structure of the dye (Li et al., Reference Li, Sun, Zhang, Tian, Cui and Yan2016a). The effect of pH on removal of CV and MO by the EP-Na and EP-HDPy3CEC adsorbants is illustrated in Fig. 4.
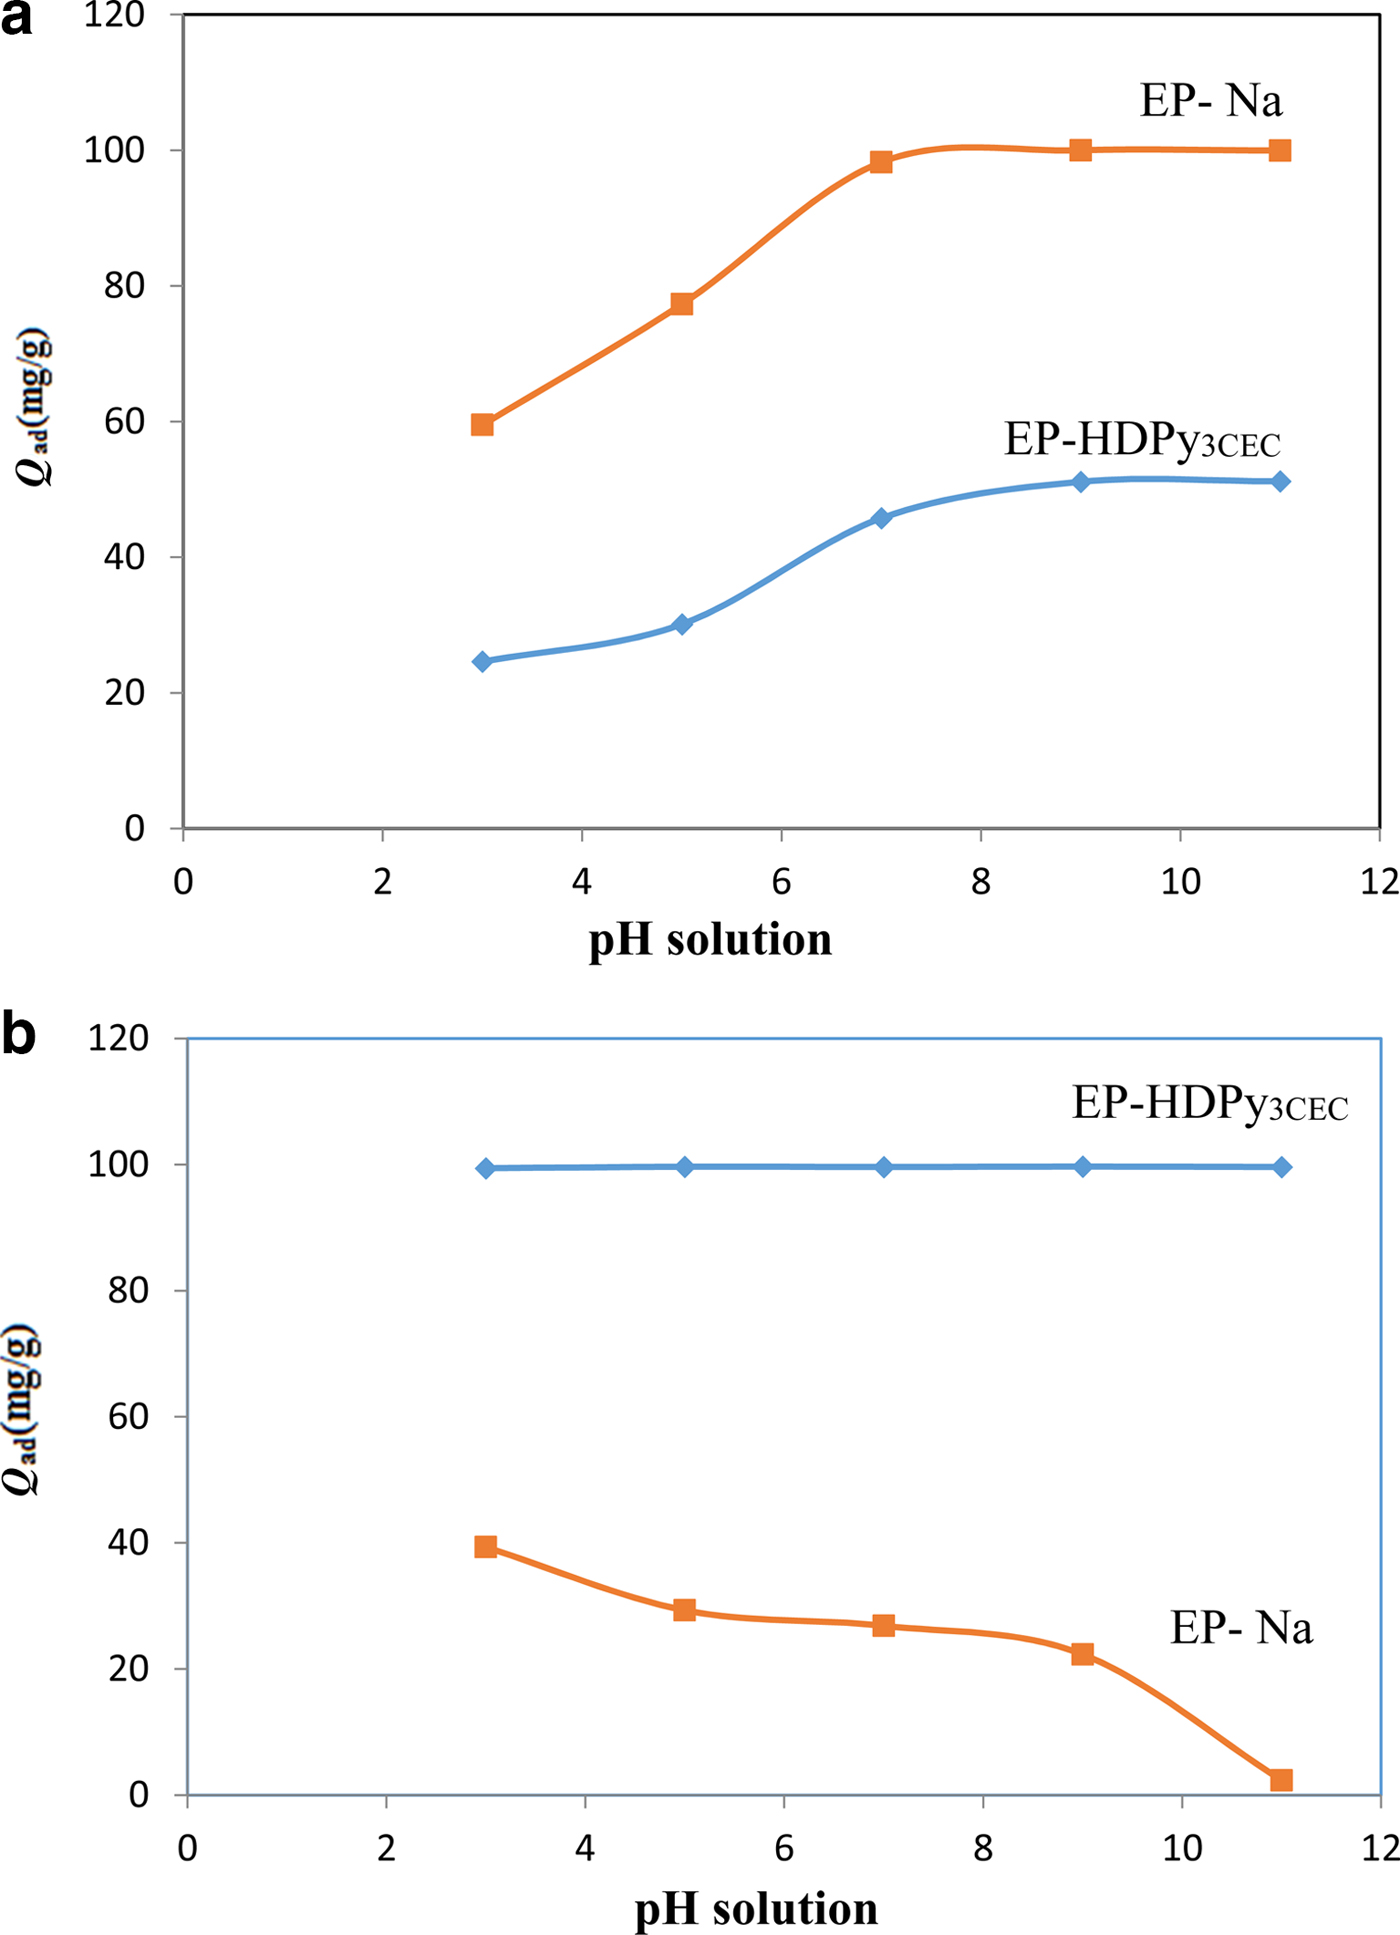
Fig. 4. Effect of pH solution on the sorption of dyes onto purified and modified clays: (a) the cationic dye Crystal Violet; and (b) the anionic dye Methyl Orange.
For CV dye, which has a stable chemical structure, CV+, in the pH range 3–11 (Adams & Rosenstein, Reference Adams and Rosenstein1914), the increase in pH boosts the adsorption onto two clays from a value of 59.5 mg/g at pH 3.0 to >99.95 mg/g at pH 7.0 for EP-Na and from 24.6 mg/g at pH 3.0 to 51.2 mg/g at pH 8.0 for EP-HDPy3CEC (Fig. 4a). Earlier works reported that cationic dye sorption increases with increase in pH (Monash & Pugazhenthi, Reference Monash and Pugazhenthi2010; Sarma et al., Reference Sarma, Gupta and Bhattacharyya2016). With increasing pH, the protonized surface groups (≡S-OH2+) of EP-Na (PZC = 6.8), hydroxyl and carboxylate groups on EP-HDPy3CEC (PZC = 7.8) would deprotonize gradually. The number of negatively charged adsorption sites increased and the surface charge on the beads became negative, which enhanced the electrostatic interaction between the cationic dye CV and the adsorbents. The large adsorption capacity of EP-Na was due to the strong electrostatic interaction between the permanent negative charge (CEC = 80.0 meq/gclay) and dye cations. In contrast, EP-HDPy3CEC contained fewer adsorption sites. Only variable surface charge was presented. Minimum removal of CV was found for pH = 3, probably due to the presence of excess H+ ions competing with the cation groups on the dye for adsorption sites.
The MO dye has two chemical structures, the chromophores of which are nanthraquinone, depending on the pH of the solution. The pKa value of MO is 3.37, which means that it is an anion when the solution pH is greater than its pKa value due to the deprotonation from the ammonium ion, MO, from the azonium ion MO– (Tawarah & Abu-Shamleh, Reference Tawarah and Abu-Shamleh1991). The adsorption of an anionic dye, MO, on EP-HDPy3CEC was pH-independent over the pH range 3–11 (Fig. 4b), because of the hydrophobic interaction of the carbon chain of HDPy with the sulfonate groups of the dyes. Similarly, the pH effects on adsorption of anionic dyes on the modified clays were also minimal (Ozan et al., Reference Özan, Erdem and Özcan2004; Baskaralingam et al., Reference Baskaralingam, Pulikesi, Elango, Ramamurthi and Sivanesan2006). However, an increase in the solution pH from 3 to 11 decreased the MO removal by EP-Na substantially from q ads (MO) = 39.32 mg/g to q ads (MO) = 2.34 mg/g. At a lower pH value, the electrostatic attraction between the anionic adsorptives and the positively charged adsorption sites increased. As the pH of the system increased, the number of positively charged sites decreased, and the overall surface charge on the surface of EP-Na clay became negative, which reduced the adsorption of anionic molecules.
Adsorption kinetics
Equilibrium time is one of the most important parameters affecting the design of wastewater-treatment systems. The effect of contact time on the adsorption of CV and MO dyes onto EP-Na and EP-HDPy3CEC clays at an initial solution concentration of 200 mg/L is shown in Fig. 5. The adsorption process of MO by two clays was relatively fast, and the adsorption reached equilibrium in <120 min. The adsorption of CV by EP-Na was quick, reaching equilibrium after 60 min but the adsorption of CV by EP-HDPy3CEC was much slower, reaching equilibrium after 320 min. These results indicate that the adsorption kinetics are very dependent on the dye structure and the properties of the adsorbant (Santos et al., Reference Santos, Oliveira and Boaventura2016). The equilibrium capacities were 99.84 and 53.87 mg/g for CV and 26.85 and 199.32 mg/g for MO for the two samples.
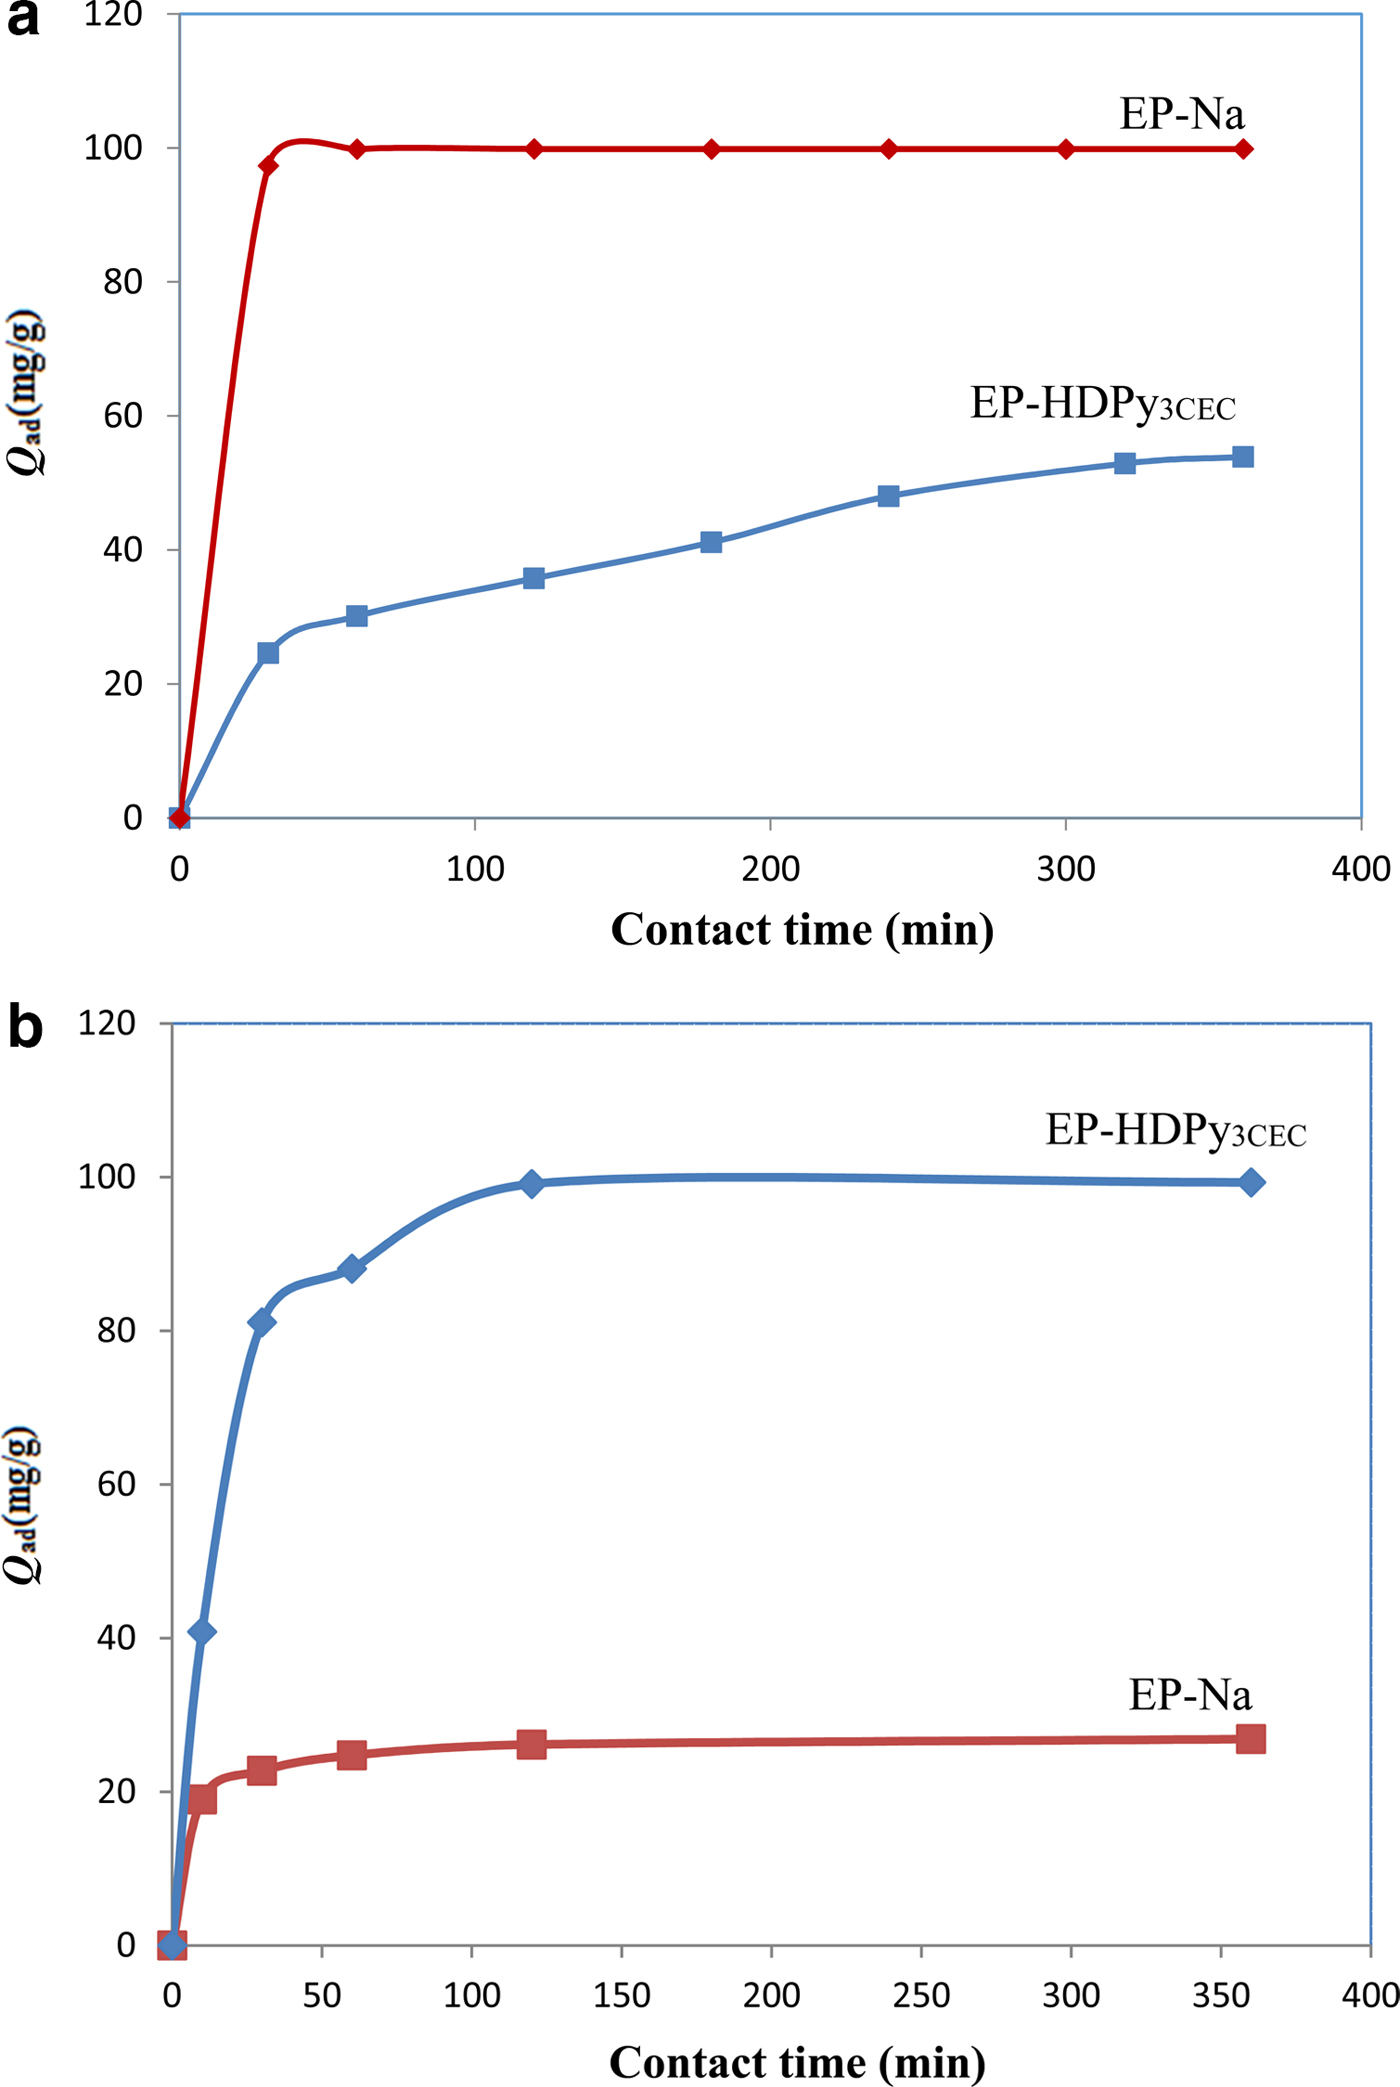
Fig. 5. Effect of contact time on the sorption of dyes onto purified and modified smectites: (a) the cationic dye Crystal Violet; and (b) the anionic dye Methyl Orange.
Pseudo-first order, pseudo-second order, intra-particle diffusion and Elovich kinetic models were used to evaluate the adsorption kinetics. The estimated kinetic parameters and correlation coefficient (R2) of the four models are summarized in Table 2. For the pseudo-first order model, the R2 varied from 0.44 to 0.98 and the equilibrium capacity (Q e,cal) derived from the equation was much smaller than the equilibrium experimental capacity (Q e,exp) (deviations ranging from 15.35 to 181%). The pseudo-first order kinetic model was not suitable, therefore, for modelling sorption process of MO and CV dyes on the two clays. The pseudo-second order kinetic model yielded better fitting with greater coefficients of determination, R2 (0.98–1.00), than the other kinetic models (Table 2). Hence, the pseudo-second order kinetics may better describe the uptake of CV and MO onto the clays. In addition, the experimental values (Q e,exp) show good agreement with the corresponding values calculated by the pseudo-second order model (Q e,cal). Similar results have been observed for the adsorption of acid dyes (AB25, AB93, ATBA, AGYG) onto CTMAB-bentonite (Yan et al., Reference Yan, Qin, Yu, Li, Shan and Du2015), and in the adsorption of cationic dyes (MB, CV, RB) onto organoclays (Anirudhan & Ramachandran, Reference Anirudhan and Ramachandran2015). The adsorption of dyes may be due to electrostatic attraction between the charged surface and charged dye molecules, in conjunction with the chemical characteristics of the clays and dyes molecules (Keyhanian et al., Reference Keyhanian, Shariati, Faraji and Hesabi2011; Muthukumaran et al., Reference Muthukumaran, Sivakumar and Thirumarimurugan2016). The relatively large values of k2 indicate that the adsorption process is very fast and might reach adsorption equilibrium in a short time (Li et al., Reference Li, Sun, Zhang, Tian, Cui and Yan2016a).
Table 2. Kinetics parameters for the adsorption of CV and MO dyes onto purified and modified clays.
On the other hand, the intra-particle diffusion model does not model the adsorption of dyes onto clays as it has large intercept values (97.87–154.1) and the curve does not pass through the origin (Zhang et al., Reference Zhang, Zhang, Guo and Tian2014; Muthukumaran et al., Reference Muthukumaran, Sivakumar and Thirumarimurugan2016). Hence, intra-particle diffusion does not seem to control the adsorption of the dyes (Yan et al., Reference Yan, Qin, Yu, Li, Shan and Du2015). Only the adsorption of cationic dye CV might have been controlled by an intra-particle diffusion mechanism (R2 = 0.994; C = 11.53 mg/g).
Adsorption isotherms
The adsorption isotherms for the two dyes are shown in Fig. 6. The amounts of CV and MO adsorbed increased with increasing initial concentrations, until plateaus were reached. This increasing adsorption is because the initial dye concentration acts as a driving force to overcome the mass-transfer resistance for dye transport and fosters the interaction between the adsorbent and dye molecules. However, due to saturation of the active adsorption sites on the material surface at higher dye concentrations, the adsorption capacity declined for the two dyes (Kuppusamy et al., Reference Kuppusamy, Thavamani, Megharaj, Venkateswarlu, Lee and Naidu2016). The adsorption isotherms were H- and S-type for the CV and MO dyes, respectively, according to the Giles classification (Giles et al., Reference Giles, MacEwan, Nakhwa and Smith1960). Different adsorption capacities were observed, suggesting different retention mechanisms of cationic and anionic dyes on the samples.
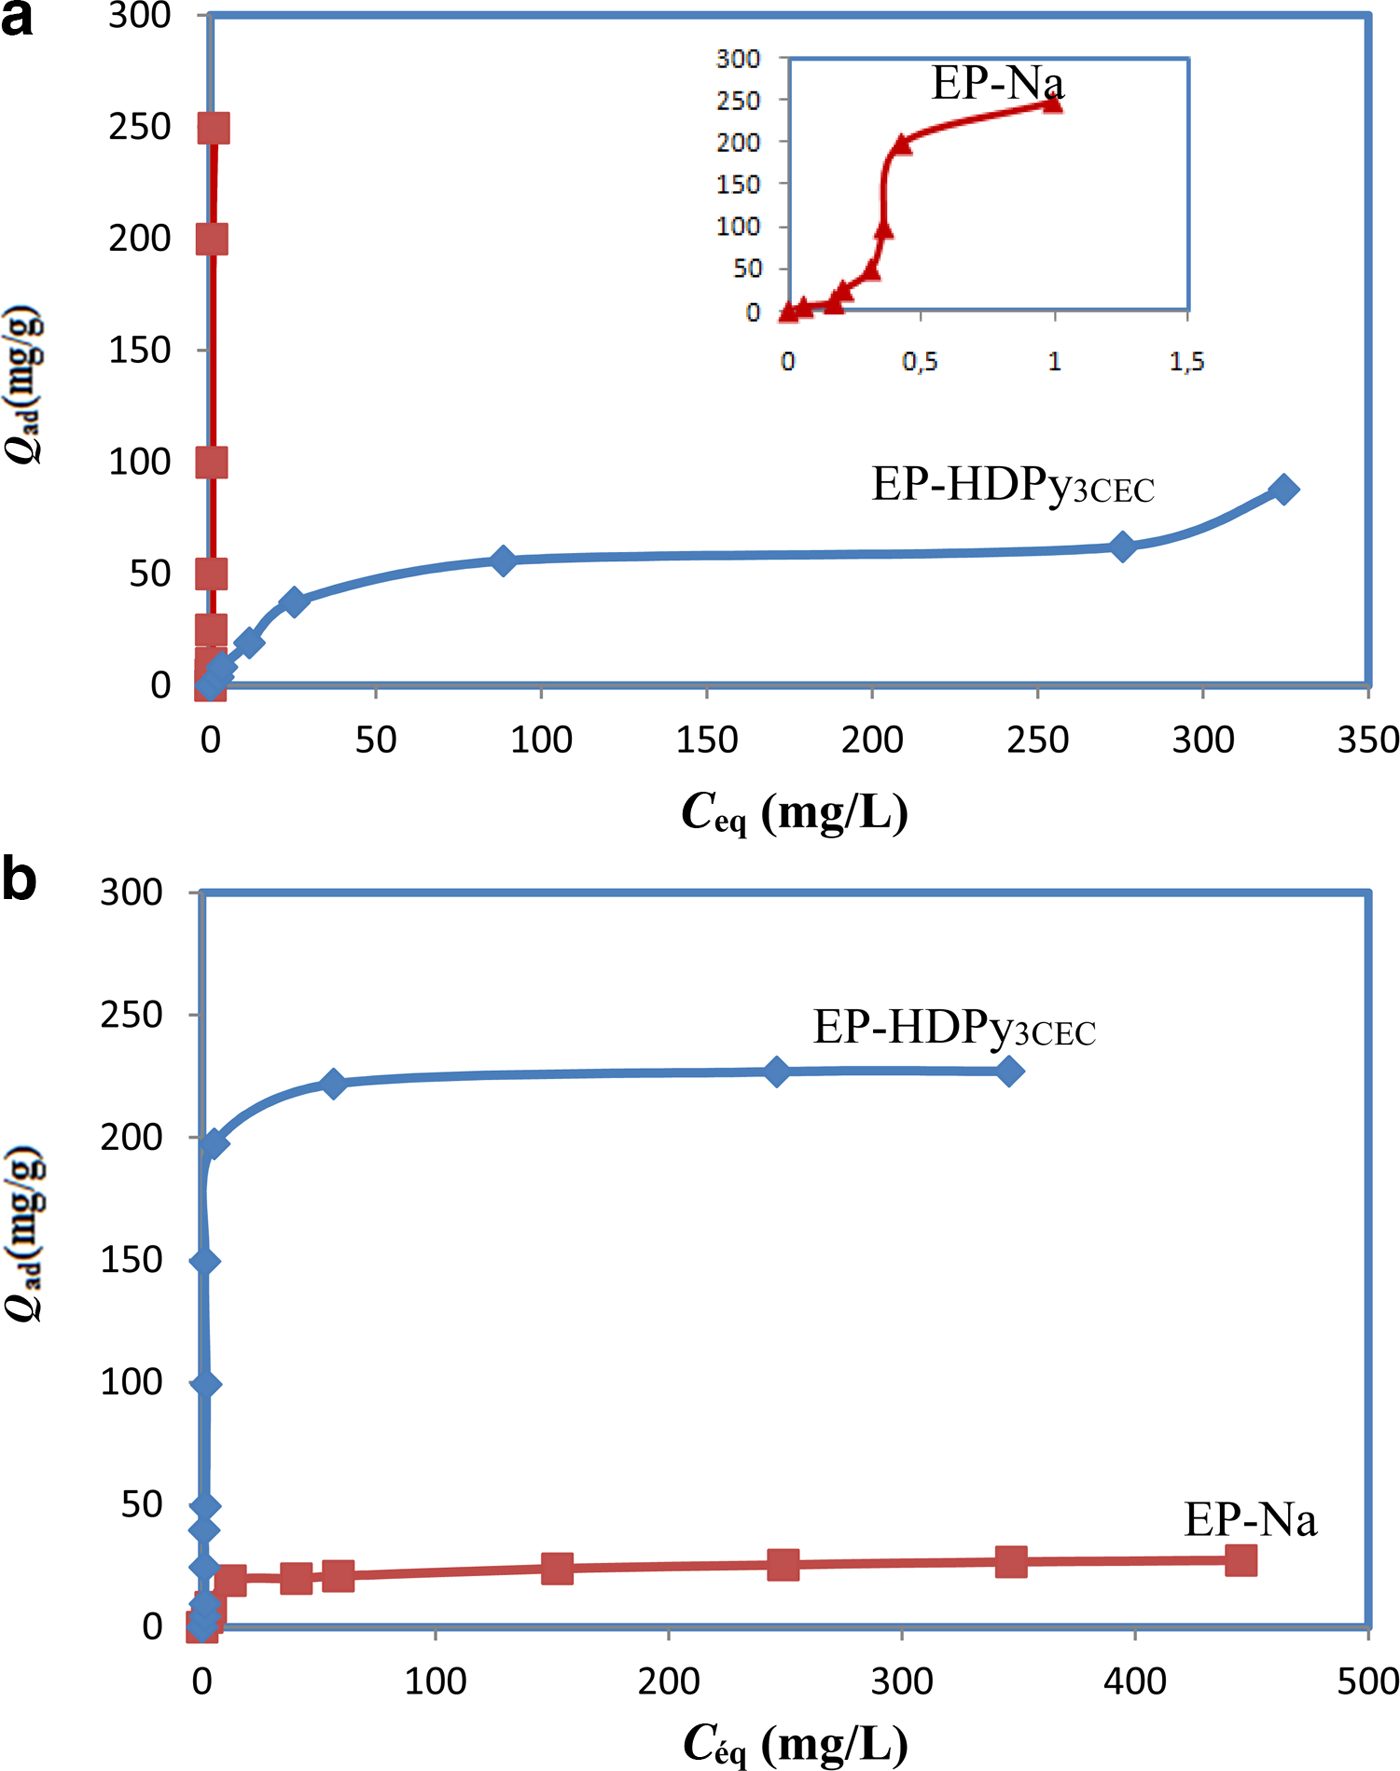
Fig. 6. Retention of dyes by different samples: (a) the cationic dye Crystal Violet; and (b) the anionic dye Methyl Orange.
In order to interpret the adsorption process, Langmuir, Freundlich, Temkin and Dubinin-Radushkevish isotherm models were applied. The adsorption isotherm constants are listed in Table 3.
Table 3. Estimated constants of Langmuir, Freundlich, Temkin and Dubinin-Radushkevish isotherms for CV and MO adsorption by clays.
Langmuir isotherm model
The Langmuir model described effectively the sorption data (R2 > 0.99); exceptional removal of MO by EP-HDPy3CEC was observed. The maximum monolayer adsorption capacities (q max) were estimated as 263.15 and 65.78, respectively, for CV by two clays and 26.45 mg/g for MO by EP-Na, values which are in accord with the experimental data: 249.50 mg/g, 62.78 mg/g and 27.26 mg/g. The large Langmuir equilibrium coefficient, KL, obtained (Table 3) suggested the favourable formation of the dye–clay mineral adsorption complex (Sarma et al., Reference Sarma, Gupta and Bhattacharyya2016). Comparison of the adsorption capacity of the Tunisian clays (purified or modified) with those of various adsorbents from previous studies showed that the purified clay might potentially be used in the removal of the CV dye from aqueous solution and that the modified clay was an effective material in the removal of the MO dye (Table 4). The calculated RL values for the dyes were 0 < RL < 1 (Table 3), suggesting that adsorption of CV and MO by the two clays was favoured.
Table 4. Comparison of adsorption capacities of Tunisian clays with various adsorbents.
Freundlich isotherm model
The R2 values for the Freundlich isotherms obtained for the two dyes were <0.9, indicating that the Freundlich model is not suitable for describing the dye adsorption for this study (Table 3).
Temkin isotherm model
The calculated values of Temkin constants are listed in Table 3. The model was fitted with R2 = 0.97 for the retention of CV dye by EP-HDPy3CEC clay and MO dye by EP-Na clay. The results assumed also that adsorption is characterized by uniform distribution of binding energies up to a maximum value (Sarma et al., Reference Sarma, Gupta and Bhattacharyya2016; Lafi & Hafiane, Reference Lafi and Hafiane2016).
Dubinin-Radushkevich isotherm model
The q s values and kad constants and the mean free energy (E) values are listed in Table 3. The small free energy (E, 0.162–0.326 kJ/mol) values obtained indicate that the mechanism of dye adsorption is physisorption due to electrostatic or Van der Waals attractions.
Thermodynamics study
The thermodynamic parameters obtained at various temperatures for dye concentrations of 200 mg/L at natural pH are shown in Table 5. Various behaviours for dye adsorption onto purified and modified clays were observed in the temperature range 293–333 K.
Table 5. Thermodynamic parameters for dye adsorption at various temperatures.
For CV dye, the negative values of overall free energy changes, ΔG°, indicate that the adsorption process was spontaneous. The decrease in ΔG° with increasing temperature suggests that the adsorption is more favoured at higher temperatures. The positive value of ΔS° resulted from the increased randomness due to the adsorption of CV, which suggested good affinity of CV for the two adsorbents and increased randomness at the solid–solution interface during the fixation of CV on the active sites of the clays. The positive value of ΔH° indicates that the adsorption was an endothermic process (Tahir & Naseem, Reference Tahir and Naseem2006; Eren, Reference Eren2009; Jian-min et al., Reference Jian-min, Wu and Jin2010; Depci et al., Reference Depci, Kul, Onal, Disli, Alkan and Turkmenoglu2012).
The interactions between anionic dye, MO and the clay minerals were exothermic, however. Similar results have been reported for raw Moroccan clays, Na-bentonite and DTMA-bentonite, organoclays and modified-coffee waste (Ozan et al., Reference Özan, Erdem and Özcan2004; Elmoubarki et al., Reference Elmoubarki, Mahjoubi, Tounsadi, Moustadraf, Abdennouri, Zouhri, El Albani and Barka2015; Luo et al., Reference Luo, Gao, Ye and Yang2015; Lafi & Hafiane, Reference Lafi and Hafiane2016). The negative ΔS° value suggests a decrease in the randomness at the solid/solution interface during the adsorption of MO. Also, there are no significant changes in the internal structure of the clay minerals following uptake of the dye molecules (Monash & Pugazhenthi, Reference Monash and Pugazhenthi2009). The negative values of Δ°G indicate that the process is feasible and adsorption is thermodynamically spontaneous.
Table 6. Comparative studies.
CONCLUSIONS
Na+-purified and HDPy+-modified Tunisian clays were investigated for their ability to remove cationic and anionic dyes (CV and MO) from aqueous solutions (Table 6). Analysis by XRD and FTIR confirmed the intercalation of HDPy+ in Na+-clay. The basal spacing of the HDPy+-clay was 43.97 Å corresponding to a paraffin-type bimolecular arrangement.
The Na+-clay is an excellent adsorbent for CV and its modified form, HDPy+-clay, would be suitable for removing MO from aqueous solutions. Adsorption of CV was favoured at basic pH, whereas, adsorption of MO was favoured at acidic pH. For two dyes, the pseudo-second order kinetic model was adequate for representing the kinetic data and the Langmuir model was adequate at representing the equilibrium data. The maximum adsorption capacities were 249.50 mg/g for CV and 226.8 mg/g for MO. The adsorption was spontaneous, favourable, endothermic in the case of CV dye and exothermic in the case of MO dye. These results suggest that adsorption of the cationic dye by the clays could be by means of chemisorption. A physisorption process is proposed for the adsorption of the anionic dye, however.


