


INTRODUCTION
Various South American governments are experimenting with large-scale incentive-based forest conservation programs (Rosa da Conceição et al. Reference Rosa da Conceição, Börner and Wunder2015). Among the countries sharing the Amazon biome, Ecuador has pioneered the Socio Bosque Program, a voluntary forest conservation scheme that transfers cash to rural communities and landowners conditional on setting a defined amount of forestland aside for conservation (de Koning et al. Reference de Koning2011). In Brazil, a law proposal for a national payments for environmental services (PES) program has been under discussion since 2007 (Rugnitz Tito Reference Rugnitz Tito2014). In 2010, inspired by the Ecuadorian experience, the Peruvian government launched the National Forest Conservation Program for Climate Change Mitigation (PNCB, in its Spanish acronym) as one of the flagship programs of the newly established Ministry of Environment (Armas et al. Reference Armas, Börner, Tito, Cubas, Coral, Wunder, Reymond and Nascimento2009; Rosa da Conceição et al. Reference Rosa da Conceição, Börner and Wunder2015). Among other program components (see below), the PNCB involves conditional cash transfers to indigenous communities in the Peruvian Amazon, which we focused on in this study.
We consider PES as voluntary transactions between service users and service providers that are conditional on agreed rules of natural resource management for generating off-site services (Wunder Reference Wunder2015). Conditionality requires service users to be able to monitor adherence to resource-use contracts and sanction non-compliance, for example, by discontinuing payments. Voluntariness, on the other hand, ideally requires that service providers participate only if they reap some net benefits from the scheme. Judged by these criteria, we can classify the cash-transfer component of the PNCB as a PES scheme. Government-led PES programs frequently differ from user-led PES efforts in various respects: they tend to be larger scale, simpler in design (e.g., little payment differentiation) and feature multiple politically determined objectives, rather than focusing unilaterally on environmental goals (Wunder et al. Reference Wunder, Engel and Pagiola2008; Rosa da Conceição et al. Reference Rosa da Conceição, Börner and Wunder2015).
In the literature on PES, much has been debated about potential for simultaneously addressing environmental and social development objectives (Pagiola et al. Reference Pagiola, Arcenas and Platais2005; Wunder Reference Wunder2008; Muradian et al. Reference Muradian, Arsel, Pellegrini, Adaman, Aguilar, Agarwal, Corbera, Ezzine de Blas, Farley, Froger, Garcia-Frapolli, Gómez-Baggethun, Gowdy, Kosoy, Le Coq, Leroy, May, Méral, Mibielli, Norgaard, Ozkaynak, Pascual, Pengue, Perez, Pesche, Pirard, Ramos-Martin, Rival, Saenz, Van Hecken, Vatn, Vira and Urama2013; Wunder Reference Wunder2013). The important role of both scheme design and intervention context as determinants of tradeoff relationships between social and environmental outcomes has previously been highlighted (Jack et al. Reference Jack2008). Early empirical evidence on PES performance suggests small but significantly positive effects on both income and conservation measures (Samii et al. Reference Samii, Lisiecki, Kulkarni, Paler and Chavis2014).
In this study, we chose three sets of performance indicators that are commonly emphasized as policy targets for the design of conservation programs (Angelsen et al. Reference Angelsen, Brockhaus, Sunderlin and Verchot2012) (see below).
1. Cost–effectiveness (efficiency)
To provide good environmental value for money, PES programs should ideally use flexible payment rates (because service provision costs are usually heterogeneous) and target locations where high-value environmental services are under considerable threat (Wünscher et al. Reference Wünscher, Engel and Wunder2008). This boosts the chances for PES to produce truly additional environmental services vis-à-vis a baseline scenario, especially if most prospective recipients do not yet comply with the conditions of payment prior to PES implementation (Persson & Alpizar Reference Persson and Alpízar2013).
2. Poverty alleviation
Many PES programs in developing countries target poor land users for welfare improvements, and sometimes, for electoral factors. Receiving PES should not only increase net incomes of service providers but, depending on contract modalities and program eligibility, also provide various side benefits (Pagiola et al. Reference Pagiola, Arcenas and Platais2005; Wunder Reference Wunder2008).
3. Equity
Establishing a PES scheme can involve negotiations among stakeholders with disparate levels of income, wealth and bargaining power. Incentive-based conservation should thus also carefully consider equity implications in scheme design (Pascual et al. Reference Pascual, Muradian, Rodríguez and Duraiappah2010). If stakeholders widely perceive PES design to be inequitable, the scheme may also functionally fail to become environmentally efficient and provide significant welfare benefits (Pascual et al. Reference Pascual, Phelps, Garmendia, Brown, Corbera, Martin, Gomez-Baggethun and Muradian2014).
In 2010, the Peruvian Government communicated a zero net deforestation target by 2021 to the UNFCCC, as a contribution to the global efforts to mitigate climate change (Brown & Zarin Reference Brown and Zarin2013). In the same year, the Peruvian Ministry of Environment (MINAM) created the PNCB as one means to achieve this target. Its chief objective is to conserve 54 million hectares of tropical forests and to promote the generation of income for the most vulnerable, poor and marginalized populations in the country. This is to be achieved by 2020 via three program components, namely (1) the identification and mapping of forestlands for conservation; (2) the promotion of sustainable production systems that reduce pressure on forests by creating alternative income sources for local communities; and (3) strengthening forest conservation capacities of local governments and people (MINAM 2014). Since its creation, the PNCB has received support from several international sources and is broadening its scope of intervention.
Environmentally conditional cash transfers, or PES payments, are made under program component 2. As a first step, the PNCB began to promote such alternative production systems among the approximately 1250 native communities in the Peruvian Amazon. These mostly indigenous communities hold roughly 12.5 million hectares of titled land. Native communities are considered among the most vulnerable groups in the country (MINAM 2014).
To support the adoption of alternative production systems, the PNCB provides technical assistance and PES incentives of 10.00 New Peruvian Soles (henceforth PEN) per year and hectare of forest that participating communities enroll in the program (PEN 1 ~ USD 0.35 in 2014). The PES transfers are publicly funded and conditional on (1) the community's maintenance of forest cover and (2) the reinvestment of payments into local sustainable production systems agreed upon with the community.
In 2013, 42 communities (373 188 hectares of forest) were enrolled in the program and PES transfers amounted to approximately PEN 8.5 million. According to the program's operational manual, selection criteria include, among others, poverty levels at the province level, the area of remaining forests within the community boundaries, and the potential deforestation pressure due to accessibility to roads, rivers and towns. In principle, however, the PNCB officially aims at eventually enrolling all native communities in the region.
Apart from the primary goal of conserving 54 million hectares of forest, the PNCB's operational manual identifies poverty alleviation among vulnerable native communities as an important expected co-benefit (MINAM 2014). However, the manual also explicitly mentions efficiency and effectiveness as key goals of program monitoring.
In this study, we explored how the specific intervention context and the design of the PNCB's PES component would hypothetically perform in terms of program cost–effectiveness, income effects and equity if the program were to be up-scaled, as intended, to include all native communities in the Peruvian Amazon. After presentation and interpretation of our results, we critically discuss our findings.
METHODS AND DATA
Our study area was the Peruvian Amazon region (Fig. 1).
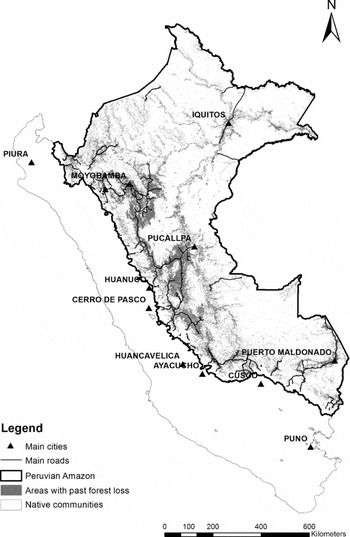
Figure 1 Study area: Peruvian Amazon, native communities and deforestation between 2000–2010.
We implemented an ex-ante economic impact analysis of the PNCB, assuming that it was scaled-up from the pilot stage and offered payments to all native communities in the Peruvian Amazon region. We followed the approach of Börner et al. (Reference Börner, Wunder, Wertz-Kanounnikoff, Tito, Pereira and Nascimento2010) that combined district level agricultural production statistics and spatially explicit land-cover change data to estimate actor-specific forest conservation opportunity costs (i.e., the economic returns foregone from not following the privately first-best forestland clearing strategy), which normally constitute the dominating provision costs of environmental services, and thus also the prime economic obstacle for PES to overcome.
Land users’ opportunity costs were calculated as follows:
 $$\begin{equation}
\prod {_{ik} = \hbox{\it G}{R_{ik}}*\left(1 - \frac{{{c_k}}}{{{b_k}}}\right)}
\end{equation}$$
$$\begin{equation}
\prod {_{ik} = \hbox{\it G}{R_{ik}}*\left(1 - \frac{{{c_k}}}{{{b_k}}}\right)}
\end{equation}$$
where Π ik is the per-hectare profit of crop k in district i, GR are annual per-hectare revenues in i, calculated from agricultural production statistics from the Peruvian Ministry of Agriculture (MINAGRI). b and c are per-hectare revenues and costs, respectively, obtained from the sources documented in Table 1. Note that the parameters in parentheses are not district specific, since production statistics only report total production in terms of value, quantity and average yield per crop. Profits (left-hand side of eqn (1)) for selected crops are reported in Table 2.
Table 1 Data sources for opportunity cost mapping.

Table 2 Average profits for selected crops.
Individual crops k are part of land-use trajectories established after forest clearing. Land-use trajectories can involve a single continuously cultivated crop over the planning horizon T, or two or more sequential crops. Using representative land-use trajectories for the Amazon region (Armas et al. Reference Armas, Börner, Tito, Cubas, Coral, Wunder, Reymond and Nascimento2009), net present values (NPV) of any crop sequence Kj in a district is given by:
 $$\begin{equation}
\hbox{\it NP}{V_j} = \sum\limits_t {\frac{{\prod {_{k = 1,\,t = 1}} }}{{{{(1 + r)}^{t = 1}}}} + \frac{{\prod {_{k = 2,\,t = 2}} }}{{{{(1 + r)}^{t = 2}}}} + \cdots + \frac{{\prod {_{k = {K_j},\,t = T}} }}{{{{(1 + r)}^{t = T}}}}}
\end{equation}$$
$$\begin{equation}
\hbox{\it NP}{V_j} = \sum\limits_t {\frac{{\prod {_{k = 1,\,t = 1}} }}{{{{(1 + r)}^{t = 1}}}} + \frac{{\prod {_{k = 2,\,t = 2}} }}{{{{(1 + r)}^{t = 2}}}} + \cdots + \frac{{\prod {_{k = {K_j},\,t = T}} }}{{{{(1 + r)}^{t = T}}}}}
\end{equation}$$
where NPVj is the net present value per hectare of land-use trajectory j, and k depicts the sequence of land uses in a planning horizon with T = 10 years. Note that Kj can involve the same crop throughout T or multiple types of land uses following each other. The district-level NPV is then calculated as follows:
 $$\begin{equation}
\hbox{\it NP}{V_i} = \sum\limits_t {\frac{{\sum\nolimits_t {{s_j}NP{V_{ij}}} }}{{{{(1 + r)}^t}}}}
\end{equation}$$
$$\begin{equation}
\hbox{\it NP}{V_i} = \sum\limits_t {\frac{{\sum\nolimits_t {{s_j}NP{V_{ij}}} }}{{{{(1 + r)}^t}}}}
\end{equation}$$
where NPVi is NPV per hectare in district i, s is the share of land-use trajectory j in the district's total annual cropland expansion, NPVij is NPV of land-use trajectory j in i, and r is the discount rate (set to 10% in this study). sj are defined for each district based on the historical land-use mix. This approach helped us explore how alternative PES modalities would have played out in terms of the three outcome measures defined in the ‘Introduction’ section if the program were scaled-up to the regional level. In a forward-looking scenario, the shares of land-use trajectories are unlikely to remain fixed over time and scenario outcomes would be influenced by both PES modality and changes in the land-use mix resulting from price shifts. Moreover, it is known that opportunity costs calculated by way of eqns (1–3) are highly sensitive to variations in output prices, yield levels and assumptions about future preferences, that is, the discount rate used to calculate NPV (Börner et al. Reference Börner, Wunder, Wertz-Kanounnikoff, Tito, Pereira and Nascimento2010). We explore the effect of output price uncertainty further in the ‘Results’ section.
Note that native communities tend to be located farther away from public infrastructure than most other agricultural production sites. Hence, if we assumed district average agricultural rents to apply across entire districts, we would overestimate the conservation opportunity costs of the PNCB's target population. To address this potential source of bias, we rely on von Thünen's widely accepted notion that agricultural rents tend to decline with growing distance to markets (Angelsen Reference Angelsen2010).
No consistent set of field survey data exists to calibrate a regionally consistent distance adjustment function. We thus relied on survey data collected in the Selva Central region of the Peruvian Amazon to derive a stylized distance adjustment function, which we assumed to apply region wide. Transport infrastructure conditions in the Selva Central were somewhat better than in remote parts of the Peruvian Amazon, but our sample also included villages that required several hours of boat travel. The survey covered general farm characteristics, and was conducted in 2011 among 223 farm households, selected randomly from four distance strata. After characterizing the sample farms from the first survey round, we revisited five representative farm households from each strata for in-depth interviews on agricultural production costs and benefits. Net revenues for all production systems consistently declined with distance to local markets, following the exponential functional relationship depicted in eqn (4):
 $$\begin{equation}
NP{V_{il}} = NP{V_i}\quad {e^{ - 0.001{X_l}}}
\end{equation}$$
$$\begin{equation}
NP{V_{il}} = NP{V_i}\quad {e^{ - 0.001{X_l}}}
\end{equation}$$
where Xl is the travel time in minutes from grid cell/to the capital of district i and NPVi is that district's average conservation opportunity cost.
The parameter -0.001 in eqn (4) represents the average effect of an increase in market distance (X) on net returns from the production systems in our sub-sample of farms. Assuming average levels of opportunity costs in the Peruvian Amazon (~PEN 4000, see ‘Results’ section), eqn (4) suggests that a one-hour increase in farm-to-market transportation time reduces per-hectare net revenue by 5.8% or PEN 233. Considering studies in similar contexts (Vosti et al. Reference Vosti, Braz, Carpentier, d'Oliveira and Witcover2003; Bowman et al. Reference Bowman, Soares-Filho, Merry, Nepstad, Rodrigues and Almeida2012), we found this to be a plausible adjustment for transport costs.
At the district level, we used the relationship in eqn (4) to downscale average opportunity costs to a 4 × 4 km grid cell resolution. Downscaling involves first calculating the average travel time per district, as the average of the shortest travel time from each grid cell to the nearest city. Second, we assigned the result from eqn (3) to the grid cell whose travel time most closely corresponds to the district average. For all other grid cells in a given district, NPVi is adjusted according to eqn (4).
Opportunity costs calculated as outlined above are key to the scenario-based impact assessment that we present. We focused on three types of potential outcome measures (see below).
1. Cost–effectiveness
We calculated the amount of avoided deforestation through PES vis-à-vis average annual forest loss in each native community (historical baseline). We assumed that deforestation is avoided whenever the payment per hectare of PES-contracted forestland exceeded its corresponding opportunity cost. In the absence of a more detailed empirical basis for modelling complex land-use decisions (Babigumira et al. Reference Babigumira, Angelsen, Buis, Bauch, Sunderland and Wunder2014), this theory-based simplification allowed us to simulate land-use responses to alternative payment modalities.
2. Income effects
We scrutinized changes in average net landholder income from PES transfers, measured for all households affected by the program. Within each native community, we assumed that transfers of net opportunity costs were distributed equally among all households. Then net income change was the difference between the total amount of payments received per household and the total opportunity cost of avoided deforestation. Hence, if payments merely compensate for opportunity costs, net income change is zero. As per the assumption under (1) above, income change cannot be negative.
3. Equity
We followed Pascual et al. (Reference Pascual, Muradian, Rodríguez and Duraiappah2010) in focusing on potential distributive outcomes, rather than procedural justice. We thus calculated the Gini coefficient for the net income changes derived under (2). By calculating the Gini coefficient this way, we implicitly assumed that the policy goal is to share net program benefits equally across participants. We believe this is a reasonable assumption for a tax-financed public conservation initiative. Alternatively, however, it could be that a conservation program explicitly aims at redistributing income towards poor participants. In that case, the Gini coefficient would have to be calculated based on changes in total income, which unfortunately we do not have data for.
While we believe that our stylized model of the PNCB is adequate for an ex-ante regional impact assessment, several limitations are worth noting. First, for the sake of comparability, we deliberately modelled cost–effectiveness and income change at the household level, whereas the PNCB operates at the community scale. Moreover, our approach assumed, for simplicity, that annual cash transfers directly translate into conservation incentives, whereas the PNCB requires communities to also invest cash transfers in alternative production systems. Finally, the model did not capture asymmetries in access to information and bargaining power that may result in suboptimal benefits and cost sharing arrangements (Corbera et al. Reference Corbera, Kosoy and Martinez Tuna2007).
RESULTS
Opportunity costs of avoiding deforestation
Conservation opportunity costs proved to be spatially quite heterogeneously distributed (Fig. 2). They were particularly high around major cities and along main roads that connect to the Andean region. Native communities, with few exceptions in the central Peruvian Amazon, tended to be located in regions with low to medium-level opportunity costs (Fig. 3). Comparison with Fig. 1 shows that areas of high opportunity costs widely coincided with past deforestation hotspots, with only a few exceptions. For example, in the northeastern part of the Amazon, deforestation occurred around the rather isolated city Iquitos (Fig. 1), where conservation opportunity costs are relatively low (Fig. 2).

Figure 2 Distribution of conservation opportunity costs in the Peruvian Amazon.

Figure 3 Avoided deforestation cost curve.
The mitigation supply curve (Kindermann et al. Reference Kindermann2008) for native communities was depicted by sorting average annual deforestation in each native community during the pre-PNCB period (2000–2010) in ascending order of opportunity costs. For each level of per-hectare PES transfers, the curve (Fig. 3) shows the potential amount of avoided annual deforestation. For example, at an annual payment of PEN 4000 per hectare, all communities with opportunity costs below PEN 4000 per hectare would jointly choose to avoid deforestation of somewhat less than 5000 hectares annually.
Native communities on aggregate deforested annually approximately 15 000 hectares, or less than 1% of their total forest stock (maximum amount on x-axis in Fig. 3). Most of it occurred at the low-to-medium end of opportunity costs, in the PEN 2000–6000 per hectare range, although variation of opportunity costs within communities can be quite large (light grey areas Fig. 3), resulting from distance-dependent variations in opportunity costs within community boundaries. The relatively steep initial increase of the cost curve suggests that in any fixed per-hectare approach to conservation payments, the producer surplus is likely to be large: providers at the lower end are likely to become ‘overpaid’ vis-à-vis their low costs of avoiding deforestation, thus yielding sizable net gains from participating in PES.
Uncertainty in prices can lead to substantial deviations from the average per hectare opportunity costs (Fig. 3). To gauge the potential effect of such variation we looked at the inter-annual variation in output prices in percentage terms for the crops considered in eqns (1) and (2) over the period 2004–2010. On average these prices varied with a standard deviation of 0.22. The 95% range of variation in per hectare opportunity costs (Fig. 3, dark grey area) assumes that the NPV calculated in eqn (3) varies with the same level of uncertainty following a normal distribution around their mean.
Scenario analysis
We compared the current PNCB design (Scenario 1) to six alternative payment modalities that reflect design recommendations from the PES literature (Wünscher et al. Reference Wünscher, Engel and Wunder2008) and modalities adopted by other PES programs on the ground (Pagiola Reference Pagiola2008; Newton et al. Reference Newton, Nichols, Endo and Peres2012; Börner et al. Reference Börner, Wunder, Reimer, Bakkegaard, Viana, Tezza, Pinto, Lima and Marostica2013) (Table 3). Note that the status quo Scenario 1 is a forest stock-based payment, where communities receive PEN 10 for each hectare of forestland enrolled in the program. As an example, consider that a community with an average historical deforestation record of five hectares per year enrolls 1000 hectares of forestland into the program. Hence, the community will initially receive an annual PES transfer of PEN 10 000. Yet, for this transfer to be an effective conservation incentive, average per-hectare opportunity costs in that community should not exceed PEN 2000.
Table 3 Scenario description.

In all alternative scenarios, payments were either flow based, that is, per hectare of avoided deforestation, or disbursed as a fixed per-household allowance. For comparability, payment levels in all scenarios were set such that they avoided approximately the same amount of deforestation that is avoided in Scenario 1 (the base case), that is, only payment modalities differ.
Conservation effectiveness, measured in hectares of avoided deforestation (by design, similar for each scenario), total costs (i.e., sum of effectuated PES transfers) and the average net benefit per participating household (annual transfer) differed among the seven scenarios (Table 4). Households in communities that did not participate, because the payment did not cover their opportunity costs, were excluded from the calculation.
Table 4 Effectiveness, costs and income effects of alternative payment modalities.

Scenario 1, reflecting the current PNCB design, stands out as the most expensive option in terms of total PES transfers (PEN 92.6 million annually). Correspondingly, it results, on average, in the largest net benefits paid to the households in participating communities (PEN 4067 per household). However, Scenario 2 suggests that the same conservation outcome could theoretically be achieved at a mere 16% of this cost, if PES transfers could be customized to exactly fit land users’ opportunity costs (Table 4). This for analytical purposes extreme scenario reduces the net benefits of land users to zero, and by leaving incomes unaffected it would also not alleviate poverty.
However, even without going to those extremes, significant gains in conservation efficiency can be made vis-à-vis the current PNCB baseline scenario. Any of the fixed per-hectare payment modalities (Scenarios 3–5) could achieve similarly high conservation levels at barely a quarter (around 23%) of the total costs of status quo Scenario 1 (Table 4). Without any sub-regional adjustment, fixed per-hectare payments would contribute to poverty alleviation, with an average net benefit of PEN 501 per household, whereas adjustments at departmental and provincial level reduce PES net benefits to PEN 297 and 197, respectively.
Scenarios 6 and 7, where PES are disbursed irrespective of forest stocks and historical deforestation, represent a middle ground between stock- and flow-based payment modalities, both in terms of total government costs and land-user incomes. A simple fixed annual payment to compliant communities would exhibit only 64% of the total status quo costs and still provide average net benefits of PEN 879 per household (Table 4).
Finally, adjusting the annual per-household payment according to inter-provincial variations in opportunity costs does not, as expected, result in lowering total cost, but slightly increases average net benefits to land users. This is because the amount of deforestation in communities is associated with the number of households. Under the given spatial pattern of opportunity costs that affects the adjustment of per-household payments under Scenario 7, population-rich communities are affected by downward adjustments to a larger extent than small communities. Merely adjusting transfers by variation in average opportunity costs thus leads to higher per-household transfers needed to cover total opportunity costs at the community scale (Table 4).
The current PNCB approach of paying communities exclusively based on forest stocks turns out to be the most cost-ineffective and second-most unequal PES design option (Fig. 4). The chief reason is that communities with large forest reserves and low population densities will receive the largest transfers, whereas communities with less forest and higher population densities will receive smaller transfers. This distribution of transfers also does not fit well with the spatial patterns of deforestation and opportunity costs, which leads to both environmental inefficiencies and unequal net-benefit distribution.

Figure 4 Cost–effectiveness vs. inequality outcomes of alternative payment modalities. HH = Household.
Perfect opportunity-cost pricing (Scenario 2) unsurprisingly performs best in terms of cost–effectiveness and distributional outcome as it achieves conservation at the lowest possible cost by merely compensating for incurred conservation costs, with (across-the-board equally) zero net benefits to landholders. But all three flow-based payment scenarios (3–5), which unlike Scenario 2 are perfectly possible to implement in practice, perform much better than the current design (Scenario 1) on efficiency grounds (Fig. 4). However, the flow-based payments also produce somewhat more unequal distributional outcomes, because large gains accrue only to a small number of households at the leftmost part of the opportunity-cost curve (Fig. 3).
Annual per-household transfers (Scenarios 6 and 7) again turn out to represent the middle ground between the two extremes of stock-based payments and pure cost compensation (Fig. 4). This result is due to the conditions in our study area in terms of native communities’ population densities, deforestation patterns and opportunity costs, and is thus clearly not generalizable. Nonetheless, it suggests that the PNCB could be scaled-up at much lower cost and equal terms than under the current design, if payments per household rather than forest stock-based transfers were being implemented.
CONCLUSION AND DISCUSSION
Using spatially explicit information about how the opportunity costs of forest conservation and historical deforestation are distributed across the Peruvian Amazon region, we have shown that the current design of conservation incentives under the PNCB would be highly cost-ineffective vis-à-vis environmental goals and unequal in terms of net benefit distribution if the current pilot were to be up-scaled to the regional level (Scenario 1). The program could boost cost–effectiveness by 480%, while remaining welfare and distribution-wise neutral if payments were, hypothetically speaking, perfectly aligned with land users’ opportunity costs (Scenario 2). Such a perfect alignment is unrealistic at the regional scale, but most of the evaluated ‘in-between’ alternative design options perform much better than the current baseline approach of fixed stock-based payments – mostly in terms of cost–effectiveness and sometimes also with respect to distributional equality.
The reasons for the inefficiency of stock-based payments are threefold, and mutually reinforcing in ways that are generalizable beyond our case. First, forest resources are distributed unequally among communities. Second, communities differ also in terms of population size. And third, conservation opportunity costs differ substantially across communities. In the Peruvian Amazon, as well as many other tropical forest settings, the first two factors (forest and population size) tend to be negatively correlated, whereas conservation opportunity costs tend to correlate positively with population density (Börner et al. Reference Börner, Wunder, Wertz-Kanounnikoff, Tito, Pereira and Nascimento2010). Forest stock-based payments thus result in disproportionately large (small) transfers to population-wise small (large) communities with low (high) opportunity costs. Unless it was a deliberate objective of the program to transfer large net benefits to certain remote and marginalized communities, the current modality of stock-based payments would appear to be the least attractive PES design option. Even if marginalized communities by design were to benefit more than communities in regions with better market integration, our findings suggest that this goal could be achieved at a much lower cost, by offering payments based on the amount of de facto avoided deforestation (Scenarios 3–5). Examples from PES programs in other Latin American countries indicate that such flow-based payment modalities represent feasible design options (Pagiola Reference Pagiola2008; Alix-Garcia et al. Reference Alix-Garcia, Shapiro and Sims2012).
The three flow-based payment approaches, however, performed poorly in distributional terms in this specific case. Recall that our equality measure only captures net income changes as a result of the PNCB, thus ignoring absolute income distribution. Under flow-based payments, the providers with the lowest opportunity costs will also be those reaping the largest net benefits. Hence, to the extent that low opportunity costs coincide with high levels of poverty, for example, in market-remote locations, this redistributive effect of flow-based payments could be desirable. More research on the different targeted recipients group would be needed to confirm this conjecture.
An alternative design option inspired by conditional cash transfer programs in the social sector is a fixed per-household payment, which has also been adopted in forest conservation, such as the Bolsa Floresta Program in Amazonas State, Brazil (Newton et al. Reference Newton, Nichols, Endo and Peres2012). Our Scenario 6 suggests that fixed per-household payments will be more cost-effective than forest-stock based transfers, and improve equality outcomes vis-à-vis all but the pure cost-compensation scenario. Moving from forest stock-based to simple per-household transfers would thus seem to provide a triple-win option for the PNCB, in terms of total costs, cost–effectiveness and distributional equity.
It is worth emphasizing again that our impact assessment assumed all program participants to follow the same rational decision rule, that is, deforestation is avoided if PES transfers exceed opportunity costs. Hence, our results are context-specific outcomes of the distribution of land, historical deforestation and estimated conservation opportunity costs in the Peruvian Amazon. Moving beyond this standard behavioural assumption would require a much richer but currently lacking database. However, field-based experiments comparing alternative PES modalities suggest that flow-based payments are to be preferred over stock-based transfers also on behavioural economic grounds, at least in terms of conservation effectiveness (Reutemann Reference Reutemann2014). To see why, consider two identical communities A and B that each own 200 hectares of forest of which one is converted to cropland every year. Now A receives a flow-based payment of PEN 2000 to avoid one hectare of forest loss. B receives the same amount, but based on a PEN 10 allowance for each of the 200 hectares of forest stock. The immediate (short-term) disincentive of not complying with the PES contract is much larger for community A than for community B. Community A will forego one full annual payment of PEN 2000, whereas community B only loses PEN 10 (the equivalent of one hectare of forest stock) in the current year, but also in all future years.
How would violations of key assumptions made in our assessment of alternative payment modalities affect our results? First, by assuming perfect compliance and monitoring, we likely overestimated the cost–effectiveness of PES in all scenarios. Due to large variations in travel costs in the Peruvian Amazon, the enforcement costs and effectiveness of PES conditionality may vary over space in an up-scaled program (Börner et al. Reference Börner, Wunder, Wertz-Kanounnikoff, Hyman and Nascimento2014). As a result, payments will be less effective, and net PES benefits larger, in remote communities than in communities located in more accessible sub-regions (other factors being held equal). Especially in the case of forest stock-based payments, considering heterogeneous enforcement effectiveness is likely to exacerbate cost–ineffectiveness and inequality outcomes. PNCB investments in other program components are nonetheless expected to also lead to more effective monitoring and enforcement over time.
Second, by assuming that opportunity costs arise merely through compliance with the conservation requirement of the PNCB, we ignored the additional costs of elaborating and implementing a community investment plan. The implementation costs especially, as well as the chances of welfare and conservation success of such investment plans, can vary substantially across the region. Such variation could affect our results in various unexpected ways. More data and research is needed to appropriately account for the complex effects of community support measures on conservation and distributional outcomes (Weber et al. Reference Weber, Sills, Bauch and Pattanayak2011).
Third, we are aware that opportunity costs, as calculated in this and many other impact assessments, cannot capture all factors determining farm household decisions to convert forestlands. In a recent global-scale study of rural households in forest environments, a number of household and local context characteristics were found to affect forest-clearing decisions (Babigumira et al. Reference Babigumira, Angelsen, Buis, Bauch, Sunderland and Wunder2014). These included access to land and public services, wealth indicators and market orientation. Some, but not all of these factors reflect the economic opportunities associated with forest clearing. For example, for subsistence-oriented native communities with a strong cultural attachment to traditional land-use systems, conservation opportunity costs may not adequately reflect the willingness to accept conservation payments. However, most such contexts are characterized by low rates of forest conversion and should thus not become prime targets of conservation programs.
Lastly, our assessment assumed that collective and individual payments represent equivalent conservation incentives. Yet, intra-community equity outcomes may differ substantially, depending on governance and power relationships. Land users who benefit most from transfers may not necessarily carry the highest opportunity costs. Appropriately modelling intra-community effects at the regional scale would, however, require detailed community-level information on land-use and production systems, which is currently lacking.
ACKNOWLEDGEMENTS
We thank Angel Armas, Elvira Gómez Rivero and Gregor Fischenich for logistical and technical support, as well as discussions that enriched our research. Funding from the Robert Bosch Foundation, the European Commission (grant no. DCI-ENV/2011/269520) and the Forest, Trees and Agroforestry Program (http://foreststreesagroforestry.org/) is gratefully acknowledged.


