1. Introduction
The British Caledonides represent a classic and critical section through an orogen formed during the assembly of Pangea, and include elements that were derived from both the Laurentian and Gondwanan continents during late Neoproterozoic – Palaeozoic development and closure of the Iapetus Ocean (Wilson, Reference Wilson1966; Dewey, Reference Dewey1969; Harland & Gayer, Reference Harland and Gayer1972; Williams, Reference Williams1979; van Staal et al. Reference van Staal, Dewey, MacNiocaill, McKerrow, Blundell and Scott1998; Hibbard, Van Staal & Rankin, Reference Hibbard, Van Staal and Rankin2007). Despite the consensus represented by these syntheses, there remains considerable controversy over the affinities of peri-Gondwanan terranes in southern Britain and Ireland, south of the presumed Iapetus suture along the Solway line (Figs 1, 2). Some (e.g. Landing, Reference Landing, Nance and Thompson1996; Bluck, Gibbons & Ingham, Reference Bluck, Gibbons, Ingham, Cope, Ingham and Rawson1992) have characterized all or most of this area as part of the platformal microcontinent Avalonia; others (e.g. Valverde-Vaquero et al. Reference Valverde-Vaquero, van Staal, McNicoll and Dunning2006; Waldron et al. Reference Waldron, Schofield, DuFrane, Floyd, Crowley, Simonetti, Dokken and Pothier2014a) have equated parts of northern England, NW Wales and SE Ireland with the microcontinent Ganderia, recognized in the northern Appalachians on the basis of its thick Cambrian clastic deep-water succession. More recently Schofield et al. (Reference Schofield, Potter, Barr, Horák, Millar and Longstaffe2016) have suggested that even the Midland platform, classified by all previous workers as part of East Avalonia, has isotopic affinities with Ganderia. Further complicating the issue is the recognition by Waldron et al. (Reference Waldron, Schofield, White and Barr2011) and Pothier et al. Reference Pothier, Waldron, Schofield and DuFrane(2015a) of similarities between Cambrian rocks of the Welsh basin and those of the Meguma Terrane of Nova Scotia (Fig. 1), which they include in a third domain Megumia.

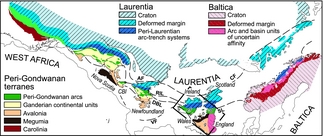
Figure 1. Map of the Appalachian–Caledonide Orogen superimposed on a ‘Pangea’ reconstruction prior to Atlantic opening, after Waldron et al. Reference Waldron, Schofield, Murphy and Thomas(2014b). Locations a–k correspond to samples plotted in Figures 3–5. AF – Appalachian Front; CBI – Cape Breton Island; CF – Caledonide Front; DBL – Dog Bay Line; RIL – Red Indian Line; SL – Solway Line; VF – Variscan Front.
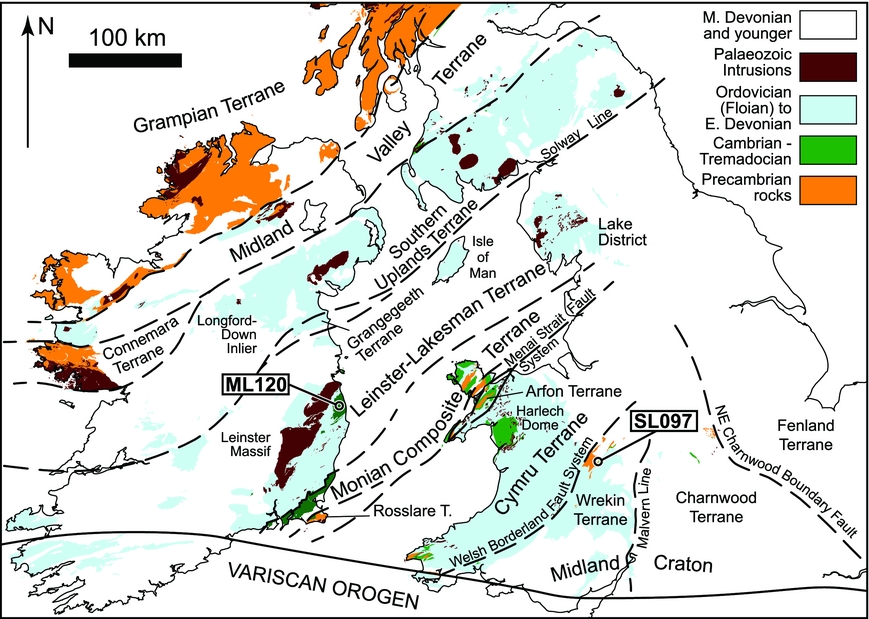
Figure 2. Geological map of Caledonide elements of the geology of Ireland and central Great Britain, showing sample locations ML120 (Bray Group) and SL097 (Red Callavia Sandstone). Terrane subdivisions based on Bluck, Gibbons & Ingham (Reference Bluck, Gibbons, Ingham, Cope, Ingham and Rawson1992), Waldron et al. Reference Waldron, Schofield, DuFrane, Floyd, Crowley, Simonetti, Dokken and Pothier(2014a) and Schofield et al. (Reference Schofield, Potter, Barr, Horák, Millar and Longstaffe2016).
An impediment to the solution of these controversies has been the lack of ‘baseline’ detrital zircon data for the Midland platform. In this paper we characterize the provenance of a critical sample of precisely known Cambrian depositional age from the Midland platform using laser ablation split-stream (LASS) analyses of the U–Pb and Lu–Hf isotopic compositions of zircon grains. This method of analysis allows simultaneous measurement of isotopic ratios in the U–Pb and Lu–Hf systems and has the advantage that precisely the same volume of zircon is analysed by each method. We contrast this sample with previously analysed and new grains from a sample of approximately the same depositional age from the Leinster massif in SE Ireland, previously interpreted as part of Ganderia (Waldron et al. Reference Waldron, Schofield, DuFrane, Floyd, Crowley, Simonetti, Dokken and Pothier2014a). We also compare both samples with existing U–Pb and Lu–Hf data from samples from Avalonia and Ganderia in Atlantic Canada and adjacent areas (Pollock, Hibbard & Sylvester, Reference Pollock, Hibbard and Sylvester2009; Abati et al. Reference Abati, Aghzer, Gerdes and Ennih2012; Willner et al. Reference Willner, Gerdes, Massonne, Van Staal and Zagorevski2014; Pollock et al. Reference Pollock, Sylvester, Barr and Murphy2015).
2. Regional geological setting
2.a. Zones and terranes in the Appalachian–Caledonide Orogen
Many zonal and terrane-based schemes for subdivision of the Appalachian–Caledonide system have been proposed since the work of Williams (Reference Williams1979). A consensus has recently emerged (e.g. Hibbard, Van Staal & Rankin, Reference Hibbard, Van Staal and Rankin2007) that a broad two-fold division of the belt is possible into a northwestern realm, dominated by the Laurentian margin and peri-Laurentian terranes, and a southeastern realm, in which terranes show affinities with Gondwana. The two realms in the British Isles are traditionally separated by the Solway Line (Fig. 1), regarded as the suture along which the Iapetus Ocean closed during the Silurian Period. In contrast, in Atlantic Canada the boundary between the two realms is placed along an Ordovician feature, the Red Indian Line (Williams, Colman-Sadd & Swinden, Reference Williams, Colman-Sadd and Swinden1988). Some Appalachian workers (e.g. Valverde-Vaquero et al. Reference Valverde-Vaquero, van Staal, McNicoll and Dunning2006) have placed a corresponding boundary within the Southern Uplands in the British Isles, suggesting the presence of peri-Gondwanan crust beneath southern parts of the Southern Uplands Terrane. However, Waldron et al. Reference Waldron, Schofield, DuFrane, Floyd, Crowley, Simonetti, Dokken and Pothier(2014a) and Waldron, Schofield & Murphy (Reference Waldron, Schofield, Murphy, Wilson, Houseman, McCaffrey, Doré and Buiter2018) argue that the contrast between the Caledonide and Appalachian sectors reflects a real difference in the number of peri-Gondwanan fragments and the timing of their first arrival at the Laurentian margin. Multiple peri-Gondwanan fragments were present in the Canadian Appalachians, separated by oceanic areas, and the earliest peri-Gondwanan rocks were accreted to Laurentia during Ordovician time; the peri-Gondwanan palaeogeography was simpler in the British sector of the orogen, however, and the two realms were juxtaposed during a Silurian collision.
Numerous distinct terranes have been recognized within the peri-Gondwanan realm, although authors have differed in the classification and grouping of terranes into larger entities. An initial application of the terrane concept to the Appalachians by Williams & Hatcher (Reference Williams and Hatcher1982) mirrored an earlier scheme of zones established by Williams (Reference Williams, Bowes and Leake1978, Reference Williams1979). Williams & Hatcher (Reference Williams, Hatcher, Hatcher, Williams and Zietz1983) grouped the peri-Gondwanan rocks of the northern Appalachians into three terranes: Gander, Avalon and Meguma. The Gander and Meguma terranes were distinguished by thick, predominantly turbiditic early Palaeozoic successions, whereas Avalon displayed thinner, generally shallow-marine facies in the same time interval. Subsequent workers (e.g. Barr & Raeside, Reference Barr and Raeside1989) subdivided Avalon and Gander into smaller terranes. The broader entities identified by Williams (Reference Williams1979) were subsequently formalized as domains (e.g. ‘Ganderia’ and ‘Avalonia’) by Hibbard, Van Staal & Rankin (Reference Hibbard, Van Staal and Rankin2007).
In the British Isles, most terrane-based subdivisions (Bluck, Gibbons & Ingham, Reference Bluck, Gibbons, Ingham, Cope, Ingham and Rawson1992; van Staal et al. Reference van Staal, Dewey, MacNiocaill, McKerrow, Blundell and Scott1998) have included the terranes south of the Solway Line in Avalonia, termed ‘East Avalonia’ to distinguish it from the part in the Appalachian sector. However, Rast, O'Brien & Wardle (Reference Rast, O'Brien and Wardle1976) and Kennedy (Reference Kennedy, Harris, Holland and Leake1979) suggested a correlation between the Gander Group of Newfoundland and the Monian Supergroup of North Wales. This theory was later supported by van Staal et al. (Reference van Staal, Dewey, MacNiocaill, McKerrow, Blundell and Scott1998), Valverde-Vaquero et al. (Reference Valverde-Vaquero, van Staal, McNicoll and Dunning2006) and Waldron et al. Reference Waldron, Schofield, DuFrane, Floyd, Crowley, Simonetti, Dokken and Pothier(2014a), who equated both the Leinster–Lakesman Terrane and the Monian Terrane of the British Isles with Ganderia.
2.b. Isotopic distinctions between terranes
Initial distinctions between terranes in the Appalachians were based on their lower Palaeozoic stratigraphy and faunal provinciality. Increasing amounts of isotopic work have shown that there are also important distinctions between these domains in Precambrian isotopic characteristics and in their Palaeozoic detrital zircon signatures. For example, Nance & Murphy (Reference Nance and Murphy1994, Reference Nance, Murphy, Nance and Thompson1996) showed that Avalonia is characterized by relatively juvenile Sm–Nd isotopic character, whereas adjacent Ganderia is somewhat more evolved (D'Lemos & Holdsworth, Reference D'Lemos, Holdsworth, Hibbard, van Staal and Cawood1995). In contrast to both, material derived from the Grenville and related Mesoproterozic orogens of the Laurentian margin is much more evolved. However, recent results from East Avalonia (Schofield et al. Reference Schofield, Potter, Barr, Horák, Millar and Longstaffe2016) have shown a pattern that is less clear: East Avalonia appears to have more in common with Ganderia than West Avalonia. This suggests that the early Palaeozoic facies belts (the original basis for the terrane definitions) may not have coincided with Neoproterozoic crustal age provinces.
2.c. Detrital zircon provenance distinctions
Traditional methods of distinguishing terranes in the Caledonide–Appalachian system and other orogens have increasingly been supplemented by detrital zircon provenance studies since around the year 2000 (e.g. Cawood & Nemchin, Reference Cawood and Nemchin2001; Cawood et al. Reference Cawood, Nemchin, Smith and Loewy2003). Several authors (e.g. Moecher & Samson, Reference Moecher and Samson2006; Thomas, Reference Thomas2011) have urged caution in interpreting detrital zircon data, as grains may have multicycle histories and may reflect very localized source areas, particularly in fluvial sediments. Nonetheless, major and consistent first-order differences between Laurentian and peri-Gondwanan sources are apparent, particularly in turbidites, suggesting that marine environments more effectively homogenize zircon populations within a terrane (e.g. Waldron et al. Reference Waldron, Schofield, DuFrane, Floyd, Crowley, Simonetti, Dokken and Pothier2014a).
Peri-Gondwanan terranes in both the Appalachians and Caledonides display detrital zircon U–Pb age spectra characterized by large peaks in the age range 540–650 Ma, interpreted to be sourced in Avalonian, Panafrican and Brasiliano orogens associated with the final assembly of Gondwana during late Neoproterozoic – early Cambrian time (e.g. Pollock, Hibbard & Sylvester, Reference Pollock, Hibbard and Sylvester2009; Pollock et al. Reference Pollock, Sylvester, Barr and Murphy2015). Subsidiary clusters of zircon ages at 2.0–2.2 Ga, notable in the Meguma Terrane of Nova Scotia and the Welsh Basin, are interpreted to be derived from the Eburnean Orogen of West Africa or the Trans-Amazonian Orogen of South America. In addition, Ganderian terranes typically show a broad spectrum of minor Mesoproterozic and Palaeoproterozic peaks between 1.2 and 2.0 Ga. In contrast, peri-Laurentian terranes typically display a large concentration of mainly Mesoproterozoic zircon in the range 0.95–1.6 Ga, most characteristically forming an asymmetric peak in probability density plots centred at 1.0–1.1 Ga, interpreted to record derivation from the Grenville Orogen of eastern Laurentia. They typically carry little Neoproterozic zircon, and show conspicuous gaps in the distribution between 2.0 and 2.4 Ga. Waldron, McNicoll & van Staal (Reference Waldron, McNicoll and van Staal2012) and Waldron et al. Reference Waldron, Schofield, DuFrane, Floyd, Crowley, Simonetti, Dokken and Pothier(2014a) have shown that peri-Gondwanan terranes progressively began to receive Laurentian zircon as they approached the Laurentian margin during Palaeozoic time.
The original locations of peri-Gondwanan terranes on the Gondwanan margin remain somewhat speculative. Ganderia is believed to have originated adjacent to Amazonia during Neoproterozoic time, based on its broad range of Proterozoic detrital zircon sources (van Staal et al. Reference van Staal, Dewey, MacNiocaill, McKerrow, Blundell and Scott1998; van Staal, Barr & Murphy, Reference van Staal, Barr and Murphy2012). Several authors have suggested an initial, Neoproterozoic position for Avalonia and the Meguma Terrane adjacent to West Africa (e.g. Nance & Murphy, Reference Nance, Murphy, Nance and Thompson1996; Linnemann et al. Reference Linnemann, McNaughton, Romer, Gehmlich, Drost and Tonk2004; Waldron et al. Reference Waldron, White, Barr, Simonetti and Heaman2009, Reference Waldron, Schofield, White and Barr2011; Pothier et al. Reference Pothier, Waldron, DuFrane, White and Jamieson2015b), again based on overall similarities in detrital zircon populations and, in the case of the Meguma Terrane, based on its position in Pangea reconstructions at the end of the Palaeozoic Era (e.g. Schenk, Reference Schenk1971). Others have suggested a position for the Meguma Terrane adjacent to Amazonia, although in a more outboard position than Ganderia (e.g. Willner et al. Reference Willner, Gerdes, Massonne, Van Staal and Zagorevski2014).
3. Sampled units
3.a. Leinster–Lakesman Terrane
The Leinster–Lakesman Terrane comprises areas in SE Ireland, the Isle of Man and the English Lake District. The Lake District and the Isle of Man are characterized by thick Ordovician and Silurian turbiditic, hemipelagic and volcanic successions, but in the Leinster massif of SE Ireland the succession extends down into the Cambrian (Series 2) Bray Group, consisting of green and maroon turbiditic wacke with subordinate pale quartzarenite and mudstone, up to 4.5 km thick.
The Bray Group is a thick succession of clastic sedimentary rocks with few fossils. However, the presence of the trace fossil Oldhamia indicates an early Cambrian (Series 1 or 2) age, and Brück & Vanguestaine (Reference Brück and Vanguestaine2004) record acritarchs characteristic of Cambrian Series 2, Stage 4. Sample ML120A was collected in the Bray Head Formation, the upper part of the Bray Group in county Wicklow, at a location from which Brück & Vanguestaine (Reference Brück and Vanguestaine2004) recovered the most abundant and diverse acritarch assemblage. This was attributed by them to the Olenellid or Protolenellid/Strenuellid trilobite biozones, approximately equivalent to unnamed stage 4 in the timescale of Peng, Babcock & Cooper (Reference Peng, Babcock, Cooper, Gradstein, Ogg, Schmitz and Ogg2012), and corresponding to an age of 509–514 Ma.
U–Pb results from 101 zircons from this sample were reported by Waldron et al. Reference Waldron, Schofield, DuFrane, Floyd, Crowley, Simonetti, Dokken and Pothier(2014a). The distribution that emerged was identified as typical of Ganderia, displaying a large Ediacaran peak between 540 and 640 Ma representing ‘Avalonian’ or ‘Panafrican’ events, together with a broad range of Mesoproterozoic and Palaeoproterozoic zircons of age 1.0–2.2 Ga. Similar distributions were obtained from Ordovician rocks in the English Lake District and throughout Ganderia, including the Miramichi and St Croix terranes of Atlantic Canada (Rast, O'Brien & Wardle, Reference Rast, O'Brien and Wardle1976; Collins & Buchan, Reference Collins and Buchan2004; Fyffe et al. Reference Fyffe, Barr, Johnson, McLeod, McNicoll, Valverde-Vaquero, van Staal and White2009; Waldron et al. Reference Waldron, Schofield, DuFrane, Floyd, Crowley, Simonetti, Dokken and Pothier2014a). This range of ages has been correlated with sources in the Amazonian craton by van Staal et al. (Reference van Staal, Dewey, MacNiocaill, McKerrow, Blundell and Scott1998) and van Staal, Barr & Murphy (Reference van Staal, Barr and Murphy2012). For this study, we targeted 132 grains on the same mount that were not previously ablated, and determined both their U–Pb and Lu–Hf isotopic compositions.
Cambrian sandstone successions also occur in the Monian composite terrane SE of the Leinster massif, which includes the Cahore Group in SE Ireland and the Monian Supergroup of Anglesey (Fig. 2). These successions are distinguished from those of the Leinster–Lakesman Terrane by a record of significant polyphase deformation and metamorphism, probably during Early Ordovician time, referred to as the Monian Orogeny. A lower-grade Floian overstep succession is much less deformed. Despite these differences, the U–Pb detrital zircon provenance of the Monian and Leinster–Lakesman terranes are closely similar, and are also comparable with those of Cambrian rocks from Ganderia in Atlantic Canada.
The later provenance record of the Leinster–Lakesman Terrane is best documented in the English Lake District, where Waldron et al. Reference Waldron, Schofield, DuFrane, Floyd, Crowley, Simonetti, Dokken and Pothier(2014a) show that ‘Ganderian’ provenance persists at least until latest Ordovician (Hirnantian) time. An influx of contrasting, Laurentia-derived sand, coincident with rapid flexural subsidence (King, Reference King1994) during Silurian (Wenlock) time, marks the onset of collision with Laurentia. In contrast, in some Ganderian fragments in the northern Appalachians, the first indications of Laurentian provenance occur in Ordovician strata (Waldron, McNicoll & van Staal, Reference Waldron, McNicoll and van Staal2012; MacDonald et al. Reference MacDonald, Ryan-Davis, Coish, Crowley and Karabinos2014), showing that fragments of Ganderia crossed the Iapetus Ocean earlier than in the European segment of the orogen (McConnell et al. Reference McConnell, Parkes, Crowley and Rushton2015).
3.b. Midland Platform
Southern Britain south of the Monian Composite Terrane is typically regarded as ‘East Avalonia’. This domain is separated by Bluck, Gibbons & Ingham (Reference Bluck, Gibbons, Ingham, Cope, Ingham and Rawson1992) into the Welsh Basin and the Midland Platform. Beneath the Palaeozoic successions, Pharoah & Carney (Reference Pharaoh, Carney, Carney, Horak, Pharaoh, Gibbons, Wilson and Barclay1987) recognized a number of Ediacaran terranes: the Welsh Basin is underlain by the Cymru Terrane, whereas the Midland Platform is underlain by a western Wrekin Terrane and an eastern Charnwood Terrane.
Previous isotopic work on detrital provenance has been carried out in the Welsh Basin by Waldron et al. (Reference Waldron, Schofield, White and Barr2011) and Pothier et al. Reference Pothier, Waldron, Schofield and DuFrane(2015a), who noted a strong resemblance in both facies and provenance with the Meguma Terrane of southern Nova Scotia in Atlantic Canada, and a link between both terranes and the West African craton. Waldron et al. (Reference Waldron, Schofield, White and Barr2011) grouped the Cymru and Meguma terranes in the larger domain of Megumia, and suggested that they occupied adjacent positions on the margin of the West African craton during Ediacaran–Cambrian time. Detrital zircon U–Pb data in the Midland Platform are limited to a single sample from the Wrekin Terrane analysed by Murphy et al. (Reference Murphy, Fernandez-Suarez, Jeffries and Strachan2004) from sandstone immediately overlying granophyre of age 560±1 Ma which showed a predominance of late Neoproterozic zircon; the small number of Mesoproterozoic grains recovered was insufficient to make any links with other peri-Gondwanan terranes.
Our sample SL079 comes from overlying strata in the same succession, where a condensed section of locally highly fossiliferous Cambrian sandstone and limestone contains interbedded tuff horizons (Harvey et al. Reference Harvey, Williams, Condon, Wilby, Siveter, Rushton, Leng and Gabbott2011). Two tuff horizons, separated by 1.8 m of strata, were dated by Harvey et al. (Reference Harvey, Williams, Condon, Wilby, Siveter, Rushton, Leng and Gabbott2011) at 514.45±0.3 Ma and 509.10±0.22. Our sample was collected from the Red Callavia Sandstone (unit Ca2 of Harvey et al. Reference Harvey, Williams, Condon, Wilby, Siveter, Rushton, Leng and Gabbott2011) immediately above the lower horizon, in the interval bracketed by these two dates. The depositional age is also constrained biostratigraphically, falling within the Callavia zone in the uppermost part of Cambrian unnamed stage 3, slightly older than the most likely age of sample ML120 suggested by Vanguestaine et al. (Reference Vanguestaine, Brück, Maziane-Serrajb and Higgs2002). To our knowledge, no Lu–Hf data have previously been collected from early Palaeozoic rocks in any of the terranes in southern Britain.
4. Methods
4.a. Preparation
Sample ML120A was disaggregated at the University of Alberta using a rock saw to cut the sample into small pieces, followed by reduction to sand-sized particles using a jaw crusher and disk mill. Sample SL097A was reduced to sand-size particles using an electric pulse disaggregator at the University of Western Ontario. A Wilfley table at the University of Alberta was then used to separate dense material, and the dense fraction was then sieved to remove material of dimensions greater than 210 μm. The sample was further reduced using a Frantz magnetic separator to remove magnetic material. Heavy liquid separation with methylene iodide was then used to remove material with a density less than c. 3100 kg m–3. The density of zircon is 4.68 kg m–3 (Nesse Reference Nesse2000). Obvious non-zircon grains (especially pyrite) were removed from the samples by picking. Grains were then transferred onto adhesive tape and mounted in a cylindrical epoxy puck of diameter 1 inch, before being polished to approximately half their average diameter to expose sections through the grains. Grains were imaged using cathodoluminescence to reveal internal structure (zonation, inherited cores, altered rims and inclusions).
4.b. Zircon U–Pb–Hf coupled isotopic analyses
These samples were analysed with using the LASS technique first described by Yuan et al. (Reference Yuan, Gao, Dai, Zong, Guenther and Fontaine2008) and Xie et al. (Reference Xie, Zhang, Zhang, Sun and Wu2008), and further refined by Fisher et al. (Reference Fisher, Hanchar, Samson, Dhuime, Blichert-Toft, Vervoort and Lam2011) and Fisher, Vervoort & DuFrane (Reference Fisher, Vervoort and DuFrane2014). Simultaneous Hf and U–Pb isotope measurements were made in the Arctic Resources Laboratory at the University of Alberta using a Resolution Excimer 193 nm laser operating with an energy fluence of 5 J cm–2 and 10 Hz, using a 33 m diameter spot size. Ablated aerosols were entrained in a He cell gas flow (1000 mL min–1) and subsequently mixed with N2 (10 mL min–1) and Ar (in total 1.8 L min–1) by the mixing chamber from the ablation system. The ablated sample aerosol+He+N2+Ar mixture was split after leaving the laser cell using a Y-piece, diverting the ablation product to two independent mass spectrometers. The length of tubing was equalized such that the ablated sample materials arrived simultaneously at both mass spectrometers. The U–Pb isotope measurements were performed on a Thermo Element-XR 2 mass spectrometer using a single secondary electron multiplier (SEM) detector in peak-hopping mode. Lu–Hf isotope measurements were made on a Thermo Fisher Neptune Plus using multiple Faraday detectors with 1011 Ω amplifiers operating in static collection mode. Analysis time was typically 140 s, consisting of 30 s of background followed by 70 s of ablation and 40 s of sample washout. Both Hf and U–Pb data were processed offline using Iolite v3.32 software (http://iolite-software.com/). Analytical errors are quoted as two standard deviations (SD) or standard errors (SE), representing confidence limits of approximately 95% for normally distributed data.
Four sequences of analyses from SL097A and three from ML120 were collected during 3 days of analyses. Complete results are listed in the online Supplementary Material (available at http://journals.cambridge.org/geo). U–Pb analytical biases were calibrated using both the Plesovîce and 91500 zircon as reference materials. Comparative results from the two normalizations are also shown in the online Supplementary Material. Discordance was calculated as the difference between the two calculated ages as a proportion of the 207Pb–206Pb age. Because 206Pb–238U ages give better analytical precision for younger grains, whereas 207Pb–206Pb ages provide better precision for older grains, the reported 206Pb–238U ages are normalized with the younger standard Plesovîce, whereas the reported 207Pb–206Pb ages are normalized with the older standard 91500. This combined normalization procedure gave slightly larger numbers of concordant results than either standard used alone. Sample SL097 yielded 98 grains (out of 180 analysed) with better than 10% discordance; sample ML120 yielded 97 concordant grains (out of 132). Because both our samples show a gap in the age distribution at c. 800 Ma, we have followed the procedure of Pothier et al. Reference Pothier, Waldron, Schofield and DuFrane(2015a) when plotting age distributions by quoting 207Pb–206Pb ages for grains older than 800 Ma; for younger grains we use the 206Pb–238U age.
Due to the large corrections necessary for the isobaric interference of 176Yb (and 176Lu) on the 176Hf mass, each run included a variety of secondary standards of known age and Hf isotope composition interspersed with unknowns in order to evaluate the accuracy of the interference correction. In this study we monitored the Yb interference correction by analysis of a variety of natural and synthetic zircons, with a wide range of Yb/Hf. Synthetic heavy rare Earth element (HREE) -doped zircons (MUN1 and MUN3; Fisher et al. Reference Fisher, Hanchar, Samson, Dhuime, Blichert-Toft, Vervoort and Lam2011) were evaluated, along with zircon 91500. The measured 176Yb/173Yb ratio was iteratively calibrated to optimize the Yb interference correction, monitored by zircon reference materials with variable Yb contents (91500, MUN1, MUN3).
A specific advantage of the LASS method is that we monitored both the U–Pb signal and Hf isotope ratio in a given ablation simultaneously. Time-resolved slices of data were therefore processed where we are confident that zircon of a uniform age and Hf isotope composition was ablated. Only the most uniform zone in each zircon was included. Where thin internal zones were ablated, or in some cases where zircon grains were polished to less than optimal thickness, the time-slices were short. The average beam integration time for grains with reported εHf in sample ML120A was 19.3 s. For the finer-grained sample SL097, the average integration was 15.7 s. (In thicker grains, higher precisions can be achieved using longer ablation times as shown, for example, by From et al. Reference From, Camacho, Pearson and Luo2018.)
We have used a number of different plotting methods to illustrate the data and compare them with previous work in the Appalachian–Caledonide Orogen. For plotting purposes, data were filtered out that yielded a U–Pb age discordancy between the 207Pb–206Pb and 206Pb–238U age outside ±10% or, in the case of Hf isotopic data, internal precisions on εHf > 2.5 units. Figure 3 displays conventional probability density plots (PDP) for the U–Pb age data, together with various comparison datasets, showing probability density vertically on an arbitrary scale and age on the horizontal axis. Probability density plots have been criticized by Vermeesch (Reference Vermeesch2012); in Figure 4 we therefore also display kernel density estimates (KDE) for the same distributions, using adaptive bandwidth estimated from the distribution of sample ages and using a bandwidth factor equal to the mean sample analytical error (1SD). Because the adaptive bandwidth curves are constructed using the estimated ages to measure the statistical scatter, regardless of the reported analytical precision of individual analyses, the distributions are more broadly smoothed than the PDP curves and show less detail where multiple, reproducible peaks occur in the data. The curves with bandwidth derived from the median sample analytical error resemble the PDP curves but do not strongly emphasize single high-precision ages, the disadvantage highlighted by Vermeesch. In addition, we show the cumulative frequency plots (CFP) in Figure 5, effectively the integral of the PDP, which can be displayed with and without the analytical errors (Guynn & Gehrels, Reference Guynn and Gehrels2010). Results of pairwise Kolmogorov–Smirnoff (K-S) two-sample test comparisons between the compared datasets are included in the online Supplementary Material (available at http://journals.cambridge.org/geo).

Figure 3. Probability density plots for samples reported in this study (bold) compared with published data elsewhere on the orogen constructed in Excel using Isoplot software (Ludwig, Reference Ludwig2003): (a) Redmans Formation, Avalon Terrane, Newfoundland (Pollock, Hibbard & Sylvester, Reference Pollock, Hibbard and Sylvester2009); (b) Dol-cyn-afon Formation, Welsh Basin (Pothier et al. Reference Pothier, Waldron, Schofield and DuFrane2015a); (c) Gander Group, Gander Terrane, Newfoundland (Willner et al. Reference Willner, Gerdes, Massonne, Van Staal and Zagorevski2014); (d) Watch Hill Formation, Lakesman Terrane, England (Waldron et al. Reference Waldron, Schofield, DuFrane, Floyd, Crowley, Simonetti, Dokken and Pothier2014a); (e) Bray Head Formation, Leinster–Lakesman Terrane, Ireland (Waldron et al. Reference Waldron, Schofield, DuFrane, Floyd, Crowley, Simonetti, Dokken and Pothier2014a); (f) ML120A Bray Head Formation, this study; (g) SL097 Red Callavia Sandstone, this study; (h) Rhinog Formation, Welsh Basin (Waldron et al. Reference Waldron, Schofield, White and Barr2011); (i) Church Point Formation, Meguma Terrane, Nova Scotia (Waldron et al. Reference Waldron, White, Barr, Simonetti and Heaman2009); (j) Taghdout, Saghro, Bou Salda and Ouarzazate groups, Anti-Atlas Belt, Morocco (Abati et al. Reference Abati, Aghzer, Gerdes and Ennih2012); and (k) Random Formation, Avalon Terrane, Newfoundland (Pollock, Hibbard & Sylvester, Reference Pollock, Hibbard and Sylvester2009).

Figure 4. Kernel density estimates plotted using bandwidth derived from the data (black line) and bandwidth factor derived from the median analytical error (grey filled curve) using Density Plotter software and methods of Vermeesch (Reference Vermeesch2012). Data sources as for Figure 3.

Figure 5. Compared cumulative frequency plots, constructed in Microsoft Excel using software of Guynn & Gehrels (Reference Guynn and Gehrels2010). Data sources as FOR Figure 3.
For Lu–Hf data, we calculate εHft using present-day chondritic uniform reservoir (CHUR) values: 176Hf/177Hf = 0.282785 and 176Lu/177Hf = 0.0336 (Bouvier, Vervoort & Patchett, Reference Bouvier, Vervoort and Patchett2008). The 176Lu decay constant used is 1.867 × 10¹¹ (Soderlund et al. Reference Soderlund, Patchett, Vervoort and Isachsen2004). For the depleted mantle curve we use present- day 176Hf/177Hf = 0.283226 and 176Lu/177Hf = 0.038550. The assumed initial 176Lu/177Hf ratio of extracted crustal material used for model ages and crustal evolution lines is 0.01. We display standard plots of εHft against U–Pb age in Figures 6 and 7. In these figures, our data (displayed using bold diamond symbols with attached analytical error bars) are superimposed on available previously published comparison datasets from Atlantic Canada. We also reviewed plots of initial 176Hf/177Hf versus age to look for the potential effects of Pb-loss (and hence erroneous age correction) in generating the spread in εHf, and did not detect any obvious effects of Pb-loss.

Figure 6. εHft vs U–Pb age plots for ML120A (top) and SL097 (bottom), with comparison datasets (Abati et al. Reference Abati, Aghzer, Gerdes and Ennih2012; Willner et al. Reference Willner, Gerdes, Massonne, Van Staal and Zagorevski2014; Pollock et al. Reference Pollock, Sylvester, Barr and Murphy2015). Depleted mantle curve uses present-day 176Hf/177Hf = 0.283226 and 176Lu/177Hf = 0.038550. Assumed initial 176Lu/177Hf ratio of extracted crustal material, used for crustal evolution lines, is 0.01.

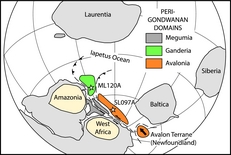
Figure 7. Highly schematic cartoon showing possible terrane relationships of selected peri-Gondwanan terranes in Cambrian time, based on Murphy et al. (Reference Murphy, Waldron, Schofield, Barry and Band2014), Waldron et al. Reference Waldron, Schofield, Murphy and Thomas(2014b) and Pothier et al. (Reference Pothier, Waldron, Schofield and DuFrane2015a,b).
5. Results
5.a. Bray Head Formation
Ninety-seven zircon grains yielded U–Pb ages that passed the 10% discordancy filter, producing a distribution that closely resembles the earlier analysis of different grains from the same sample by Waldron et al. Reference Waldron, Schofield, DuFrane, Floyd, Crowley, Simonetti, Dokken and Pothier(2014a). The distribution (Figs 3, 4) is diverse, including large numbers of Neo-, Meso- and Palaeoproterozoic grains (21, 35 and 34 grains, respectively), together with a smaller number (7) of Neoarchean grains.
Figure 4 shows the kernel density estimate (KDE) plots as proposed by Vermeesch (Reference Vermeesch2012). The KDE plots in which bandwidth was derived from the spread of data points show less detail than the PDP; because the plot derives the uncertainty of peak positions from the wide scatter of ages without taking into account the much tighter analytical precision associated with the individual analyses, it merges the complex Neoproterozoic and Mesoproterozoic populations into four broad peaks. A second KDE (shaded grey in Fig. 4) uses bandwidth equal to the median 1SD analytical error. This plot closely preserves the detail in the distribution, comparable to the PDP, without the disadvantages highlighted by Vermeesch (Reference Vermeesch2012). The cumulative frequency plot (Fig. 5), not subject to the same criticisms, resolves these same details in the distribution.
Within the Neoproterozoic group, peaks can be discerned at c. 560, 590 and 645 Ma, consistent with many other samples from both Avalonia and Ganderia (e.g. Barr et al. Reference Barr, Davis, Kamo and White2003, Reference Barr, Hamilton, Samson, Satkoski and White2012; Murphy et al. Reference Murphy, Fernandez-Suarez, Jeffries and Strachan2004; Fyffe et al. Reference Fyffe, Barr, Johnson, McLeod, McNicoll, Valverde-Vaquero, van Staal and White2009; Waldron et al. Reference Waldron, Schofield, DuFrane, Floyd, Crowley, Simonetti, Dokken and Pothier2014a). Two additional grains at c. 780 Ma complete the Neoproterozoic distribution.
A large Mesoproterozoic population is broadly spread, with subsidiary peaks at c. 1.2 and 1.5 Ga and smaller peaks at 1.0 and 1.3 Ga. Although there are three grains of ‘Grenville’ age, the Mesoproterozoic distribution does not have the negatively skewed shape characteristic of many Laurentia-derived samples. Among the Palaeoproterozoic grains distinct peaks are present at 1.7–1.85 Ga and 2.0–2.2 Ga. The latter peak (n=14) also serves to distinguish the sample from those of Laurentian origin, in which the interval 2.0–2.4 Ga is typically devoid of zircons. Two Palaeoproterozoic grains at 2.4–2.5 Ga and seven grains spread across the Neoarchean age range complete the dataset.
Hafnium isotopic data (Fig. 6) show that the Neoproterozoic grains are widely spread between approximately +10 and –10 εHf units, representing a mix of relatively juvenile material with Neoproterozoic depleted mantle Lu–Hf model ages and older grains with model ages back to 2 Ga. A distinct cluster of results around εHft = 0 corresponds to model ages of c. 1.5 Ga. A second cluster at εHft ≈ –10 shows model ages of c. 1.8 Ga, corresponding to a distinct peak in the U–Pb data. A single grain with an extremely negative εHft value of –32 represents an Archean model age.
Older Proterozoic grains include two with εHft close to the depleted mantle curve, suggesting a small contribution from juvenile sources at c. 1.4 and 1.8 Ga. Many more mature Mesoproterozoic grains lie in a band approximately following a predicted crustal evolution trend from depleted mantle ages in the range 1.4–2.0 Ga, suggesting significant crust formation in the source area during this interval. This band projects towards the most evolved population of Neoproterozoic grains (εHft ≈ –10), suggesting that these crustal sources were reworked in Neoproterozoic magmatism. Palaeoproterozoic grains represent U–Pb ages clustered at c. 1.8 and 2.1 Ga. With the exception of the single juvenile grain mentioned above, most of the 1.8 Ga grains have more evolved εHft values around 0, whereas the 2.1 Ga grains are more juvenile with εHft clustered around +5. In contrast to the Mesoproterozoic population, these Palaeoproterozoic grains do not correspond to a matching group of highly negative Neoproterozoic grains. This distribution suggests provenance of grains from at least two Proterozoic source areas: an area of Mesoproterozoic crust that was reworked by Neoproterozoic magmatism and an older Palaeoproterozoic area that was not so affected. The Neoarchean grain population is dominated by moderately evolved Hf isotope compositions (εHft = 0 to –6), corresponding to Meso- to Palaeoarchean model ages. Projecting this population along crustal evolution lines, four grains with εHft of –12 to –14 suggest that it was reworked during Palaeoproterozoic time at c. 1.8 and 2.0 Ga.
5.b. Red Callavia Sandstone
The sample from the Red Callavia Sandstone on the margin of the Midland Platform shows a contrasting distribution of U–Pb ages to that from the Bray Head Formation. Of the 98 grains that passed the concordancy filter, 13 yielded Cambrian ages. Two separate Cambrian age peaks are resolved in the probability density plot (Fig. 3): a larger group is centred around 538 Ma, while a younger loose grouping of 5 grains yields a weighted average of 509±13 Ma, mean square weighted deviation (MSWD) 2.1, consistent with the depositional age which is constrained between dated tuffs at 514.45±0.3 Ma and 509.10±0.22 Ma (Harvey et al. Reference Harvey, Williams, Condon, Wilby, Siveter, Rushton, Leng and Gabbott2011). An older early Cambrian (Series 1) group of 8 grains has a mean age of 535±4.4 Ma (MSWD 0.5).
The largest number of grains in the sample (62) show Neoproterozoic ages, a much larger proportion than ML120A. Possible peaks in the distribution occur at 560 and 635 Ma, although the small separation of these peaks compared with the typical analytical errors in the analyses makes them difficult to resolve with certainty. A distinct gap between 700 Ma and 1.2 Ga separates these from a much smaller Mesoproterozoic to Palaeoproterozoic population (22 grains) with a small group scattered around 1.86 Ga and a large concentration (10 grains) at 1.96–2.12 Ga. Two Neoarchean grains complete the distribution.
Because the number of clusters in the data is smaller, the KDE using bandwidth derived from the sample distribution shows a similar shape to the probability density plot, although the KDE with bandwidth derived from median analytical precision preserves more of the detail from the PDP. The shape of the cumulative density plot is distinctive, and differs clearly from the sample from the Bray Head Formation, as discussed further in Section 6.b below.
In the Hafnium isotopic data, the Cambrian and Neoproterozoic grains show a wide range of εHft values from +8 to –12, with no clear distinction between the various peaks in the age distribution. Corresponding model ages range from 0.9 to 2.0 Ga. The small number (four) of Mesoproterozoic grains show a relatively restricted range of εHft values from –3 to +4. Their model ages overlap with the most evolved grains in the Neoproterozoic–Cambrian population. In contrast, the larger population of Palaeoproterozoic grains, with a slightly broader range of εHft (mostly from c. –8 to +5), yields model ages of 2.2–3 Ga. These show almost no overlap with the younger groupings of grains, suggesting that they represent crustal material that was brought into the Cambrian sedimentary succession by sedimentary provenance from a Palaeoproterozoic source area, rather than magmatically by incorporation of underlying basement during later plutonism. A single grain at 1.8 Ga shows a remarkably low value of εHft = –26, corresponding to a probable Palaeoarchean model age. This is the oldest model age in the dataset, pre-dating the small group of grains with U–Pb ages older than 2.4 Ga, most of which have Mesoarchean model ages.
6. Implications
In Figures 3 and 5 we compare the U–Pb age data from the samples reported in this paper with each other, and with other detrital zircon datasets from peri-Gondwanan Britain, Ireland, Atlantic Canada and NW Africa. As a caution, we point out that the reported results were collected in different laboratories using different techniques; to our knowledge our study is the first on rocks from the British Caledonides that uses LASS to analyse precisely the same volume of crystal for both isotopic systems. The calculation of εHft is particularly susceptible to errors in the U–Pb age resulting from Pb-loss and analytical uncertainty. In the discussion that follows we therefore focus on general patterns, without attributing significance to single grain results.
6.a. Comparison between U–Pb methods
Because two portions of sample ML120A, the Bray Head Sandstone, were analysed for U–Pb by different methods (individual spot analyses for U–Pb using a multicollector ICP-MS versus LASS using a quadrupole instrument for U–Pb), the results should be compared to illustrate any differences between the analytical methods and the range of variation expected from repeated sampling of the same population. Not surprisingly, the new results are closely similar to the previous dataset using a different subset of grains from the same mount, although the previous analysis shows a slightly smaller proportion of Neoproterozoic grains and a somewhat larger proportion of Palaeoproterozoic grains. To test the significance of these differences, the two distributions were compared using cumulative frequency (Fig. 5) plots and using the Kolmogorov–Smirnoff non-parametric test, as applied to detrital zircon populations by Guynn & Gehrels (Reference Guynn and Gehrels2010) (K-S test results are provided in the online Supplementary Material, available at http://journals.cambridge.org/geo). The two samples pass a two-sample test for similarity at P = 0.468, indicating that the differences are entirely consistent with random sampling from the same population.
6.b. Comparison of SL097 and ML120
Although the two units analysed in this study both bear the hallmarks of peri-Gondwanan terranes with large concentrations of Ediacaran zircon, they differ substantially in their content of older zircon, as shown particularly by the cumulative frequency plots in Figure 5. A K-S test shows that the two samples cannot represent samples drawn from a single parent population. The Red Callavia Sandstone is characterized by a paucity of Mesoproterozoic relative to Palaeoproterozoic zircon and a distinct peak at 2.0 Ga, whereas the Bray Head Sandstone shows a broad distribution of Mesoproterozic zircon including large peaks at 1.5 and 1.8 Ga.
Hafnium isotopic compositions further underscore the differences. Although the Ediacaran populations span approximately the same range of εHft (+10 to –10), the Red Callavia Sandstone grains are strongly skewed towards positive εHft values whereas the young zircons in the Bray Head Sandstone have average εHft close to zero. The Mesoproterozoic population in the Bray Head Sandstone is a little more juvenile than the Ediacaran population; it has no counterpart in the Red Callavia Sandstone. Both distributions contain significant amounts of Palaeoproterozoic zircon, but the larger component (n = 34) in the Bray Head Sandstone is more juvenile, with a conspicuous cluster of grains with positive εHft between +3 and +7; the 18 Palaeoproterozoic grains in the Red Callavia Sandstone, centred at c. 2 Ga, are somewhat more evolved on average (εHft between –8 and +4). The small Archean populations in the two samples are similar.
6.c. Bray Group: comparison with other Ganderia samples
As noted by Waldron et al. Reference Waldron, Schofield, DuFrane, Floyd, Crowley, Simonetti, Dokken and Pothier(2014a), there are close resemblances in detrital zircon populations from peri-Gondwanan sites north of the Menai Straits Fault Zone (Fig. 2) in Great Britain and Ireland, including the Bray Head Sandstone of sample ML120A. The new data for this sample further reinforce the resemblance to, for example, the Watch Hill Sandstone from the English Lake District; a K-S test shows that the Precambrian components in the two samples could have been drawn from the same population. There is also a close similarity to results from the Gander Group obtained by Willner et al. (Reference Willner, Gerdes, Massonne, Van Staal and Zagorevski2014) that were not available to Waldron et al. Reference Waldron, Schofield, DuFrane, Floyd, Crowley, Simonetti, Dokken and Pothier(2014a), although the Gander Group sampled by Willner contains proportionately more Neoproterozoic zircon, with the result that the K-S test rejects the null hypothesis that the two samples were drawn from the same population. However, visual inspection of the overall shape of the curves (Figs 3–5) reveals the close similarity of the older populations. The Gander Group results include Lu–Hf data for 237 detrital zircon grains, which are plotted in Figure 6 as open circles for comparison. The similarity in the distributions is striking. Not only does the large population of Neoproterozoic zircon span approximately the same range of εHft values, but individual clusters of Mesoproterozoic and Palaeoproterozoic grains occur in corresponding locations on the plot, showing similar trends. This suggests that the Leinster–Lakesman Terrane and the Gander Terrane in Newfoundland had closely similar sources in the newly assembled supercontinent Gondwana, confirming a linkage first postulated by Kennedy (Reference Kennedy, Harris, Holland and Leake1979). Following the suggestion of van Staal et al. (Reference van Staal, Sullivan, Whalen, Nance and Thompson1996) we interpret these diverse Mesoproterozoic–Palaeoproterozoic populations as most likely derived ultimately from Amazonia.
6.d. Red Callavia Sandstone: comparison with other East Avalonian and Megumian samples
The distribution from the Red Callavia Sandstone bears a striking resemblance to our sample from the Rhinog Formation (Waldron et al. Reference Waldron, Schofield, White and Barr2011) of approximately the same age from the Welsh Basin in the Harlech Dome, and to certain samples of similar age in the Meguma Terrane of Nova Scotia (Waldron et al. Reference Waldron, White, Barr, Simonetti and Heaman2009). All these samples contain high, but variable proportions of Neoproterozoic zircon, a conspicuously empty region between c. 800 Ma and 1.2 Ga, very small populations of zircon in the age range 1.2–1.9 Ga and then a notable isolated peak between 2.0 and 2.2 Ga, interpreted by Waldron et al. (Reference Waldron, White, Barr, Simonetti and Heaman2009) as representing derivation from the Eburnean Orogen (e.g. Rocci, Bronner & Deschamps, Reference Rocci, Bronner, Deschamps, Dallmeyer and Lecorche1991; Lerouge et al. Reference Lerouge, Cocherie, Toteu, Penaye, Milesi, Tchameni, Nsifa, Fanning and Deloule2006) in the West African Craton. This is confirmed by the general resemblance of these age distributions with those described by Abati et al. (Reference Abati, Aghzer, Gerdes and Ennih2010) from the Anti-Atlas of Morocco, although the proportion of Palaeoproterozoic relative to both Neoproterozoic and Mesoproterozoic zircon is higher in the Moroccan samples. In the CDF curves (Fig. 5), all four samples considered here are characterized by conspicuously flat regions between 700 Ma and 1.7 Ga. However, because of the significant differences in the proportion and age of the Neoproterozoic components in these samples, no two could have been drawn from precisely the same source. Abati et al. (Reference Abati, Aghzer, Gerdes and Ennih2012) also analysed Lu–Hf isotopes from the same samples. Their results are shown as triangles (orange in the online version) in Figure 6. Although there are some similarities between the plots, the data from Morocco show larger percentages of very juvenile zircon in both the large age clusters. The Neoproterozoic population shows significant amounts of zircon with εHft > 10, while the Palaeoproterozoic population contains a distinct trend at εHft > 5, which is absent from the Red Callavia Sandstone. Although we are confident that the West African Craton is the most likely ultimate source for most of the zircon observed in the Midland Platform, as it is for the Welsh Basin and Meguma terranes that were grouped as Megumia by Waldron et al. (Reference Waldron, Schofield, White and Barr2011), the zircon sources must have been somewhat more evolved than the parts of the craton that supplied the Anti-Atlas sediments. Clearly, to further test these comparisons there is a need for Lu–Hf data from the Cymru and Meguma terranes, which we plan as a future project.
All these samples (shown in the lower half of Fig. 3) are distinguished from samples collected NW of the Menai Straits Fault Zone (Fig. 2), and from regions of Atlantic Canada included in the domain Ganderia, by their paucity of Mesoproterozoic zircon. Thus, although the results from sample SL097A support the conclusion of Schofield et al. (Reference Schofield, Potter, Barr, Horák, Millar and Longstaffe2016) that southern Britain contains more evolved continental crust than ‘West Avalonia’, they do not provide support for the suggestion that the Midland Craton was part of Ganderia.
6.e. Red Callavia Sandstone: comparison with West Avalonia, West Africa
The Wrekin Terrane is included in the larger domain Avalonia in most previous Caledonide and Appalachian syntheses (e.g. Hibbard, Van Staal & Rankin, Reference Hibbard, Van Staal and Rankin2007); Avalonia is characterized by cold-water shelf successions with Acado–Baltic fauna in the Cambrian, and by relatively juvenile Sm–Nd isotopic characteristics (Nance & Murphy, Reference Nance and Murphy1994). Recent work (Schofield et al. Reference Schofield, Potter, Barr, Horák, Millar and Longstaffe2016) has however cast doubt on the correlation of ‘East Avalonia’ in Britain with ‘West Avalonia’ in Atlantic Canada. In Figures 3 and 6 we include data from the Avalon Terrane of Newfoundland, the ‘type area’ of West Avalonia. A sample from the early Cambrian Random Formation, of approximately the same age as the Red Callavia Sandstone, shows a tightly clustered age distribution of entirely Neoproterozoic zircon. The peak at 2.0–2.2 Ga, characteristic of Megumia and West Africa, is absent from this sample and all underlying Neoproterozoic samples analysed by Pollock, Hibbard & Sylvester (Reference Pollock, Hibbard and Sylvester2009) and Pollock et al. (Reference Pollock, Sylvester, Barr and Murphy2015); its εHft values are also tightly clustered around +7, significantly more juvenile than our sample.
In contrast to the Cambrian and older samples from the Avalon Peninsula, the Early Ordovician Redmans Formation was shown by Pollock, Hibbard & Sylvester (Reference Pollock, Hibbard and Sylvester2009) to have a much more diverse provenance, including a range of Mesoproterozoic zircon absent from the older samples (Fig. 3). Lu–Hf data are also much more scattered, consistent with the suggestion by Pothier et al. Reference Pothier, Waldron, Schofield and DuFrane(2015a) that this sample, and one of the same age from the Welsh Basin (Dol-Cyn-Afon Formation, Fig. 3) record the onset of an oblique collision between Avalonia and Ganderia during Early Ordovician tectonism on the Gondwanan margin.
Willner et al. (Reference Willner, Barr, Gerdes, Massonne and White2013) reported U–Pb and Lu–Hf data from detrital zircon in early Cambrian rocks from another part of West Avalonia, the Mira Terrane of Cape Breton Island (Fig. 1). Their results contrast with those from the Avalon Terrane in containing a much greater range of Meso- and Palaeoproterozic U–Pb ages and more evolved εHft, more closely resembling our results from the Midland Platform.
Our results therefore suggest that East Avalonia and the Avalon Terrane of Newfoundland were not strongly linked by provenance in the Early Cambrian, and that East Avalonia had access to Palaeoproterozoic zircon sources in Gondwana that were not recorded in the Avalon Terrane of Newfoundland until at least the Ordovician Period. However, other parts of West Avalonia display larger components of craton-derived zircon and may have more in common with East Avalonia (Barr et al. Reference Barr, Davis, Kamo and White2003, Reference Barr, Hamilton, Samson, Satkoski and White2012).
7. Palaeogeographical implications
Early zonal subdivisions of the Appalachian–Caledonide Orogen (Williams, Reference Williams1979, Reference Williams, Bowes and Leake1978) were mostly defined on the basis of Palaeozoic faunal and facies contrasts. Subsequent terrane-based subdivisions (e.g. Williams & Hatcher, Reference Williams and Hatcher1982, Reference Williams, Hatcher, Hatcher, Williams and Zietz1983; Bluck, Gibbons & Ingham, Reference Bluck, Gibbons, Ingham, Cope, Ingham and Rawson1992; Hibbard, Van Staal & Rankin, Reference Hibbard, Van Staal and Rankin2007) incorporated isotopic criteria, particularly based on Sm and Nd isotopes, that revealed contrasts between relatively juvenile and more evolved crustal material. However, there is no a priori reason that Palaeozoic facies belts should have followed earlier belts of contrasting isotopic evolution. In addition, arguments from both detrital zircon U–Pb data and Sm–Nd whole-rock data (e.g. Pollock, Hibbard & Sylvester, Reference Pollock, Hibbard and Sylvester2009; Waldron et al. Reference Waldron, White, Barr, Simonetti and Heaman2009) have suggested that changes can occur in the bulk isotopic composition of sedimentary basins as a result of changes in sediment sourcing over time. A virtue of single-grain isotopic Lu–Hf data is that, in some cases, it allows us to distinguish between: (1) evolved components introduced laterally to a terrane via sedimentary sourcing from a craton; and (2) evolved components introduced vertically from underlying older basement by younger igneous processes.
East and West Avalonia have been classified together because of their platformal, cold-water Palaeozoic successions and Acado–Baltic fauna. Relatively juvenile whole-rock isotopic signatures were identified in both terranes by Nance & Murphy (Reference Nance and Murphy1994) but, more recently, Schofield et al. (Reference Schofield, Potter, Barr, Horák, Millar and Longstaffe2016) have shown that the crust of East Avalonia is significantly more mature. Both our U–Pb and Lu–Hf data confirm this distinction, suggesting a significantly greater Palaeoproterozoic contribution to East Avalonia than West. The Midland Platform shows much greater isotopic resemblance to the Cymru and Meguma terranes included in Megumia by Waldron et al. (Reference Waldron, Schofield, White and Barr2011), despite the much thicker, deeper-water Palaeozoic successions developed on these terranes. All three terranes show detrital zircon links with West Africa; we therefore envisage that the Midland Platform may represent a portion of the Cambrian West African shelf, while Megumia represents an adjacent rift basin or continental slope and rise. The portion of West Avalonia in Nova Scotia shows broadly similar characteristics to East Avalonia and Megumia; in contrast, the Avalon Terrane of Newfoundland shows little evidence of interaction with older cratons prior to the Ordovician Period, when a sudden influx of older zircon appeared in the Redmans Formation (Figs 4, 5; Pollock, Hibbard & Sylvester, Reference Pollock, Hibbard and Sylvester2009). This suggests that the Avalon Terrane may indeed have been an island microcontinent until this time (as proposed by Landing, Reference Landing, Nance and Thompson1996), whereas other terranes included in Avalonia may have lain adjacent to the West African Craton.
The sample from the Bray Group in the Leinster Massif of SE Ireland shows a close resemblance in both its U–Pb and Lu–Hf signatures to other terranes attributed to the domain Ganderia in both Britain and Newfoundland; this reinforces the suggestion that these terranes represent a single region on the margin of Gondwana, most likely adjacent to Amazonia as suggested by van Staal, Sullivan & Whalen (Reference van Staal, Sullivan, Whalen, Nance and Thompson1996), van Staal et al. (Reference van Staal, Dewey, MacNiocaill, McKerrow, Blundell and Scott1998), van Staal, Barr & Murphy (Reference van Staal, Barr and Murphy2012) and many others. However, the post-Cambrian history of the Leinster and Lakesman terranes in the British Isles resembles that of East Avalonia, with which it has been traditionally included. Furthermore, most interpretations (e.g. Woodcock & Strachan, Reference Woodcock and Strachan2000) have suggested that these apparently Ganderian terranes were juxtaposed with the former Cymru and Wrekin terranes at least by Floian time.
Figure 7 shows a scenario which can resolve these apparently contradictory relationships, based on suggestions of Murphy et al. (Reference Murphy, Waldron, Schofield, Barry and Band2014), Waldron et al. Reference Waldron, Schofield, Murphy and Thomas(2014b) and Pothier et al. Reference Pothier, Waldron, Schofield and DuFrane(2015a). In this scenario, the Newfoundland portion of West Avalonia was a block that probably originated as a primitive island arc during Neoproterozoic time in the ocean surrounding the fragments of Rodinia, but entirely separate from those fragments. The passage of this arc remnant westwards past the northern margin of Gondwana during Cambrian and Early Ordovician time resulted in a series of sinistral-oblique collisions involving the various terranes now represented in Avalonia and Ganderia. East Avalonia, and possibly some parts of West Avalonia, initially lay adjacent to West Africa, whereas Ganderia lay adjacent to the Amazonian portion of the Gondwanan margin. Continued sinistral displacement of these terranes led to their eventual separation from Gondwana during Early Ordovician time, either on a single plate (Domeier, Reference Domeier2016) or as a series of fragments which progressively crossed the Iapetus Ocean to be accreted to Laurentia later during Ordovician and Silurian time (Waldron, Schofield & Murphy, Reference Waldron, Schofield, Murphy, Wilson, Houseman, McCaffrey, Doré and Buiter2018).
8. Conclusions
LASS analysis of zircon U–Pb and Lu–Hf isotopic compositions is an effective means of characterizing the age distributions and crustal sources of detrital grains. The distribution of isotopic compositions in an early (Series 2) Cambrian sample from the Bray Group of the Leinster massif in SE Ireland is closely similar to other reported distributions from the domain Ganderia, thought to have originated adjacent to the Amazonian craton in Gondwana. In contrast, a sample from the Cambrian (Series 2) Red Callavia Sandstone, representing a shelf environment in the English Midlands, resembles in its U–Pb age distribution samples of similar age from the deep-water Welsh Basin of north Wales and the Meguma Terrane of Nova Scotia. These results are consistent with derivation from the West African Craton, further east in Gondwana, but further work on the Lu–Hf characteristics of detrital zircon from these terranes is needed. These results show that early Palaeozoic facies boundaries, originally used to characterize terranes, may cross-cut older boundaries based on crustal isotopic characteristics in the peri-Gondwanan Caledonides. Our results show a significant contrast between the Midland Platform and the Avalon Terrane of Newfoundland, both of which are included in Avalonia. These relationships are consistent with a series of oblique collisions between peri-Gondwanan terranes along the margins of Amazonia – West Africa during early Palaeozoic time, followed by dispersal of these terranes into the Iapetus Ocean and their eventual accretion to the Laurentian margin.
Acknowledgements
The authors would like to thank Phil Wilby for donating sample material from the Red Callavia Sandstone collected during the study reported in Harvey et al. (Reference Harvey, Williams, Condon, Wilby, Siveter, Rushton, Leng and Gabbott2011). Instrument time was funded by a CERC grant to Pearson. David Schofield publishes with the permission of the executive director, British Geological Survey. Desmond Moser (Western University) assisted with electrostatic mineral separation. John Waldron acknowledges the help of Chris Fisher for his help in understanding lutetium–hafnium data reduction processes and the construction of the various plots shown in the paper. Completion of the paper was supported during tenure by John Waldron while holding a James Chair at the Department of Earth Science, St Francis Xavier University; the assistance of Brendan Murphy is gratefully acknowledged. We thank two anonymous referees and editor Chad Deering for their helpful comments.
Declaration of interest
This work was supported by NSERC discovery grants RGPIN-2015-04425 to John Waldron; instrument time was funded by NSERC CERC funding to Pearson. David Schofield publishes with the permission of the executive director, British Geological Survey. Conflicts of interest: none.
Supplementary material
To view supplementary material for this article, please visit https://doi.org/10.1017/S0016756818000407