The method of benefit-cost analysis (BCA) has been used to study the effectiveness of preschool programs and other early childhood interventions. These results have been widely reported in the academic literature. Findings from several notable longitudinal studies that have followed children into adulthood have demonstrated that benefits of high-quality well-targeted preschool programs far exceed costs, often by a factor of 7 or even 10 (Belfield et al., Reference Belfield, Nores, Barnett and Schweinhart2006; Temple and Reynolds, Reference Temple and Reynolds2007; Barnett and Masse Reference Barnett and Masse2007). Economists have estimated the internal rates of return of these programs to be between 5% and 18% (Heckman et al., Reference Heckman, Moon, Pinto, Savelyev and Yavitz2010; Reynolds et al., Reference Reynolds, Temple, White, Ou and Robertson2011b ).
Combined with academic interest in James Heckman’s (Reference Heckman2006) theoretical work on skill formation and a growing awareness from neuroscience about the importance of early environments, the high rates of return from BCAs of early childhood programs have been cited as rationale for actual or proposed spending increases for public preschool programs over the last decade or more (e.g., Mervis, Reference Mervis2011; White House, 2013; CEA, 2014) and have contributed to policy development and program expansion. Currently, 40 states offer state-funded preschool serving 1.4 million children at an annual cost of $5.6 billion. Combined with Head Start, 42% of 4-year-olds now attend public programs (Barnett et al., Reference Barnett2015). Early childhood programs offered on a broader scale including Head Start and some state-funded universal preschool programs have been subjected to BCA with studies also suggesting that the benefits may exceed costs but by a smaller margin (Kline and Walters, Reference Kline and Walters2015; Bartik et al., Reference Bartik, Gormley and Adelstein2012; Ludwig and Phillips, Reference Ludwig and Phillips2007). These findings are supported by extensive longitudinal studies since the 1960s showing that early gains in school readiness and achievement translate to enhanced adult well-being (Campbell et al., Reference Campbell, Ramey, Pungello, Sparling and Miller-Johnson2002; Consortium for Longitudinal Studies, 1983; Reynolds et al., Reference Reynolds, Temple, Robertson and Mann2001; Schweinhart et al., Reference Schweinhart, Montie, Xiang, Barnett, Belfield and Nores2005).
As a systematic approach to evaluating the benefits and costs of a program or policy with a focus on promoting efficiency in resource allocation, BCA can be undertaken from various perspectives depending on which stakeholders preferences are assumed to matter. The standard approach to conducting a BCA is to use the societal perspective to assess benefits and costs. Discussion of the use of BCA in social policy and early childhood programs more specifically can be found in Vining and Weimer (Reference Vining and Weimer2010) and Karoly (Reference Karoly2012). The societal perspective of early childhood programs involves making a careful accounting of all benefits and costs including those to participants and to the public at large. Disaggregating the various components of benefits allows the analyst to identify which benefits accrue to the participant (and his or her family) and which benefits accrue to the rest of society including the various levels of government. Importantly, the existence of these public or spillover benefits to nonparticipants that can be quantified in BCA helps motivate the economic rationale for government involvement in this program area. Karoly et al. (Reference Karoly, Greenwood and Everingham1998, Reference Karoly, Kilburn and Cannon2005) offer a detailed assessment of several well-studied early interventions separating out the private benefits to the participant and the participant’s family as well as providing separate reports of the governmental benefits realized by taxpayers. A close focus on identifying benefits accruing specifically to the taxpayer is part of the guardian approach as described by Boardman et al. (Reference Boardman, Greenberg, Vining and Weimer2011). From the perspective of the taxpayer or government sector, what matters is the effects of an intervention or policy on government expenditures and tax revenues.
1. Scaling through pay-for-success financing
Beginning in 2011, a number of state and local governments in the United States have been using the results of BCAs as the foundation for a new type of private–public partnership that uses private investments to expand cost-effective public services. Social impact bonds, also called “Pay-for-Success” (PFS) or human capital bonds, are a new innovative financing mechanism that allows for state and local governments to expand cost-effective social services (Liebman and Sellman, Reference Liebman and Sellman2013). The specific goal of PFS is to expand an existing program for which political or economic barriers are perceived to prevent the direct raising of additional tax revenues. The private sector funds the service expansion but the government only repays the investors if desired outcomes are achieved. Importantly, the desired outcomes are defined based on the expected government cost savings. The only benefits considered are government cost savings arising from the successful preventive interventions that lead to a reduction in need for later public spending to address problems that occur later on. Higher tax revenues resulting from higher private earnings may also be considered as a benefit. Social impact borrowing is based entirely on the governmental or guardian perspective in BCA. Under this perspective, benefits to participants and nonparticipants other than taxpayers are not considered.
This paper highlights the crucial role of BCA in motivating this innovative financing mechanism and specifically examines the use of PFS to expand public or nonprofit services for preschool education. We summarize the contributions of PFS as an example of social impact investing in expanding programs with a focus on the Child-Parent Center (CPC) education program currently being scaled in Chicago and other Midwest cities. Strengths and limitations of PFS financing are described, including the use of single metrics such as special education to define success. Future directions are offered for the role of evaluation and BCA in social impact investing.
BCA principles and methods are well established in federal policy making. Executive Order 12866 (White House, 1993), which was reaffirmed in 2011, called for a regulatory review in federal agencies that emphasize analysis of costs and benefits for interpreting laws and improving health and well-being. The Office of Management and Budget (OMB) requires the use of BCA in the annual budget review of individual agencies (Office of Management and Budget, 2008). In 2014, the President’s Council of Economic Advisors (CEA) released an analysis highlighting the economic returns of early education programs as part of the White House Conference on Early Childhood Education (CEA, 2014). Based on the increased influence of BCA perspectives, federal funding for PFS initiatives began in 2012 for projects in the Departments of Labor and Justice. More recently, other departments including Education, Housing and Urban Development, and the Treasury have become involved (Greenblatt and Donovan, Reference Greenblatt and Donovan2013).
While the benefits of high-quality preschool education targeted toward disadvantaged children are multifaceted and may extend for decades, proponents of social impact borrowing typically seek to identify projects in which all or most of the government cost savings exceed program costs within a fairly short time window of anywhere between two to a dozen years. Recent reports suggest that some preschool programs may generate significant early cost savings due to reductions in special education placement rates. These findings have motivated both of the US preschool PFS initiatives currently in operation.
Historically, BCA adopts a societal perspective to valuing benefits, which places a premium on estimating all benefits of a social program (Boardman et al., Reference Boardman, Greenberg, Vining and Weimer2011). In contrast, social impact financing initiatives with a PFS contract are more narrowly focused on government savings for a particular service expenditure (e.g., special education, corrections) that would likely result from increased social, health, or education service investments. For practicality and to reduce the cost of contracting, the focus of the current social impact financing initiatives tends to be on a single or small set of benefits accruing to one level of government or one agency within a government. Consideration of all government benefits accruing to various agencies and levels of government, while theoretically possible, is impractical. In early childhood programs, government savings are likely to accrue for school districts; county, state, and federal corrections departments; state and federal welfare agencies; and revenue departments. Current initiatives, which are considered “proof of concept” endeavors, tend to focus on estimating the cost savings to a single level of government arising from a single outcome or a small set of outcomes. Challenges and opportunities for reliance on private funding to expand cost-effective preschool programs are discussed in the next section.
2. Governmental savings in the CPCs
In the area of early childhood education, benefit-cost analysts focus on identifying categories of benefits that are measurable and monetizable. Karoly et al. (Reference Karoly, Greenwood and Everingham1998, Chapter 3) provides a useful framework in listing possible benefits and disaggregating them according to who receives the benefits. Table 1 contains similar information for the CPC preschool program in Chicago as reported in the BCA by Reynolds et al. (Reference Reynolds, Temple, White, Ou and Robertson2011b ). Findings are based on a longitudinal study that follows a cohort of students who entered kindergarten in 1985 and are now in their thirties. The matched comparison group enrolled in the usual early childhood programs available in the district. In Table 1, the program cost for the typical preschool participant is reported as $9519 in 2014 dollars. This is the present value evaluated at the child’s age of 3 assuming that all children participated at age 4 and 55% at age 3. More detail about the estimation of program costs is found in Reynolds et al. (Reference Reynolds, Temple, Robertson and Mann2002).
Table 1 Government savings from CPC preschool participation in 2014 dollars reported as the present value at child’s age of 3 years.

Note: From Reynolds et al. (Reference Reynolds, Temple, White, Ou and Robertson2011b ) adjusted using CPI-U price index. Welfare costs were not estimateddue to no observed differences between groups. Table 4 in Reynolds et al. (Reference Reynolds, Temple, White, Ou and Robertson2011b ) reports the total social benefits per participant to be $92,220 in 2007 dollars, which is $103,130 in 2014 dollars.
As an established school-based program routinely implemented since the 1960s, the CPC program is a particularly good candidate for expansion through borrowing based on social impact with a PFS contract. Along with the well-known Perry Preschool program which has followed into adulthood children in low-income families in Ypsilanti Michigan who were randomly assigned to a high-quality preschool program (Heckman et al., Reference Heckman, Moon, Pinto, Savelyev and Yavitz2010), CPC has a strong base of peer-reviewed evidence of effectiveness. Unlike the Perry program, CPCs have continued to operate in public school sites in Chicago’s poorest neighborhoods. A federally funded expansion of the CPC program called the Midwest CPC Expansion began in the fall of 2012 under an Investing in Innovation (i3) Grant from the U.S. Department of Education to the University of Minnesota. In the first year, the Chicago Public Schools and four other districts in Illinois and Minnesota served over 2,500 preschool children (Reynolds et al., Reference Reynolds, Richardson and Hayakawa2014). Implementation of the CPC intervention has been established as a school reform model. The Chicago PFS expands the number of preschool sites and student slots offered by the program.
The CPC program is designed to enhance early childhood development in multiple domains of health and well-being. Located within or near elementary schools, the program provides educational and family-support services between the ages of 3 and 9 (preschool to third grade). Within a structure of comprehensive services (education, family, health, and social services), six major components are included: (a) a collaborative leadership team led by the Head Teacher, (b) effective learning experiences (e.g., small classes and a literacy-rich instruction), (c) parent involvement and engagement, (d) aligned curriculum across grades, (e) continuity and stability, and (f) a professional development system of teacher coaching and site support (Human Capital Research Collaborative, 2012).
The effectiveness of the CPC program in Chicago has been evaluated as part of the Chicago Longitudinal Study (CLS; Reynolds et al. Reference Reynolds, Temple, Robertson and Mann2001 and Reference Reynolds, Temple, Ou, Arteaga and White2011a ; Temple and Reynolds, Reference Temple and Reynolds2007), a prospective quasiexperimental study that follows 1,539 children who participated in CPC educational intervention beginning at ages 3 or 4 in the mid-1980s. While the CPC continues today the CLS focuses on a single-aged cohort of participants who are now in adulthood. Impact evaluations using the CLS indicate that high-quality early intervention targeted toward economically disadvantaged children and their parents affects school success especially in terms of reduced special education placement and grade retention, higher rates of high school graduation, reductions in juvenile and adult crime, and a number of other outcomes.
In Table 1, results from the CLS are shown focusing on the CPC’s effects on public savings to various levels of government estimated through age 65. These cost savings are reported in the categories of reductions in government (district, state, and federal) expenditures due to special education placement and grade retention (school district only), as well as the present value of the lifetime flow of higher tax revenues to state and the federal governments that are estimated to accrue due to higher educational attainment of program participants. Also included is the estimated criminal justice cost savings due to preschool’s estimated effect on juvenile and adult crime using actual data observed up to the participant’s age of 26 years and lifetime projections beyond that. The juvenile criminal justice cost savings, which accrues primarily to the county and state, constituted 63% of the total in this category in large part due to the smaller weight placed on adult crime due to discounting.
While an earlier BCA of the CPCs found evidence that participation in welfare receipt such as food stamps and AFDC/TANF were reduced (Reynolds et al., Reference Reynolds, Temple, Robertson and Mann2002), the subsequent analysis based on more years of data, including the recession of the late 2000’s found no statistically significant difference in program participation between the preschool and comparison groups (Reynolds et al., Reference Reynolds, Temple, White, Ou and Robertson2011b ). Unlike a typical preschool program, the CPC program has a strong focus on promoting parent involvement and devotes significant amount of resources toward parent involvement and support. Using administrative data obtained from Cook County in Illinois, researchers have found that parent participation in this education intervention is associated with a reduction in substantiated cases of child abuse and neglect (Reynolds and Robertson, Reference Reynolds and Robertson2003). The cost savings reported in Table 1 accrue mostly to the state and county and represent a weighted average of the costs of in-home and foster care services.
While total social benefits of $103,130 per participant (or $92,220 in 2007 dollars) from CPC preschool participation reported in Reynolds et al. (Reference Reynolds, Temple, White, Ou and Robertson2011b ) are 10.83 times greater than costs, restricting the benefits to include only government savings and added government revenues generates an estimate of the present value of benefits to be $27,455 indicating a benefit-cost ratio of $2.88 to $1. Hence an additional dollar devoted to expand preschool programming offering in the CPCs could be expected to generate $2.88 in government savings alone; the estimated government savings account for 27% of the total social benefit. As a preventive program that more than pays for itself, the benefit-cost ratio of $2.88 to $1 in terms of government savings makes the CPC program a viable candidate for social impact financing with a PFS contract.
The benefits for preschool and preventive interventions more generally have been estimated to extend for decades often through the participants’ expected time of retirement or beyond. Investors and other parties involved in social impact borrowing may prefer investments that have shorter payoff windows. Information is needed on the length of time required for potential cost savings to cover the initial costs of the program. Investors, intermediaries, and government policymakers may not want to commit their organizations to these projects for decades at a time, especially given the newness of this type of financing. Moreover, interest rates might need to be higher to cover the risks associated with longer term investments.
Table 2 Timing of early government cost savings from preschool participation in the CPCs.

Note: Estimates are in 2014 dollars. Present values are calculated at the child’s age of 3 years using a 3% discount rate. By age 18, 14.4% of the program group received special education and 24.6% of the comparison group. More information is provided in Appendix C in Reynolds et al. (Reference Reynolds, Temple, White, Ou and Robertson2011b ).
While Table 1 reports the present value of estimated government savings arising from CPC preschool participation up to age 65, Table 2 highlights the differences in the timing of various benefits of CPC. Because social impact investors are generally interested in projects in which repayment could be expected within a short-to-medium length time horizon, we focus solely on benefits to governments that arise during childhood and adolescence. These government benefits include a reduction in special education placement, reductions in substantiated claims of child abuse and neglect to the county welfare office, reductions in juvenile justice system costs, and a decrease in schooling costs due to a reduction in grade retention. For each category of benefits, information is provided about the assumed timing of the benefit for the purposes of discounting back to the child’s age of 3 years. The third column provides a monetary estimate of the government cost of a single unit of the benefit. This amount is then discounted back to age 3 as shown in column 4. The last column represents the effect of preschool participation from an impact evaluation multiplied by the cost of a unit of the outcome. The information in Table 2 reflects the procedure by which the BCA in Reynolds et al. (Reference Reynolds, Temple, White, Ou and Robertson2011b ) was conducted. The estimated treatment effects are first translated into dollar terms. In BCA, the timing of the benefits and costs then need to be precisely specified because the timing affects the calculation of the present value of benefits and costs.
In the Chicago study, the most common year for identification for special education was at the age of 7. Once identified, the typical special education student received services for 5 years. Hence the estimated reduction in special education of 0.7 academic years was assumed to occur at the child’s age of 12 years. A less conservative assumption was that the CPC program delayed entry into special education; if so, this benefit might have occurred at age 6 or 7 instead.
For child abuse and neglect, the reductions in substantiated claims occurred at various times between ages 4 and 17. We assumed that the estimated reduction occurred at age 10, but in Reynolds and Robertson (Reference Reynolds and Robertson2003) a significant portion of the benefits were observed in the years between 10 and 17. Juvenile crime occurred at various years before age 18 and the assumption was that the program-induced reduction occurred at the midpoint between ages 11 and 17.
Finally, because grade retention adds an additional year to K-12 schooling, it makes sense that the timing of this benefit is at the child’s age of 19 years. Note that none of these individual categories of benefits are large enough by themselves to cover the cost of participation in the CPC program. However, special education savings cover 62% of the costs of preschool and some other more recent studies have led observers to believe that the special education cost savings likely to be observed today are much greater than those reported in Reynolds et al. (Reference Reynolds, Temple, White, Ou and Robertson2011b ).
The timing of the early benefits of early education for the disadvantaged population served by the CPCs presented in Table 2 makes clear that the time at which benefits cover or exceed costs is somewhere in adolescence, perhaps around age 14. Given that students may have started preschool at age 3, the payback period for this early childhood program is about 10 or 11 years long.
Despite the fact that special education cost savings by themselves do not appear large enough to cover preschool costs, some policymakers and policy analysts consider it likely that the estimated cost savings from high-quality preschool programs may be higher that what Reynolds et al. (Reference Reynolds, Temple, White, Ou and Robertson2011b ) have reported based on information from students who attended school in the 1980s and 1990s. Given a higher real cost of special education combined with an increase in the number of students nationwide identified in the category of specific learning disability, programs that reduce special education placements or reduce their duration have the promise of lowering government costs to school districts, states, and the federal government.
3. Evidence from other preschool studies
The evidence on the effects of preschool programs targeted toward children from low-income neighborhoods on the probability that a child will be assigned to special education as well as information about the duration of special education enrollment for students in general comes from a variety of sources. Researchers studying the High/Scope Perry Preschool program, a small randomized experiment in which 123 children from low-income families in Ypsilanti Michigan were assigned to preschool versus control, report that preschool participation leads to a 1.3-year reduction in the duration of special education. This estimated treatment effect is almost twice as large as is reported in the Chicago study. A more recent study by Muschkin et al. (Reference Muschkin, Ladd and Dodge2015) followed students in North Carolina before and after the rollout of two state-funded early childhood programs. One program provided funding for preschool for disadvantaged 4-year-olds while the other funded improvements in the quality of child care from ages 0 to 5. Using county-level data on state expenditures for these programs, Muschkin et al. find that the two programs together lead to a 39% reduction in the odds of special education placement as of third grade.
Two additional studies on the effects of preschool participation on special education have been cited by social impact bond advocates as demonstrating that preschool programs can have significant effects on special education placement decisions in kindergarten. As described in Duggar and Litan (Reference Duggar and Litan2012) and Dubno et al. (Reference Dubno, Duggar and Smith2013), children who participated in publicly funded preschool programs (the Utah High Quality Preschool and Pennsylvania’s PreK-Counts programs) had a 2% or 3% probability of being placed in special education in kindergarten compared to an 18% rate for children who did not participate in preschool. Dubno et al. (Reference Dubno, Duggar and Smith2013) use the estimates from Utah as the foundation for a detailed set of estimates of potential state government special education cost savings from preschool participation under varying assumptions of kindergarten placement rates.
Although preschool education may lead to a reduction in special education placement in kindergarten, most students are not identified for services until a couple of years later (e.g., Hibel et al., Reference Hibel, Farkas and Morgan2010; Holt et al., Reference Holt, McGrath and Herring2007; Reynolds et al., Reference Reynolds, Temple, White, Ou and Robertson2011b ). Various estimates from different sources indicate that the duration of special education services may vary by state or school district, disability category, and data source. Several studies including Holt et al. (Reference Holt, McGrath and Herring2007) and Hibel et al. (Reference Hibel, Farkas and Morgan2010) have analyzed nationally representative data on US school children from the United States Department’s Early Childhood Longitudinal Study (ECLS)-Kindergarten cohort, which follows a single cohort of children who were enrolled in kindergartens in 1998–99. Hanushek et al. (Reference Hanushek, Kain and Rivkin2002) use data from all public school students in Texas to show the variation in special education placement rates by disability type and grade. Evidence specifically on the duration of placement for students in a special education preschool program is reported by Jenkins et al. (Reference Jenkins, Dale, Mills, Cole, Pious and Ronk2006) for a small sample of students in Washington State. By age 19, 60% of the students were still receiving services as of the end of high school.
Understanding the effect of early childhood programs also requires knowledge of which categories of special education are not likely to be affected by early intervention (e.g., physical disability) and which categories might be (e.g., specific learning disability, speech impairments or perhaps emotional and behavior disturbances). The Utah study assumes that 80% of the classification decisions of special education students will be affected by preschool participation. The fastest category of special education, specific learning disabilities, is described by some education researchers as being entirely preventable and also is the category with the most subjective classification decisions (Muschkin et al., Reference Muschkin, Ladd and Dodge2015; Greene, Reference Greene2007). The duration of placement in special education may vary across disability type, with students in the speech impairment category typically only needing a couple of years ofservices.
3.1. Previous comparisons of the cost reductions in special education to the cost of preschool.
A few studies have reported explicitly on the magnitude of the benefits of special education expenditure reductions compared to the costs of preschool. Belfield’s (Reference Belfield2005) simulations of the effects and costs of targeted versus universal preschool in Pennsylvania predicted that the savings from reduced special education arising from an expansion of publicly funded preschool will cover approximately 16% to 31% of the cost of preschool. On the other hand, Chase et al. (Reference Chase, Coffee-Borden, Anton, Moore and Valorese2008) estimate that the special education savings arising from a 2-year preschool program in Minnesota might cover only 6% of the preschool costs. A newer study of the effects of preschool and early childhood programming on placement in special education is by Muschkin et al. (Reference Muschkin, Ladd and Dodge2015). Regarding the state-funded slots for preschool for low-income 4-year-olds, in a rigorous panel data study that made use of differential rollout of early childhood funding across counties and overtime, Muschkin et al. reported that a preschool program serving low-income students that cost an average of $1100 per child in each county (not per preschool participant) was associated with a reduction in special education services saving $200 in third grade year per each child in the county.
While Muschkin et al. (Reference Muschkin, Ladd and Dodge2015) did not report special education placement in the years before third grade, speculative evidence assuming that each child observed in special education in third grade has also been enrolled in kindergarten through second grade suggests that the potential cost savings of the 4-year-old preschool program may be enough to cover the preschool costs. The program offering improvements to child care quality for ages 0 to 5 also costs $1100 on a per child in the county basis (not per child served) on average over the 5 years of services but had a significantly smaller effect on third-grade special education placement.
4. Social impact financing through PFS
Since 2011, eight US states or localities have launched PFS initiatives with active discussions taking place to implement many more. In each of these projects, private-sector investors have loaned anywhere from $4 million to over $20 million to social service providers to expand services in areas including recidivism, homelessness, adult education, maternal and infant health, and preschool education. If program participants meet certain pre-established outcome targets, then states, cities, school districts, or counties promise to pay back the private investors. Although this new financing mechanism is referred to as a social impact bond, the initiatives to date all take the form of loans in which investors are scheduled to be paid back on various dates if outside evaluators are able to confirm program success. Social impact borrowing is described in greater detail by Liebman (Reference Liebman2011), Liebman and Sellman (Reference Liebman and Sellman2013), and Warner (Reference Warner2013). A website maintained by the Nonprofits Assistance Fund at payforsuccess.org contains up-to-date information on ongoing and planned initiatives.
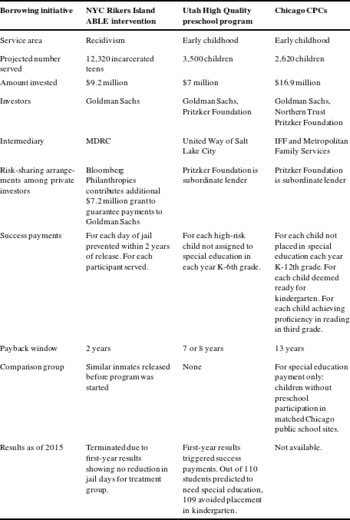
Table 3 Description of three social impact borrowing initiatives 2011–2014.

For the purpose of illustration, Table 3 describes the details associated with the first PFS initiative in the United States as well as the two ongoing projects in the area of early childhood. Following the lead of the first PFS that was created to fund programs in Peterborough prison in the United Kingdom, the first US PFS financed the expansion of an existing program for youthful offenders at New York City’s Rikers Island (Rudd et al., Reference Rudd, Nicoletti, Misner and Bonsu2013; Olson and Phillips, Reference Olson and Phillips2013).
Recognizing that 50% of youthful offenders return to prison within 2 years of release, a social impact borrowing arrangement with a PFS contract was set up with the City of New York and the Goldman Sachs investment bank. The social and emotional skills ABLE intervention offered by a nonprofit service provider serves teen offenders between 16 and 19 years old. Once released, the hope is that these adolescences will not return to jail. Goldman Sachs loaned an intermediary $9.2 million to contract with the service provider. An external evaluator obtains information for each participant on how many subsequent days are spent in jail within 2 years of release. The reports by Rudd et al. (Reference Rudd, Nicoletti, Misner and Bonsu2013) and Olson and Phillips (Reference Olson and Phillips2013) contain detailed information on how the success payments are structured based on the number of jail days avoided for the participants relative to a control group. A second type of payment is based on participation only and is made regardless of the recidivism outcomes. As the first US example of social impact investing with a PFS contract, the Rikers Island initiative inspired other states and localities to consider expanding recidivism services as part of a social impact bond. However, when the first-year evaluation by the Vera Institute of Justice (2015) found that the social and emotional skills intervention failed to reduce recidivism among the participants as compared to a matched comparison group, the Rikers Island social impact initiative was terminated.
5. Utah and Chicago preschool PFS initiatives
The second social impact financing initiative with a PFS contract in the United States was created to expand preschool and again involved Goldman Sachs along with a philanthropic foundation. Local and state policymakers were motivated to expand the Utah High Quality Preschool program offered by school districts and nonprofit organizations in Salt Lake and Granite Counties. Given the research evidence suggesting that the averted costs of special education may equal or exceed the costs of preschool, the private investors contributed $7 million to expand preschool slots. Success payments in Utah were based entirely on the state share of the cost savings for special education. Because the state government had not agreed to make these success payments as the project was being launched, Salt Lake County agreed to make the payments in the first year. Believing that the probability of placement in special education was extremely high for children who scored below a 70 in the Peabody Picture Vocabulary Test (PPVT), the success payments which are to be made by the County (first year only) and then the state equal to $2470 for each child in this low range of the PPVT, who later avoids special education placement during each year in kindergarten through sixth grade. If the loan is not repaid by the end of the participating student’s sixth-grade year, then smaller additional success payments will continue to be made each year based on avoidance of special education among the high-risk subgroup of preschool participants. In October 2015, results from the Utah High Quality Preschool social impact bond indicated that success payments of well over $200,000 to the investors were made as a result of success of the preschool program in reducing special education placement rates. Of the 110 high-risk preschoolers predicted to need special education services in the absence of the preschool program, only one student was placed in special education in the kindergarten year (United Way of Salt Lake, 2015).
Expanding the Chicago CPCs is the objective of the fifth social impact borrowing initiative in the United States. Given the research by Reynolds et al. (Reference Reynolds, Temple, Ou, Arteaga and White2011a ,Reference Reynolds, Temple, White, Ou and Robertson b ) and recent U.S. Department of Education-funded efforts to expand a revised and more comprehensive CPC program in various Midwest locations (Human Capital Research Collaborative, 2012) as well as research on high-quality preschool programs in general, Goldman Sachs, the Northern Trust and the Pritzker Foundation contributed $16.9 million to expand the number of CPC centers and preschool slots for children living in low-income neighborhoods. While Tables 1 and 2 indicated that the CPC preschool program costs in an earlier decade were not entirely paid for by the cost savings associated with special education placement reductions, private investors were still willing to expand funding based on indications by education policymakers and researchers that the benefits of preschool participation may be higher in the current climate. Note that modest changes in the estimates of the CPC program could lead to the special education savings entirely covering the preschool costs. In Table 1, for example, an increase in the program effect on special education duration by 30% combined with a 30% increase in real savings would lead to preschool covering its own costs in special education savings.
For each child in the CPC program who avoids special education in kindergarten through 12th grade relative to a comparison group of children who did not participate in preschool, the school district will make a success payment of $9100 per child per year representing the district share of special education costs. This estimate represents a weighted average based on different types of special education services delivered. The Chicago social impact bond involves two additional indicators that will trigger success payments. For each CPC participant who is deemed kindergarten ready at the start of elementary school, the City of Chicago will pay the investors $2900. Moreover, for each child meeting the standards for proficiency in reading in third grade, the City of Chicago will pay $750.
It is possible that projects funded by these PFS social impact initiatives will not meet their success targets. If so, in the current social impact initiatives, only the investors lose as governments only pay if success targets are reached. The risk-sharing arrangements vary across the PFSs currently in operation. Table 3 describes an arrangement in the Rikers Island contract in which a philanthropist contributes a sizable amount to guarantee the private investment. In the preschool social impact bonds, no philanthropist guarantees the investments but the Pritzker Family Foundation has agreed to be the subordinate lender meaning that they will be the last to be paid back and hence will bear most of the performance risk.
6. Limitations of special education as a success metric
Using special education placement as the trigger for success payments potentially is problematic due to the subjective nature of identification decisions. As Liebman (Reference Liebman2011) explains, the participants in the social or educational services being funded should not be harmed by social impact investing. Will children in need of special education services not be served due to the incentives inherent in PFS contracting? Cullen (Reference Cullen2003) finds special education identification decisions to be highly sensitive to changes in funding formulas. About the category of specific learning disability that is the fastest growing category of special education as well as the category (along with speech impairments) that may be the most amenable to early intervention, Hanushek et al. (Reference Hanushek, Kain and Rivkin2002) writes “This category encompasses a continuum of learning conditions where it is difficult to describe and to apply precise cutoffs in evaluation and assessment. This discretion also leads to considerable variation in classification rates across states, districts, and time.” Others have expressed concern about the timing of the identification of learning disabilities for dual language learners. Hibel and Jasper (Reference Hibel and Jasper2012) express concern that special education placement may be improperly delayed for dual language learners.
In Utah, concerns about causing harm by failing to place needy students in special education is believed to be mitigated by the fact that the decision to identify a student for special education services at the school level seems to be fairly removed from the financial incentive that the state government might have to not identify a student for services. Moreover, the teachers in elementary school may not know which students are participating in the study. In Chicago, including kindergarten readiness and success in third-grade reading as additional success indicators and payment triggers means that these important outcomes will also be tracked and publicly reported. Hopefully, this helps mitigate any incentive the district might have to informally alter the subjective thresholds for special education identification.
Another limitation of using special education placement as the primary cost savings metric is that it is likely to underestimate the true cost savings from the program. In the CPC study, for example, special education savings are only one-quarter of the government savings (Table 1). Unmeasured savings in child welfare, crime prevention, as well as increased economic well-being through higher educational attainment are expected to be other major sources of benefits. However, the inclusion of these other sources of savings requires agreements with county and state agencies who have jurisdiction over these funding sources. Cross-jurisdiction agreements are more challenging to complete and increase the amount of time and transaction costs. The CPC initiative only includes success payments made by the school district and by the City of Chicago. The Utah initiative is with the State, and only includes this portion of special education savings in the success payments made to repay the private investors.
However, we note that significant efforts were made in Chicago on a cross-jurisdiction initiative. For example, during the planning, efforts were made to partner with the State of Illinois to include the state portion of special education costs in the transaction. Cook County also was approached, since it is the jurisdiction for child welfare and juvenile justice system savings that were documented in the BCA. There was not sufficient interest to develop either collaboration further. Governor Quinn had prioritized youth foster care for his own PFS initiative. However, even if there was interest, the extra time and complexity needed to complete the project would have dramatically multiplied. There was also consideration to include the K-3 component of the program in the transaction but the added costs made this infeasible. Thus, the constraints of time and divergent priorities across jurisdictions create barriers to implementing comprehensive PFS initiatives. However, if the sole purpose is to expand services that would otherwise be impossible, the narrow scope of PFS serves an important end.
These three examples of PFS highlight the heterogeneous nature of the contractual arrangements made by the relevant government entities. In the Rikers Island case, New York City makes the payments to the private investors. In Utah, Salt Lake County originally agreed to make the success payments for reductions in special education placements even though the county is not involved in special education finance and so technically experiences no direct cost savings when the number of special education students falls. Instead, Salt Lake County agreed to be the payer after being convinced that special education placement rates were an indicator of future benefits that the city would experience in terms of reductions in crime and related county expenditures. By the start of the year of the Utah social impact bond, legislation was passed allowing the state government to make success payments. Finally, in Chicago the main success payment based on reductions in special education placement are based on the estimate of the cost to the school district and not the state. The City of Chicago agreed to make success payments based on the two additional outcomes of school readiness at the end of preschool and third-grade reading proficiency. As with the Salt Lake County’s willingness to pay for reductions in special education, the City of Chicago is willing to pay for these education-related outcomes even though there is not a sizable academic literature linking changes in these outcomes to direct savings in city, county, or state budgets. However, in the Chicago study school readiness and achievement are good predictors of the need for school remediation and special education (Reynolds and Ou, Reference Reynolds and Ou2011; Conyers et al., Reference Conyers, Reynolds and Ou2003).
7. Opportunities and challenges in PFS social impact financing
The method of BCA underlies the great current interest in social impact borrowing among private investors, policymakers, and service providers. Analysts’ ability to separate out government cost savings from the rest of the benefits accruing to program participants and the public provides valuable information to all of the involved parties regarding the feasibility of this funding mechanism. In the area of early childhood education, existing studies such as Karoly et al. (Reference Karoly, Greenwood and Everingham1998, Reference Karoly, Kilburn and Cannon2005), Heckman et al. (Reference Heckman, Moon, Pinto, Savelyev and Yavitz2010), Reynolds et al. (Reference Reynolds, Temple, White, Ou and Robertson2011b ), and Belfield et al. (Reference Belfield, Nores, Barnett and Schweinhart2006), while based on interventions offered 30, 40, or 50 years ago and observed outcomes measured through adulthood, provide a useful framework for considering the various types of governmental cost savings or benefits, their timing, and the issue of which level of government receives each type of government savings. BCAs that have contributed knowledge regarding the types of governmental benefits that can be expected and to which levels of government these cost savings accrue are now being used as the foundation for private sector investments in services offered by school districts, cities, counties, and states.
There are several notable opportunities presented by this new funding mechanism. Given difficulties in raising taxes, social impact investing with a PFS contract allows private investors to provide the working capital to finance the expansion in proven or promising social and educational services. As currently constructed, the social impact borrowing deals present no financial risks to governments as they only pay when success targets have been reached. A second benefit associated with PFS investing is the greater and more explicit focus on evidence-based public service contracting decisions. As ongoing initiatives are evaluated, these evaluations will add to the knowledge base about “what works.” There is likely to be an increase in demand for analysts trained in BCA. More detail about the promise of social impact borrowing more broadly is provided by Liebman (Reference Liebman2011), Liebman and Sellman Reference Liebman and Sellman2013, and Temple and Reynolds (Reference Temple, Reynolds, Israelashvili and Romanoforthcoming).
PFS financing is not without its critics as several challenges to its sustainability have been noted. A few of these challenges are discussed below and Duggar and Litan (Reference Duggar and Litan2012) have a lengthier discussion. Several of the ongoing PFS programs are described as intending to provide “proof of concept,” which means that they are intended to demonstrate feasibility of the contracting form rather than high levels of profitability. A major strength of the Chicago PFS initiative is that the CPC program has an evidence base demonstrating effects on outcomes in both the shorter and longer term and is the only program among the current PFS initiatives backed by peer-reviewed cost-benefit analyses based on longitudinal follow-up of participants that demonstrates sizable government savings. The Chicago PFS supplements a federally funded initial expansion of the program (Human Capital Research Collaborative, 2012) that provides additional funding from 2012 to 2016.
An important problem with PFS projects is that they entail high administrative costs. Issues regarding service provider selection criteria, the role of the intermediaries, fidelity of program implementation, the guidelines for the evaluation, the nature of risk sharing, and the means of addressing conflicts must be discussed and decided upon by various parties. As the leader of several of the early social impact bond initiatives, Goldman Sachs has provided large amounts of investment and contracting expertise. Fortunately, a number of the negotiated contracts are available online, which will reduce contracting costs for various parties involved in future social impact arrangements.
A third concern is about private investors’ willingness to assume risk. In the PFS initiatives described in Table 3, the primary investor is shielded from much of the performance risk by a private foundation either providing a grant to help guarantee the investment or agreeing to be second in line for eventual repayment. If state or local governments wanted to securitize the future flow of cost savings and create an actual social impact appropriations bond, then government’s preference for keeping bond payments low might lead to only risk-free, high return services being chosen for financing. For example, if both the private investors and the evaluator expect to be paid a 5% rate of return and the intermediary requires 10%, then the chosen social or educational service would have to be one that could not only pay for itself in the form of government savings but generate an additional 20% return. This limits the ability of PFS to scale up innovative and promising interventions as only proven projects could be financed at low interest rates and scaling up smaller-scale projects might be considered too risky. Risk sharing could expand to include the service providers themselves although Warner (Reference Warner2013) expresses concern as these organizations serve the most “fragile” clients including disadvantaged children, prisoners, and the homeless and making service providers pay if success targets are not met may reduce their ability to provide services in the future. Liebman and Sellman (Reference Liebman and Sellman2013) point out that some determinants of measured program success such as the macroeconomy are not under the control of service providers.
A final challenge concerns the establishment of a comparison group. Ideally, the counterfactual is the PFS outcome (e.g., special education placement) for a comparison group that is equally eligible for the program and similar on socioeconomic characteristics that affect school success but does not participate or participates in an alternative program. In the preschool field this is typically another center-based program, since roughly 80% of 4-year-olds enroll in out-of-home care or preschool education at least part of the day. PFS initiatives use a variety of evaluation approaches, which will depend on the interests of the investors. In the Utah PFS, no comparison group was identified since a history of positive effects had been documented. Instead, preschool children defined at high risk of receiving special education services – those scoring two standard deviations below the mean on the Peabody Picture Vocabulary Test – served as their own controls. Each high-risk child that avoided special education generates an annual success payment to the investors for the life of the contract. In the Chicago PFS, a comparison group was identified – demographically similar children entering the public schools as kindergartners without preschool experience in the district. Success payments for special education placement reductions are triggered by a comparison of the CPC children with entering kindergartners in similar public school settings in low-income neighborhoods. The use of comparison groups and precise metrics of evaluating success are important parts of social impact financing with a PFS contract.
The future of social impact investing with PFS contracts both in general and for early childhood programs may move in several directions. First, there could be more across-government and across-agency cooperation. In the illustration of the governmental savings associated with the preschool program offered by the CPCs, some of the government savings accrue to the school district in the form of special education and reductions in grade retention. Some of the cost savings are accrued by the county, especially some of the criminal justice costs and the governmental costs associated with child abuse and neglect. The state also benefits by reductions in special education, crime, higher tax revenues, and lower need for welfare services. The federal government also benefits from the same categories as the state but in differing amounts. The first social impact bonds involved estimating savings to one level of government. As the understanding of this financing mechanism has evolved, the early childhood initiatives went from including the state only in Utah to including the city and school district in Chicago.
A benefit of the current popularity of PFS investing is that policymakers and voters may develop a greater recognition of the importance of preventive interventions. Many government services are offered to help address social issues after they have occurred rather than prevent them from occurring. In some cases, prevention may be more cost-effective than intervention. The current interest in social impact investing may lead to a reconsideration of legislative or constitutional restrictions on borrowing. If the feasibility of social impact borrowing is established, a possible successful outcome for PFS is that these types of financial arrangements might not exist in the future as governments change their own budget priorities from intervention to prevention and restrictions are eased that limit the use of state or local debt to finance physical capital rather than human capital investments.
8. Conclusion and future directions
Benefit-cost analysis is increasingly being applied to the study of social programs (Vining and Weimer, Reference Vining and Weimer2010). BCA models are useful for predicting and valuing the effects of a variety of social and educational services that not only generate benefits to the program participants but to the rest of society as well. Cost-benefit analyses help promote efficiency in public-sector decision making by identifying programs and policies that generate benefits to society that are greater than the costs.
Recent innovations in private funding of certain social service programs by social impact investors using PFS contracts represent a new use of BCA. While estimation of benefits and costs to society as a whole is a main objective in BCA, a closer focus on the subset of benefits arising from government cost savings and higher government revenues reveals that there are a significant number of social programs in existence that not only generate high social returns but also have the potential to pay for themselves in terms of these government cost savings. Expansion of social services (especially those considered to be preventive interventions) through the use of PFS financing requires policy analysts to not only identify interventions that generate net social benefits, but also to pay close attention to the predicted magnitude and timing of the government savings arising from the interventions.
In this article, we described social impact financing with a PFS contract as a promising approach for scaling high-quality early childhood programs. The frameworks and perspectives implemented in the existing BCAs of early childhood programs help inform the implementation and evaluation of PFS initiatives. The major contribution of PFS financing in early childhood and for social programs more generally is the provision of a new avenue to scale up evidence-based preventative programs. In a number of states around the United States, private investors have provided up to $20 million to finance the expansion of social and education services. The public services that are candidates for PFS financing are preventative programs that both generate social benefits in excess of costs AND have governmental cost savings that are enough by themselves to cover program costs. Early childhood and other preventive public services that can save governments money over a shorter period are preferred to those that may take decades to generate sufficient cost savings.
In the United States, the types of government programs that have been funded by private investments with a PFS contract include services offered to youthful offenders to prevent recidivism, early childhood education programs that may reduce later placement in special education services, homeless prevention programs, and a myriad of other preventive services. This paper has focused on the use of social impact borrowing to expand preschool programming to economically disadvantaged children, but the discussion here equally applies to other forms of early intervention such as home nurse visiting programs (Zaveri et al., Reference Zaveri, Burwick and Maher2014) for new mothers in low-income communities. The promise of high returns (both to society and to the taxpayers) is likely to be greatest when financial or political barriers are preventing tax-funded expansions of services for those most at risk of social, health, or educational problems.
While the details involved in PFS initiatives are complex, a number of the legal contracts describing these financial arrangements are publicly available. Policy-led social impact initiatives are starting to be offered without the help of Goldman Sachs. Knowledge of BCA is useful for informing the contract language that specifies the magnitude of the success payments. Policy analysts help specify the evaluation scheme for identifying whether the providers have met predetermined targets that generate the success payments from the government to the investors. As discussed, two aspects of BCA are central to the feasibility of this funding mechanism. First, the existence and magnitude of government savings generated by the project must be identified and accurately estimated. Second, the timing of the government benefits needs to be understood so that a payback schedule can be specified that aligns realized government cost savings with the payments that the government needs to make to repay the private investors.
Many studies have suggested that high-quality well-targeted early childhood programs generate social benefits well in excess of costs. A significant portion of these benefits are averted future government costs and higher future taxes. From these studies, there is reason to believe that programs that reduce special education placement in the early grades may not only be cost-effective but are capable of generating government savings that may cover or exceed their costs. PFS contracts allow governments and nonprofit organizations to expand education services without any increase in taxes. The current contractual arrangements place the performance risk on the private investors and philanthropists.
At this time in the United States, external evaluations are just starting to be reported for the Rikers Island and the Utah preschool social impact bond initiatives. The first social impact bond outside of the United States, which expanded services to recently released former inmates of the Peterborough Prison in the United Kingdom, was terminated prematurely due to national changes in probation policies that would have affected the comparison group. As previously mentioned, the Rikers Island evaluation found no evidence that the social and emotional skills training offered to teen offenders led to a reduction in recidivism. Successful results generating success payments to the investors have been reported for the first year of the Utah High Quality Preschool program, although the results have stimulated debate about the role of a control group in evaluating program success (Popper, Reference Popper2015). Although social benefits are not estimated by the evaluators in these initiatives, the existence of government savings in excess of program costs is an indicator that the overall benefits to society may be even larger.
While the evaluations of the current PFS initiatives focus on how well the preschool participants fare in avoiding special education placement and, in the Chicago project, how school-ready and reading proficient they are, future research may expand to a broader examination of outcomes including avoidance of juvenile delinquency, high school completion, and other indicators of economic success. Expanding the perspective to include benefits accruing to multiple jurisdictions or agencies would be a step toward broadening the narrow perspective in which benefits are conceptualized in the current social impact borrowing initiatives.
Acknowledgments
Preparation of this article was supported by the U.S. Department of Education (Grant No. U411B110098) and the National Institute of Child Health and Human Development (Grant No. R01 HD034294). The authors are Professor of Public Affairs and Professor of Child Development, respectively, at the University of Minnesota where they are associated with the Human Capital Research Collaborative.