


Introduction
Weed management programs in large natural areas require monitoring programs to direct control efforts, understand weed distribution patterns, detect new weeds early in the invasion process, and assess progress in management efforts (Dewey and Andersen Reference Dewey and Andersen2004; Maxwell et al. Reference Maxwell, Lehnhoff and Rew2009; Rew et al. Reference Rew, Maxwell, Dougher and Aspinall2006). Precise monitoring is essential for ensuring cost-effective weed management at a large (regional or landscape) spatial scale. However, collecting invasive plant distribution and abundance data in remote natural areas presents numerous unique challenges (Rew et al. Reference Rew, Maxwell and Aspinall2005). Large survey areas with difficult-to-traverse terrain can be so formidable to access that transportation logistics often make traditional ground-based surveys costly or impractical.
Remote-sensing technologies can provide spatially precise information on invasive plant populations (Lass et al. Reference Lass, Prather, Glenn, Weber, Mundt and Pettingill2005), but obtaining and interpreting high-resolution imagery can be expensive, time consuming, and require significant technical expertise (Underwood et al. Reference Underwood, Ustin and DiPietro2003). Further, remote sensing of single species is still limited to conditions where the species has a unique spectral signature or is a dominant canopy species (Joshi et al. Reference Joshi, de Leeuw and van Duren2004; Shafii et al. Reference Shafii, Price, Prather, Lass and Thill2003), and the accuracy of mapping products may be dependent on the timing of imagery collection due to reflectance variation through seasons (Hestir et al. Reference Hestir, Khanna, Andrew, Santos, Viers, Greenberg, Rajapakse and Ustin2008). Developments in unmanned aerial vehicle (UAV) technology offer a wide range of affordable options for finer spatial and temporal resolution imagery collection (Anderson and Gaston Reference Anderson and Gaston2013), but current flight range capabilities and FAA regulations (14 CFR Part 107) may make UAVs impractical for large weed management areas (Hardin et al. Reference Hardin, Jackson, Anderson and Johnson2007). These monitoring limitations can be consequential to natural resource managers who typically lack robust monitoring budgets and often require spatially explicit information in a timely manner (Huang and Asner Reference Huang and Asner2009).
A relevant example is the Florida Everglades—one of the largest continuous wetland landscapes in North America, where multiple agencies are collaborating to restore tens of thousands of acres affected by invasive plant encroachment (Rodgers et al. Reference Rodgers, Mason, Bodle, Brown, Allen, Tipping, Rochford, Mazzotti, Peters, Renda, Beeler, Ketterlin-Eckles, Laroche, Segura and Serbesoff-King2017). The regional effort is formally organized as the Everglades Cooperative Invasive Species Management Area (Everglades CISMA) (Figure 1), a 2,045,603-ha area within the southern Everglades south of Lake Okeechobee, which includes 11 governmental agencies, two Indian tribes, and one utility company directly responsible for invasive species management within their jurisdictions (ECISMA 2017). The Everglades restoration area includes vast sawgrass marsh wetlands with scattered subtropical forested wetlands (tree islands) and expansive cypress swamps, mangroves, mixed-hardwood forests in both wetland and upland contexts, salt marsh, pine rocklands, pine savannahs, and rangeland (Lodge Reference Lodge2010). Access to the interior of the Everglades is typically by airboat, swamp buggy, or float helicopter, and many areas are extremely difficult to traverse given the high water, dense vegetation, and deep peat soils.
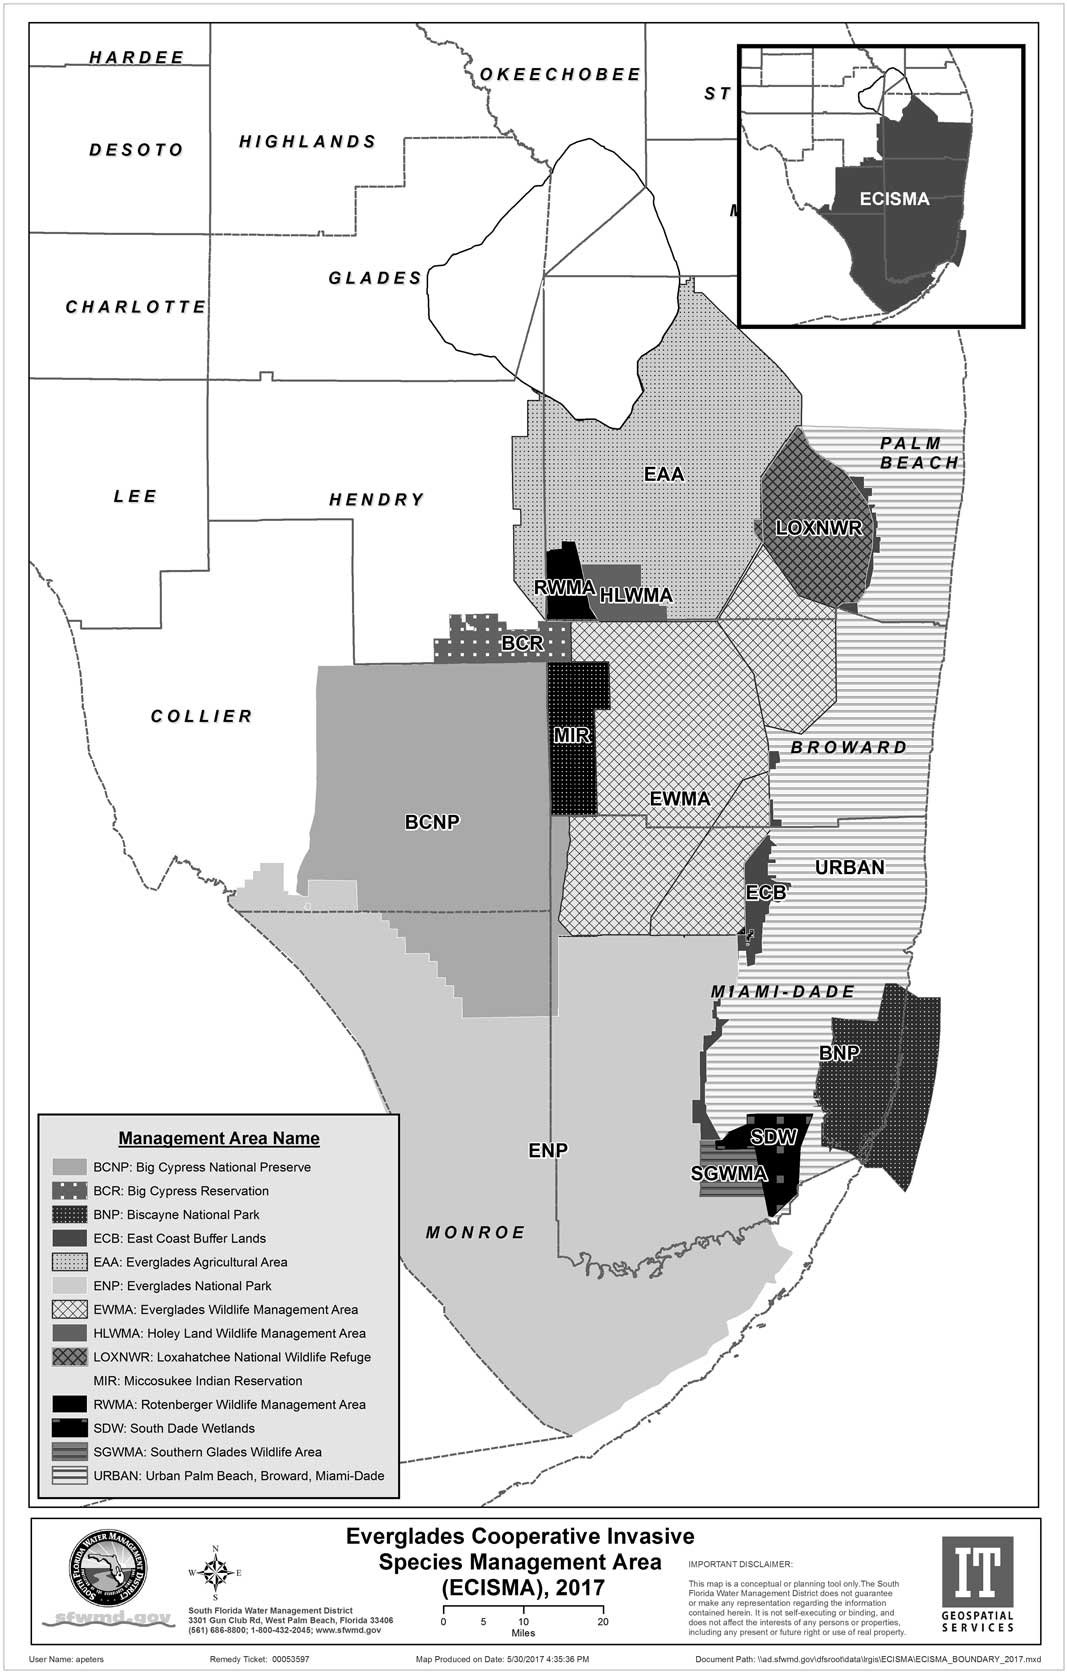
Figure 1 Map of the Everglades Cooperative Invasive Species Management Area (Everglades CISMA). Entities responsible for invasive plant management within the management area include five federal agencies, two state agencies, three county governments, two Indian tribes, as well as agribusinesses, utility companies, and private land owners.
The Everglades CISMA (https://www.evergladescisma.org) currently harbors a diverse assemblage of invasive exotic plant species. Dominant natural-area weeds in the Everglades include melaleuca [Melaleuca quinquenervia (Cav.) S.T. Blake], Old World climbing fern [Lygodium microphyllum (Cav.) R. Br.], Brazilian peppertree (Schinus terebinthifolia Raddi), and Australian pine (primarily Casuarina equisetifolia L. ex J.R. & G. Forst.), but may include the morphologically similar C. cunninghamiana Miq. and C. glauca Sieber ex Spreng) (Doren et al. Reference Doren, Volin and Richards2009). However, an additional 163 non-indigenous plant species are known to occur within Everglades CISMA’s boundary (Lodge Reference Lodge2010). With so many widespread or locally abundant invasive plant species over this large landscape, natural resource managers have sought affordable and timely distribution data to guide control efforts and assess the status of targeted species. Mapping methods with high positional accuracy and species detection rates, rapid turnaround time, relatively low cost, and the ability to quantify the degree of infestation provide optimal utility to land managers who must plan and direct management activities. Beginning in 2008, Everglades CISMA partners began utilizing digital aerial sketch mapping (DASM) as a cost-effective means of detecting and mapping infestations of priority weeds at a landscape scale. In subsequent years, Everglades CISMA partners implemented additional monitoring and data-sharing methods to address additional monitoring needs, such as early detection of new invaders and detailed mapping for planned management actions. This article summarizes the recent efforts to utilize DASM and other monitoring tools within a multiscale approach and discusses strategies and protocols aimed at providing affordable and timely spatial information meeting multiple invasive plant monitoring objectives.
Everglades Invasive Plant Monitoring Program
Efforts to control the spread of invasive plants within the Everglades began in earnest in the 1980s. At that time, the priority species for control was melaleuca, which was known to be established and dominant over large areas of the Everglades (LaRoche and Ferriter Reference LaRoche and Ferriter1992). Early monitoring efforts utilized systematic reconnaissance flight (SRF) methodologies to estimate landscape abundance of melaleuca in South Florida (Cost and Craver Reference Cost and Craver1981).
Beginning in 1993, the South Florida Water Management District (SFWMD) and the US National Park Service (USNPS) began biennial aerial surveys for melaleuca and other invasive plants that were detectable from aircraft. The SRF methodology involved flying trained biologists in fixed-wing or rotor aircraft at low altitude along east-west transects (5-km transect intervals; Cost and Craver Reference Cost and Craver1981) and 4-km intervals (Pernas and Ferriter Reference Pernas and Ferriter2008). Biologists recorded species and density information at fixed intervals along the transects. Observations of the target species were made at an oblique angle from the aircraft (using a window sample frame) and recorded as a waypoint using a handheld GPS unit. These data provided a highly cost-effective means of estimating landscape scale weed distributions and spread of weeds across the landscape but lacked sufficient positional accuracy to effectively guide ground-based control efforts, evaluate temporal trends, and accurately characterize small-scale distribution patterns.
In 2008, the SFWMD and USNPS adopted the DASM methodology to address some of the limitations of the earlier SRF protocol. Sketch mapping is a remote-sensing technique of observing ground conditions from low-flying aircraft and manually documenting observations on paper maps. In the 1990s, the USDA Forest Service began integrating computing and global positioning system (GPS) technologies with manual sketch mapping techniques to automate forest pest outbreak monitoring. The USDA Forest Service worked with a software vendor (Michael Baker, Jr. Inc.) to develop a product (GeoLink® Sketch Mapping Software) that generates a map display with imagery and an icon showing the aircraft’s current position (Schrader-Patton Reference Schrader-Patton2003). The software also allows observers to digitize points, lines, and polygons and rapidly attribute these features “on the fly.”
The DASM system currently utilized by Everglades CISMA comprises two networked touch-screen tablet PCs (Xplore Technologies Corp.) connected to a Garmin hand-held GPS receiver, GeoLink® sketch mapping software (Michael Baker Jr. Inc.), and preloaded spatial data including boundaries, sampling areas or grids, flight-transect shapefiles, and imagery. External lithium ion laptop batteries are used to maintain power on lengthy missions. An aviation GPS system with preloaded routes is used by the pilot to identify transects and follow the flight plan. Trained observers map invasive plants on each side of the aircraft. Observers digitally sketch polygons of infestations for each invasive species on the tablet computers. The percentage vegetation cover or abundance category of each species polygon is estimated using a modified Braun-Blanquet cover abundance scale (Mueller-Dombois and Ellenberg Reference Mueller-Dombois and Ellenberg1974) and entered into a flight log database. Following the flight, data are translated to shape files for post-sampling processing.
Between 2008 and 2014, Everglades CISMA partners utilized DASM to collect detailed distribution and abundance information for four priority natural area weeds: Australian pine, Brazilian peppertree, melaleuca, and Old World climbing fern. As with previous SRF protocols, observation flights followed east-west transects at low altitude. However, the monitoring protocol was changed to obtain a complete inventory or census of the target weeds for the region by reducing the fixed-transect interval to 1 km and collecting polygon data along the entire transect. Although this method provided for the first detailed invasive plant distribution and abundance map at both small and large scales for the Everglades (Rodgers et al. Reference Rodgers, Pernas and Hill2014b), the cost to carry out the landscape-level inventory was over 300% higher than the SRF sampling approach.
In May 2013, Everglades CISMA partners and members of the South Florida Ecosystem Restoration Working Group (https://evergladesrestoration.gov) held a workshop to evaluate the regional monitoring program and to brainstorm potential modifications to reduce costs and potentially meet additional invasive plant monitoring objectives. Several limitations to the current monitoring protocol were identified: the high cost and flight time required for the full inventory of the entire landscape, positional accuracy of points and polygons, increasing false-negative detection errors within increasing distance from the transect line, and inconsistent detection of small infestations (Rodgers et al. Reference Rodgers, Pernas and Hill2014b). The workshop participants also recognized that a detailed, landscape-level inventory was unnecessary on biennial intervals as originally planned, because infestations did not change dramatically within a 2-yr time frame.
Workshop participants also discussed and prioritized the monitoring needs of land managers and researchers. The monitoring needs were categorized under three broad goals: quantification of distribution and abundance, quantification of small-scale patterns and temporal change, and early detection. Six scale-dependent objectives for the regional monitoring program were identified as priorities: (1) detect landscape-level distributions and abundance of invasive plant species, (2) observe long-term rates of change of abundance and distribution at the landscape level, (3) map distributions and abundance of invasive plant species within defined management units to direct control teams, (4) quantify invasive species abundance trends as restoration progresses, (5) determine fine-scale infestation patterns to better predict habitat invasion vulnerabilities, and (6) detect new introductions early. With the limitations of the existing DASM inventory protocol and multiple monitoring objectives in mind, participants conceptualized a multiscale monitoring program to meet the six priority objectives. Using available tools and resources, such as DASM, agency botanists, landscape ecologists, and web-based mapping and reporting tools, monitoring protocols were developed to address each objective. The suite of broad goals, coupled with more specific monitoring objectives and selected monitoring protocols are presented in Table 1. Details on the monitoring protocol methods for each goal and objective are discussed below.
Table 1 Identified goals and objectives of the Everglades multiscale invasive plant monitoring program from the 2013 interagency workshop. The selected monitoring/mapping protocol and targeted sampling interval are included for each objective.
Landscape Abundance and Distribution
DASM technology was utilized with an SRF protocol similar to the protocol used between 1993 and 2005 (Pernas and Ferriter Reference Pernas and Ferriter2008) to quantify landscape distributions and abundance of priority invasive-plant species. We adopted an SRF protocol similar to the protocol used between 1993 and 2005 (Pernas and Ferriter Reference Pernas and Ferriter2008). Our primary interest was to improve precision and repeatability of the method while maintaining compatibility with the historic datasets. We used the fixed east-west transects utilized for the earlier SRF monitoring program. Rather than making observations on time intervals, which probably increased sampling bias because of irregular flight speeds and insufficiently defined sampling space, we generated sampling plots with ArcGIS following a stratified random approach. Within each 4-km segment of each transect, twelve 0.4-ha plots were randomly generated (six plots on each side of the transect). We placed the plots 50 m from the transect line, enabling a clear oblique view from the aircraft. These “virtual plots” are displayed along with National Agriculture Imagery Program aerial imagery using GeoLink® sketch mapping software.
During flights, observers visually locate the location and extent of the plot on the ground by identifying vegetation patterns (e.g., sawgrass ridge and slough patterns) in the area of the virtual plot. When a target species is observed within the plot, the observer enters a point on the touch screen computer within the plot along with species name and estimated percentage cover. By using a helicopter and fixed virtual plots, observers can direct the pilot to reduce speed or double back and hover over plots until the observer is satisfied with the percentage cover estimate.
Utilizing DASM with this protocol allows for follow-up ground truthing of collected data. Abundance estimates for each species are calculated using the 4-km grid system by calculating the mean cover of the 12 plots within each cell. This sampling protocol allows for a landscape-scale representation of the distribution and abundance of the targeted invasive plant species, enhances positional accuracy of the monitoring system, and effectively preserves the capacity to detect change over time within each 4-km-long grid cell and among the 4-km grid cells sampled across the restoration landscape. Figure 2 provides an example of landscape-level distribution and abundance maps produced using this monitoring method.
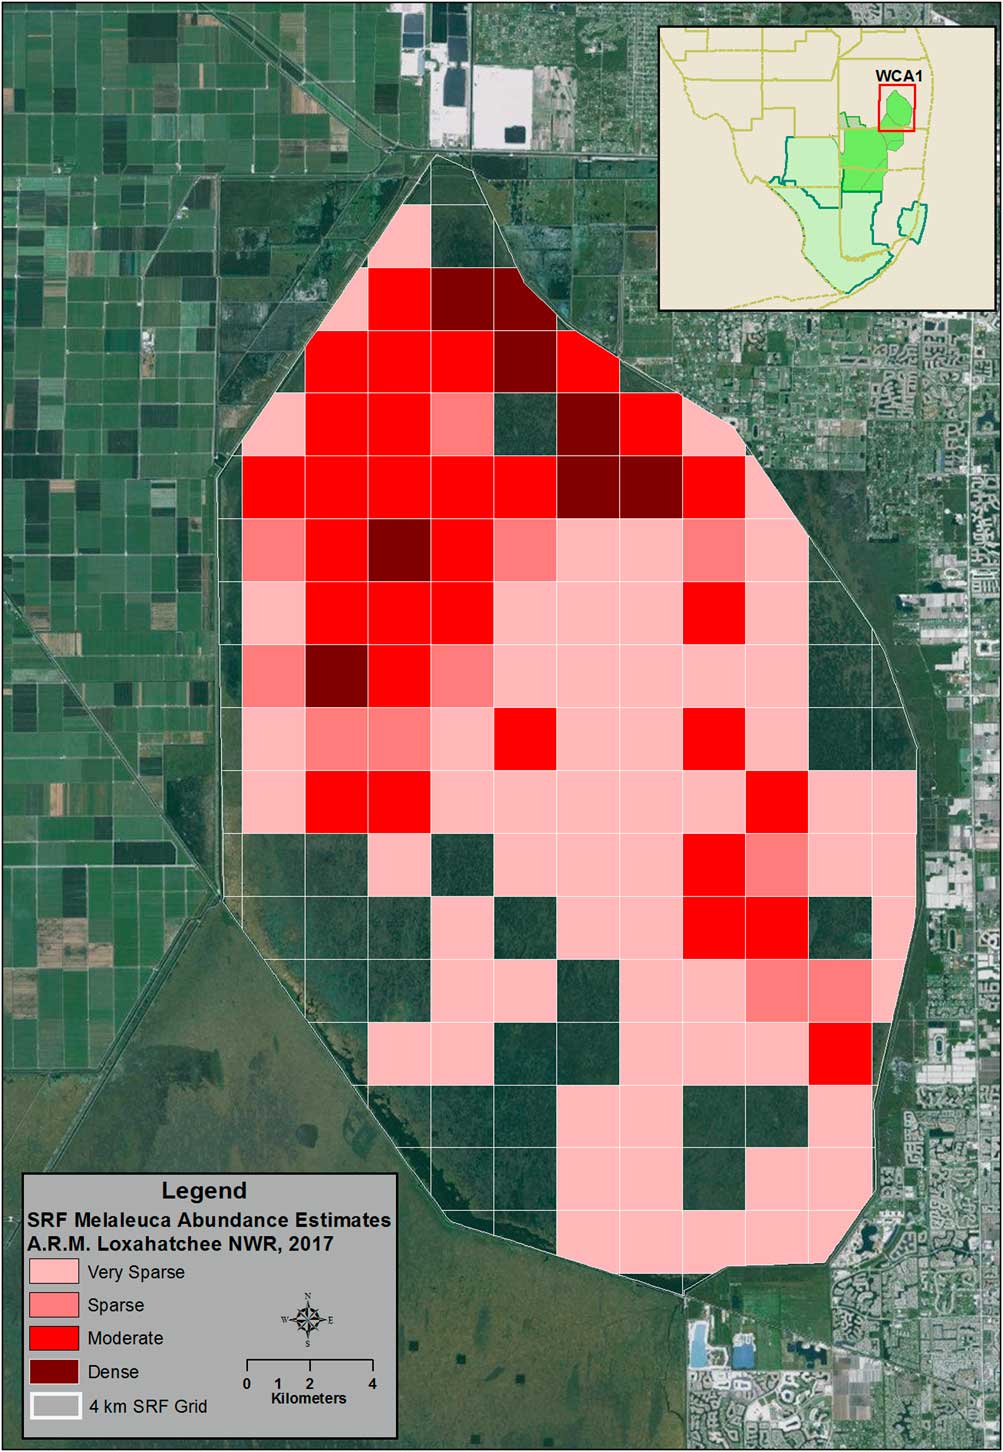
Figure 2 An example of landscape-level monitoring results utilizing the Systematic Reconnaissance Flight (SRF) protocol and 4-km grid system. Data shown are distribution and abundance for melaleuca in the Arthur R. Marshall Loxahatchee National Wildlife Refuge in 2017.
The SRF protocol is now implemented at 5-yr intervals for the entire Everglades CISMA. Costs for monitoring and data analysis for this program, excluding software and computer expenses, are estimated to be $49,032 (or $0.07 ha–1) for each 5-yr monitoring event. These data are currently utilized by natural resource managers to establish large-scale management strategies and to communicate to decision makers the extent of invasion and temporal trends as management efforts progress. Decadal changes in distribution and abundance of melaleuca, Old World climbing fern, Australian pine, and Brazilian pepper can now be assessed for the entire region or specific management areas within the Everglades CISMA footprint.
Temporal and Spatial Change Detection
We identified observer bias of abundance estimates and positional-accuracy concerns during DASM surveys at altitudes above 100 m and for distances beyond 250 m from the transect, suggesting that the SRF methodology may be inadequate for detecting temporal change at small scales and for identifying localized causes of rapidly spreading infestations. To address these challenges, we adopted a generalized random tessellated stratified (GRTS) landscape-monitoring design originally created by Tom Philippi (Reference Phillippi2007) to detect effects of Everglades restoration projects, and expanded it to include the entire Everglades CISMA footprint. The DASM software and procedures are used to sample the GRTS tiles. The intent of the original GRTS monitoring design was to allow resource managers to differentiate among the multiple potential causes of environmental change in the ridge, slough, and tree island landscape. It is broadly understood that the Everglades ecosystem is experiencing widespread degradation (Watts et al. Reference Watts, Cohen, Heffernan and Osborne2010) and contains tens of thousands of acres of land dominated by exotic plant species (Rodgers et al., Reference Rodgers, Pernas and Hill2014b). It is intuitive to suggest that exotic species abundance and ecosystem degradation caused by shifts in hydrology are linked in many cases by a common set of ecological drivers (Doren et al., Reference Doren, Volin and Richards2009). The original design tiled the ridge, slough, and tree island region with 516 tiles measuring 2- by 4-km or 2- by 5-km across a 4,936-km2 region. Because the restoration area within the Everglades CISMA is 11,447 km2, a target of 1,024 tiles was established for the entire region (Figure 3).
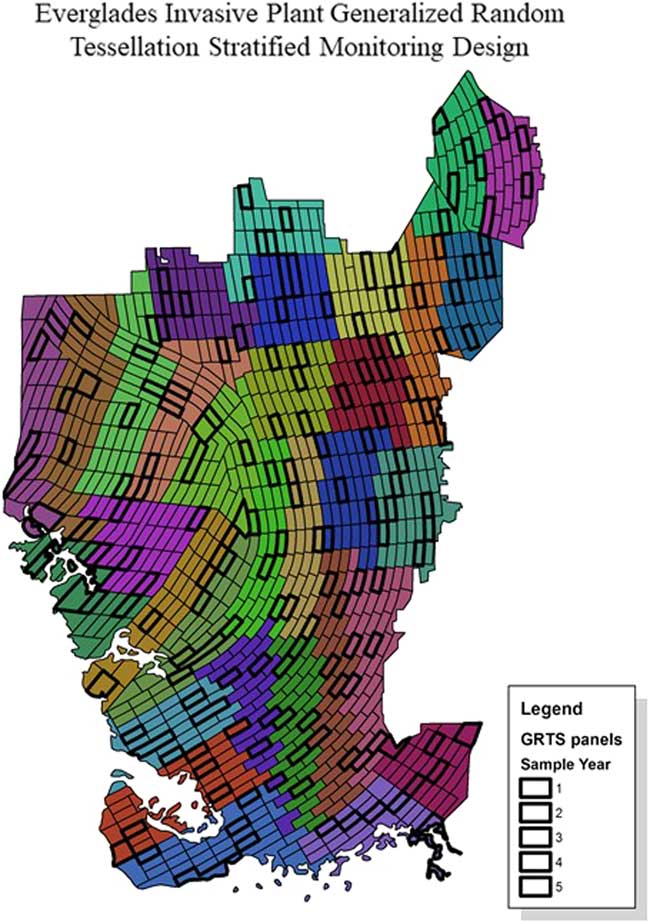
Figure 3 The generalized random tessellation stratified monitoring design for invasive plant species within the Everglades Cooperative Invasive Species Management Area (Everglades CISMA). The region is divided into 32 strata containing 2- by 4-km or 2- by 5-km tiles. One tile in each stratum is sampled during each monitoring event.
The major strength of the GRTS design is that the sampling procedure is spatially balanced both across the entire Everglades CISMA domain and within the sub-domains that are derived from the partitioning process (i.e., spatially balanced across multiple spatial scales). As a result, the sampled information can be used to formulate estimates of presence or change across either local or regional sampling domains. Statistical designs reduce the sampled area (compared to a census approach), allowing us to enhance the precision of our insights in monitored areas and providing a basis for estimating conditions in unmeasured areas (or areas measured with less precision through the SRF method) with statistically valid confidence intervals. These confidence intervals can be narrowed using information derived from other sources (such as vegetation maps that identify community types in a precise manner at a 50- by 50-m grid scale). For example, the biology of some invasive plant species indicates that those species are more likely to invade open habitats instead of closed-canopy forests. Nutrient impairments, historical soil subsidence, shifts in hydrology, and other factors may cause a region or certain patches of land within a region to become more vulnerable to infestation. Proximity to human populations may be related to the likelihood of multiple introductions and vulnerability to infestation.
The spatial balance of the GRTS design helps to integrate the considerable quantity of ecologically relevant information collected across the landscape, and identify, quantify, and communicate the observed influence of these factors. The result is that this system allows invasive-plant managers to deliver information to water-resource managers, policy makers, and the public in a narrative that is as simple as possible, without oversimplifying what is often a subtle, complex, and interconnected set of issues. The first 3 yr of sampling the GRTS design produced estimates of total coverage that were in the same order and the same magnitude of the estimates produced by the census-based process used from 2008 to 2012. Each year’s sampling delivered a consistent estimate, and pooling the 3 yr of sampling delivered a similar estimate with a narrower 95% confidence interval. In addition, the GRTS design allowed more careful inspection of the sampled areas and led to the discovery that sparse infestations were twice as likely to be observed compared to the DASM census-based estimates. A third contribution of the GRTS design is that sparse infestations were much more likely to be detected near known infestations, and were not observed in remote portions of the project area––essentially confirming the absence of low-level infestation in areas where dense infestations have never been detected.
Redwine et al. (personal communication) and Appendix 2 of Philippi (Reference Phillippi2007) describe the protocols for developing the modified GRTS sampling design for Everglades CISMA. The final step of the Everglades CISMA monitoring design is the selection of sampled tiles. As there is a 5-yr rotating period, with 2% of the landscape being sampled each year, the monitoring design will have covered roughly 10% of the total landscape within the project boundary relatively precisely every 5 yr. This protocol may be complemented periodically with a repeat of the DASM inventory conducted by Rodgers et al. (Reference Rodgers, Pernas and Hill2014b) at an appropriate time scale.
Early Detection
Detecting new species with the potential to become invasive while they are still in small controllable populations is important, because the probability of treatment success is high and cost effectiveness is maximized. Currently there is no system-wide DASM monitoring protocol in the Everglades restoration area that is specifically dedicated to early detection of new invasions. However, early detections have occurred opportunistically during SRF and inventory-monitoring missions. For example, an undocumented population of giant brake fern (Pteris tripartita Sw.) within Water Conservation Area 3B of the Everglades restoration area was first detected during inventory flights in 2013. The plant was previously documented in developed areas to the east but was not known to occur within Everglades natural areas. The observation was immediately transferred to the responsible agency (SFWMD), resulting in rapid-response treatments. This was followed by ground-based surveys of neighboring tree islands, as aerial detection of this understory species can be difficult. These surveys detected no other populations in the surrounding area. However, an additional giant brake fern population was observed in 2014, approximately 30 km from the original observation in Water Conservation Area 2B. Other opportunistic early detections using DASM-based monitoring programs include laurel wilt disease expansion into the eastern Everglades (Rodgers et al., Reference Rodgers, Derksen and Pernas2014a) and cogongrass [Imperata cylindrica (L.) Beauv.] expansion into Big Cypress National Preserve.
National Park Service botanists have implemented a ground-based early-detection protocol in Everglades National Park, Biscayne National Park, and Big Cypress National Preserve designed to detect early invasions of invasive plant species utilizing disturbance corridors (Shamblin et al. Reference Shamblin, Whelan and Vargas2013). The Corridors of Invasion protocol is designed to work in tandem with DASM surveys by detecting infestations on a finer scale and focusing on monitoring areas suspected of being at high risk for invasive-exotic plant introductions (roadsides, trails, canals, campgrounds, etc.) and quickly preventing their establishment and development into larger populations requiring more intensive management. Established survey routes are assessed annually. When new non-indigenous species are observed, specimens are vouchered and the population is either removed by the survey team or reported to the responsible land manager if the population is large. Since its inception in 2009, the Corridors of Invasion program has surveyed 1,394 km and detected 130 non-indigenous plant species, 25 of which were new records for the area. These observations and subsequent management actions have potentially prevented the expansion of new non-indigenous plant species into the interior of the Everglades restoration area. The Corridors of Invasion protocol could be expanded to the entire Everglades CISMA, but limited agency resources are currently preventing this. Although the majority of new invasive plants tend to expand their range through these disturbance corridors, some species may spread into less disturbed areas through other invasion pathways (e.g., avian dispersal, wind-blown propagules). In such cases, habitat suitability modeling may improve detection probabilities for aerial and ground-based monitoring while lowering operational costs (Petty et al., Reference Petty, Setterfield, Ferdinands and Barrow2012).
In 2010, the Everglades CISMA collaborated with the Center for Invasive Species and Ecosystem Health (Bugwood) to develop a smartphone application (Ivegot1) designed for professionals and citizen scientists to report invasive species and to maintain a common database (EDDMapS, https://www.eddmaps.org) to store and share invasive species occurrence data. The reporting application and database provide an important framework for involvement of citizen scientists and other observers in the region. The Everglades CISMA maintains a list of early-detection, rapid- response (EDRR) species. When one of these species is reported by an IveGot1 user, the information is immediately forwarded to pre-assigned botanists to review the report and respond with a site inspection if necessary. Between 2011 and 2016, there were 154 reports of 16 invasive plant species considered a priority for EDRR in the Everglades restoration area, all of which were confirmed using the IveGot1/EDDMapS system (EDDMapS 2017).
Detailed Inventories for Planned Treatment Areas
The large-scale, spatially stratified sampling procedures described above have limited value to land managers who need more complete and precise spatial information in planned work areas. Recognizing the need to provide timely distribution data to numerous land managers within Everglades CISMA, a “low and slow” DASM protocol is now utilized to produce detailed maps for planned treatment areas. On an annual basis, individual land managers provide the mapping team with boundaries of planned treatment areas. A 250-m grid is established for the treatment area and east-west transects are established at 500-m intervals. Observers estimate invasive species abundance for each grid cell while flying at 40-m altitude along the transect at variable speeds but never above 50 knots. Observers estimate distribution and abundance data in two formats: percentage cover of widely scattered or abundant target species for the entire 250-m grid cell or a single coordinate for discrete patches or single plants. An example of a final map product using this protocol is shown in Figure 4.
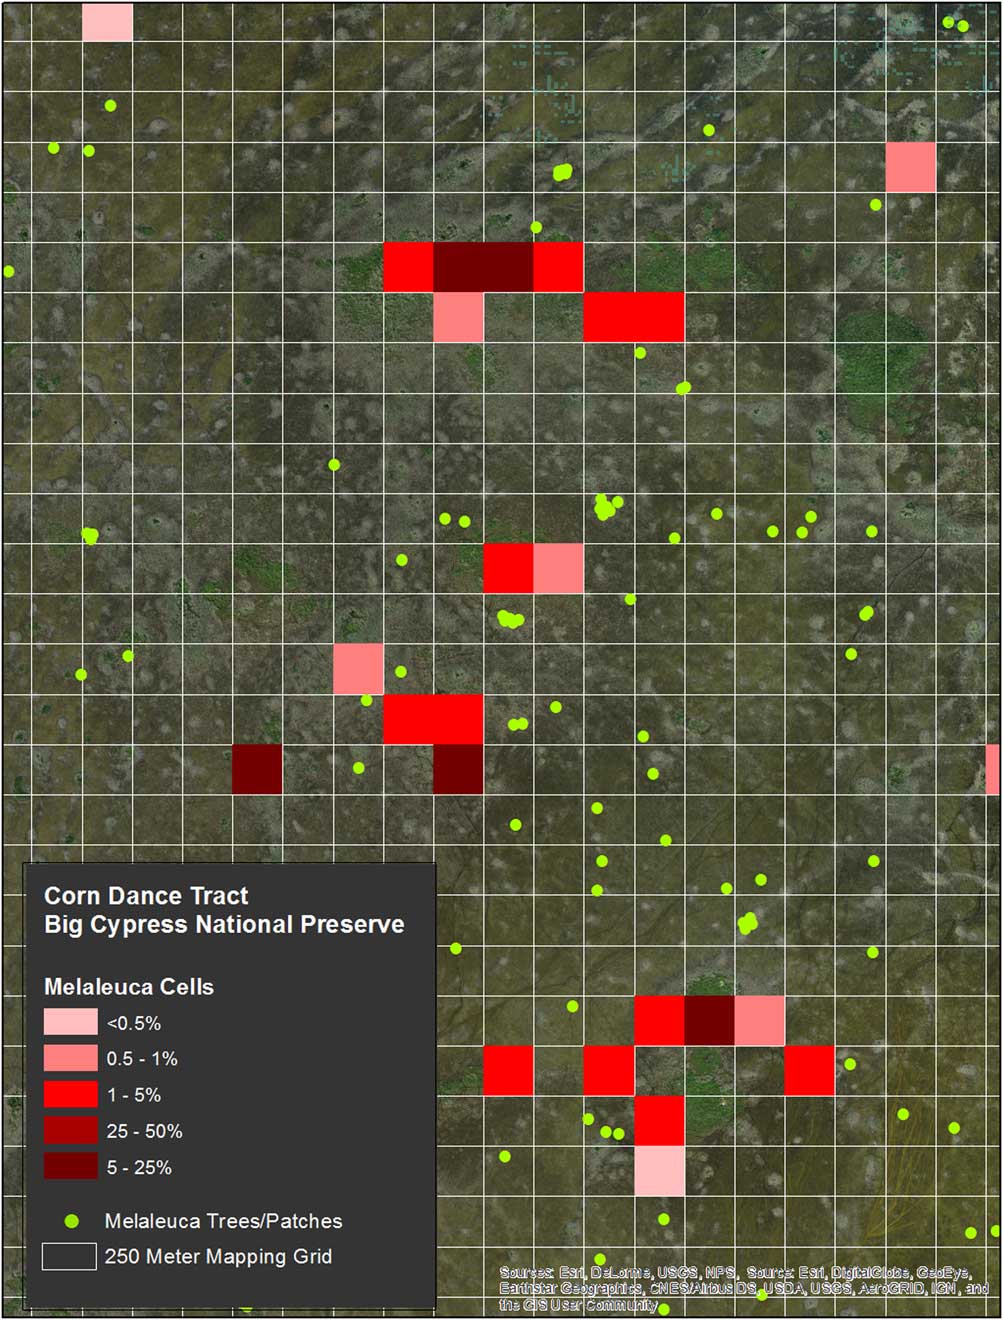
Figure 4 An example of detailed invasive plant mapping using digital aerial sketch mapping following a “low and slow” protocol and 250-m grid system. Colored grid cells represent areas with numerous scattered invasive plant species where systematic search and treat (gridding) by ground applicators is required. Single points represent discrete patches or single plants where applicators may navigate directly to the treatment area and avoid costly gridding of the cell.
The presence of scattered target plants and the estimated abundance informs the land manager that the herbicide applicators will have to systematically sweep the cell, and the cover estimate provides information on the probable cost of treating each cell. Collecting coordinates for discrete patches or single plants in low-density grid cells allows the land manager to direct control crews directly to the infestation, obviating the need for time-consuming and costly systematic surveys through the entire grid cell.
The cost benefit of these mapping products is strongly dependent on the plant community types and other landscape characteristics of the treatment area. For example, prior to the implementation of the detailed mapping, land managers working in open sawgrass marsh typically directed contractors to systematically create grids at set intervals (typically between 10 and 50 m) as treatment areas (Ellen Allen, South Florida Water Management District, personal communication). The mean cost per hectare for melaleuca treatments in this habitat type when systematically gridding is $1.31 ha–1 (SFWMD, unpublished data). The mean cost for three treatment projects (including all costs for mapping) in similar habitats during 2015–2017 were $0.91 ha–1, a 30% reduction in overall treatment costs.
The differential cost for treatments in forested areas of ECISMA is much greater, though difficult to quantify. As systematic gridding in the vast cypress swamps of the western Everglades is cost prohibitive, all treatments have relied on aerial reconnaissance for several decades. In the absence of treatment costs for systematic gridding without the aid of maps for these areas, we calculated the estimated costs for these remote cypress swamps based on treatments in more accessible forested wetlands within the Everglades. Based on 14 treatments for small cypress swamps and tree islands between 2014 and 2016, systematic gridding in areas with moderate to low infestation levels averages $101 ha–1 (SFWMD, unpublished data). In comparison, the mean treatment cost for ground-based treatments with the aid of detailed maps in Big Cypress National Preserve between 2014 and 2017 is $3.1 ha–1 (Billy Snyder, Big Cypress National Preserve, personal communication), a 97% decrease in cost.
Concluding Remarks
The Everglades CISMA monitoring program is providing natural-resource managers within the Greater Everglades ecosystem with several monitoring and mapping products aimed at achieving affordable solutions to multiple objectives at different temporal and spatial scales. Utilizing DASM technology along with trained observers can provide reasonably accurate spatial data with rapid turnaround, even when weed densities are low (Petty et al. Reference Petty, Setterfield, Ferdinands and Barrow2012; Rodgers et al. 2014; Schrader-Patton Reference Schrader-Patton2003). We have adapted DASM methods for landscape-scale inventories, small-scale statistically designed monitoring to assess patch dynamics and temporal trends among the different regions within the landscape, and detailed mapping to support treatment activities of individual managers. Together, these three approaches for monitoring exotic plants work in combination to reduce management costs. Low-and-slow grid and outlier monitoring provides the most precise possible guidance to contractors and supports determinations of treatment effectiveness. GRTS panel monitoring helps to detect change and learn about localized causes of invasions. SRF flights provide an objective basis for recognizing and communicating the scope of the challenge and the landscape scale.
Invasive species management presents a set of challenges that are quite familiar to natural-resource managers but are perhaps surprisingly complex to other stakeholders who do not directly manage resources. Although ranchers, farmers, and land managers clearly understand the challenges imposed by rapidly spreading nuisance species, aligning the perspectives of folks who work with land and those who develop policy requires meaningful, effective, and consistent communication about the scale of the challenge, the nature of the risks, and the evidence that strategically designed actions are cost effective. Future refinements to the Everglades monitoring protocol will focus on developing multiscale risk maps for priority invasive species, expanding early-detection monitoring throughout the system, and incorporating UAVs for small-scale species mapping. Improvements in hyperspectral remote sensors and novel analytical methods are beginning to address the challenges of invasive species detection over large areas with high spatial variability (Hestir et al. Reference Hestir, Khanna, Andrew, Santos, Viers, Greenberg, Rajapakse and Ustin2008).
Acknowledgments
We thank geographers Amy Peters and Terri Bennett of the SFWMD for data processing and mapping assistance; pilots Gary Hansen, J.K. Wells, and Terry Jones of the SFWMD; Jerry Altland of Helicopter Applicators, Inc., and Dave Moruzzi and Leo Unzicker of Speed Aviation, Inc., for their safe and expert piloting. Funding for the programs presented in this article was provided by the SFWMD, USNPS, and US Fish and Wildlife Service.


