


Introduction
One of the biggest obstacles to achieving improved health in India is the accelerating burden of non-communicable diseases (NCDs) such as cardiovascular diseases (CVDs), hypertension and stroke in the working-age population (15–54 years) (de Burgos-Lunar et al., Reference de Burgos-Lunar, del Cura-González, Salinero-Fort, Gómez-Campelo, Pérez de Isla and Jiménez-García2013; GBD 2016 Risk Factors Collaborators, 2017). Hypertension is a significant risk factor for CVDs, contributing around 25% of the total NCD burden globally (de Burgos-Lunar et al., Reference de Burgos-Lunar, del Cura-González, Salinero-Fort, Gómez-Campelo, Pérez de Isla and Jiménez-García2013; GBD 2016 Risk Factors Collaborators, 2017). It is also a risk factor for cardio-renal diseases like atrial fibrillation and chronic kidney disease (CKD), and non-cardiovascular diseases such as dementia in middle age, cancer, oral health disorders and reduced bone metabolism (Kokubo & Iwashima, Reference Kokubo and Iwashima2015). The prevalence of hypertension is rising steadily in India in a range of 4–15% in urban areas and 2–8% in rural areas (Panda et al., Reference Panda, Pati and Sahu2015; Gupta et al., Reference Gupta, Gaur and Ram2019). The number of individuals with hypertension could increase to 213.5 million by 2025 from 118.2 million in 2000 (de Burgos-Lunar et al., Reference de Burgos-Lunar, del Cura-González, Salinero-Fort, Gómez-Campelo, Pérez de Isla and Jiménez-García2013).
The International Conference on Population and Development (ICPD) in 2019 suggested that India would maintain its present age structure, i.e. a higher proportion of individuals in the working-age group until 2040 (United Nations Population Fund, 2015). The working-age population in India is at higher risk of co-morbidities, including hypertension and a range of NCDs and communicable diseases, compared with other middle-income countries. The working population in India could boost the country’s economic development if appropriately utilized in the middle and later phases of the demographic transition. However, to achieve this, the working-age population needs to be healthy (Wei et al., Reference Wei, Wang, Wang, Li and Jiang2019).
The high burden of hypertension at young ages is inflicted by work-related stress, modifiable dietary and lifestyle practices, and other social factors that affect the well-being of individuals in general (O’Donnell et al., Reference O’Donnell, Denis, Liu, Zhang, Chin and Rao-Melacini2010; Gamage & Seneviratne, Reference Gamage and Seneviratne2016). India may suffer a loss of US$4.58 trillion before 2030 because of NCDs (Bloom et al., Reference Bloom, Cafiero-Fonseca, Candeias, Adashi, Bloom and Gurfein2014). This is crucial in the Indian context because it is essential that it uses its workforce to its full potential (Motkuri & Naik, Reference Motkuri and Naik2016). Prenissl et al. (Reference Prenissl, Manne-Goehler, Jaacks, Prabhakaran, Awasthi and Bischops2019) pointed out that, despite the rising burden of hypertension in India, around 87% of the total hypertensive population have never received any treatment, and approximately 92% of individuals currently taking anti-hypertensive medications still have high blood pressure levels. Also, as men constitute a significant proportion of India’s workforce, effective management and control of hypertension is necessary for increasing economic benefits (Motkuri & Naik, Reference Motkuri and Naik2016).
Hypertension is the most common CVD, and often remains undetected. In developed countries, a reduction in blood pressure (BP) related mortality is attributable to increased awareness, diagnosis, treatment and control. Even though the stable and high prevalence of hypertension is evident in Western countries, control rates of hypertension have improved more than two-fold over a period of 40 years (Rashid et al., Reference Rashid, Leonardi-Bee and Bath2003; Wolf-Maier et al., Reference Wolf-Maier, Cooper, Kramer, Banegas, Giampaoli and Joffres2004). On the other hand, studies in Asian countries have reported an increase in prevalence of hypertension because of fewer treatments and low control rates (Faizi et al., Reference Faizi, Ahmad, Khalique, Shah, Khan and Maroof2016).
Most countries have paraded the Rule of Halves (RoH) in relation to hypertension because of the asymptomatic nature of the condition. Wilber (Reference Wilber1973) was the first to establish the theoretical concept or framework of the RoH in the context of hypertension, where it works as follows: roughly half of patients with hypertension are not diagnosed; half of those diagnosed do not receive proper treatment for hypertension; and half of those who receive treatment do not have their blood pressure levels under control. Hypertension is thought to follow the RoH more closely in less-developed countries, and India, in particular, has a high risk of hypertension disease along with other NCDs. If the RoH is validated in India, one out of eight individuals with hypertension will have controlled blood pressure. Developed countries like Sweden and England have been shown to manifest the RoH framework for hypertension (Wilber, Reference Wilber1973; Wu et al., Reference Wu, Dodhia, Whitney and Ashworth2019; Weinehall et al., Reference Weinehall, Öhgren, Persson, Stegmayr, Boman, Hallmans and Lindholm2002). However, it is essential to verify the validity of RoH for South Asian countries such as India, where the epidemiological transition has been progressing apace. The RoH is equivalently applicable to explore the continuum of care for hypertension. The specific objectives of this study were: (1) to assess the burden of hypertension and unmet need for care among men aged 15–54 in India using data from the 2015–16 NFHS-4 and using the RoH framework; (2) to estimate the ‘gaps’ in the analytical levels of hypertension in Indian men by socioeconomic subgroups.
Methods
Study design
The study analysed individual data from the National Family Health Survey (NFHS-4), India, 2015–16. NFHS-4 employed a two-stage stratified sampling design, collecting data in urban and rural areas (International Institute for Population Sciences, 2017). In NFHS-4, clinical and anthropometric evaluation included random blood glucose and standardized blood pressure (BP) measurements. These were reported for men aged 15–54 years at the state level. The analysis was restricted to men, with non-missing information on selected covariates and systolic blood pressure (SBP) and diastolic blood pressure (DBP). Individuals were also excluded from the analysis if they had implausible BP values (SBP<70 mmHg or SBP>270 mmHg; DBP<50 mmHg or DBP>150 mmHg). Therefore, a sample of 101,433 men was selected for the final analysis.
Three BP readings were measured for every respondent by a certified and trained investigator according to the guidelines recommended by the American Heart Association (2018). An institutionalized mercury sphygmomanometer (OMRON BP Monitor) was used to measure BP. Depending on the respondent’s arm circumference, one of four cuffs, i.e. paediatric, regular adult, large or thigh, was used to measure their BP. The first BP reading was discarded, and the average of the last two readings was used to calculate the respondent’s BP level. The result was shared with the respondent immediately after the test was completed on a health card.
Dependent variable
Using a population-level framework, individuals were classified as hypertensive if their SBP was ≥140 mmHg or if their DBP was ≥90 mmHg, and those currently taking anti-hypertensive medication to lower their BP levels were also considered hypertensive (Asayama et al., Reference Asayama, Ohkubo, Kikuya, Metoki, Obara and Hoshi2005). Hypertension was categorized into three stages: Stage I (SBP 140–159 mmHg/DBP 90–99 mmHg), Stage II (SBP 160–179 mmHg/DBP 100–109 mmHg) and Stage III (SBP ≥180 mmHg/DBP ≥110 mmHg). Along with these, normal and pre-hypertensive individuals were defined as those with SBP <120 mmHg/DBP <80 mmHg and SBP 120–139 mmHg/DBP 80–89 mmHg, respectively (see Figure 1) (American Heart Association, 2018).
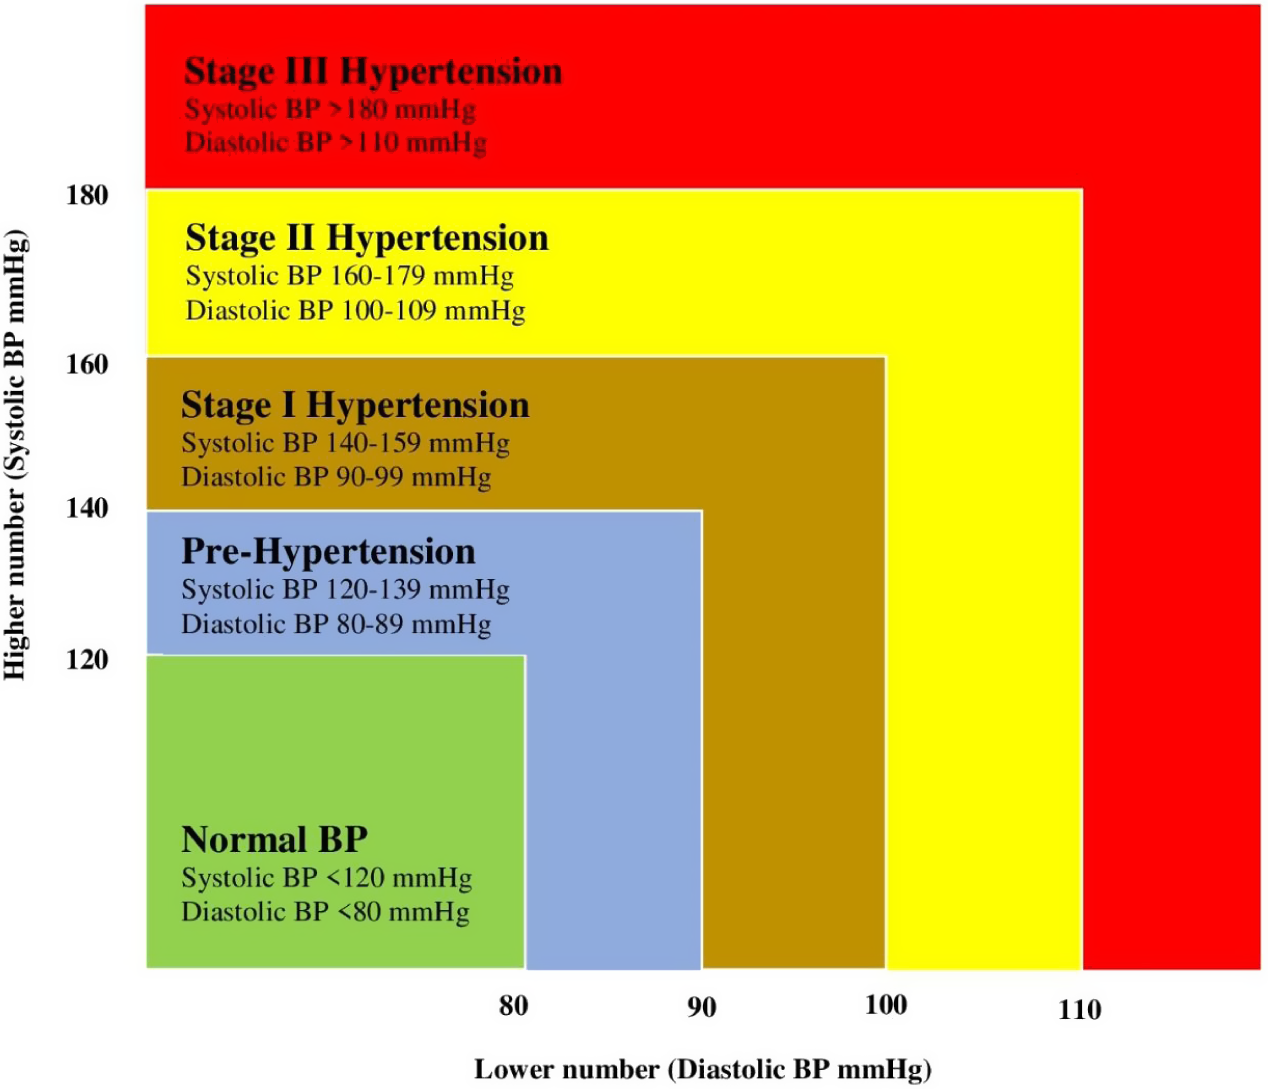
Figure 1. Classification of systolic and diastolic blood pressure levels, American Heart Association.
Hypertension cases were also classified into four types according to the individual’s screening, diagnosis, treatment and control status: (1) ‘screened’, i.e. those who reported they had ever tested for hypertension before the time of survey interview (the reference period of the NFHS-4); (2) ‘diagnosed’, i.e. those who reported having a high BP level at the time of the survey interview (self-reported hypertension); (3) ‘treated’, i.e. those who reported they were currently taking prescribed medicine to control their BP; and (4) ‘controlled’, i.e. those whose measured BP at the time of survey interview was <140/90 mmHg but who were continuing to take prescribed medicine to lower their blood pressure.
Furthermore, using four questions asked in the NFHS-4, five mutually exclusive and exhaustive categories of hypertensive individuals were created. Sixteen combinations were generated using permutations and combination of the four questions. Of these, eight are not considered as these were void categories. Of the remaining eight meaningful categories, three were normal categories showing no cases of hypertension at the time of the survey. The remaining five categories of hypertension were: (a) unscreened, (b) screened but undiagnosed, (c) diagnosed but untreated, (d) treated but uncontrolled and (e) controlled cases (Table 1). In addition, ‘unmet need’ was defined as the sum of the first four categories of hypertension, i.e. unscreened, screened but undiagnosed, diagnosed but untreated, treated but uncontrolled. Respondents with controlled blood pressure were not considered to have an unmet need for hypertension care. The RoH will expose gaps between the five categories of hypertension, with each gap representing the lost cases in the continuum of care of hypertension. These gaps will help in identify unmet need for hypertension care.
Table 1. Classification of hypertension into five mutually exclusive and exhaustive categories

Independent variables
The independent variables included in the study were based on Anderson’s health care utilization framework (Andersen, Reference Andersen1995), which identifies factors that lead to the use of health services, and can be divided systematically into three groups:
-
(1) Predisposing factors: age (15–24, 25–34, 35–44, 45–54 years), marital status (ever married, never married), education (no education, primary, secondary and higher), social class (Scheduled Caste/Tribe [SC/ST], Other Backward Classes [OBC], other), religion (Hindu, Muslim and other [Christian, Sikh, Jain and Buddhist]) and household size (≤4 family members, >4 family members).
-
(2) Enabling factors: wealth index (poor, middle and rich), health insurance status (yes, no), place of residence (rural, urban) and region of residence (North, North-East, Central, East, West and South).
-
(3) Risk factors: occupation (not working, agricultural worker, casual worker, salaried worker), tobacco consumption (yes, no), alcohol consumption (yes, no), body mass index (BMI kg/m2) (underweight: <18.5; normal: 18.5–24.99; overweight: 25–29.99; obese: ≥30), diet (healthy, unhealthy) and random blood glucose level (<140 mg/dl, ≥140 mg/dl).
Analysis
Sequential logistic random-effect regression models were used to examine the determinants of ‘gaps’ or lost cases in the continuation of hypertension care among the participants. Four models were applied to identify the determinants of ‘unscreened’, ‘screened but undiagnosed’, ‘diagnosed but untreated’ and ‘treated but uncontrolled’ hypertensive cases. Also, descriptive and bivariate analyses were performed to examine the association between the covariates and five hypertension categories, using models of the form:
 $${Y_{ij}} = {O_j} + {K_j}({X_{ikj}}) + {e_{ij}}$$
where Yij is the outcome variable (unscreened, screened but undiagnosed, diagnosed but untreated and treated but uncontrolled hypertensive cases; 1=Yes, 0=No) i.e. lost cases at each level of the RoH for men i in cluster (community) j; Oj is the intercept for the individual-level model (average risk of discontinuing at each level of RoH in cluster j); Xikj is the covariate (education, age group, wealth index, etc.); Kj is the coefficients for the individual-level covariates; and eij is the error terms for the individual-level model.
The intra-cluster correlation (ICC, ρ) was calculated for the dependent variable for a gap in each level of RoH. The latent variable method was used to calculate ρ (Curini et al., Reference Curini, Franzese, Steenbergen, Curini and Franzese2020), which indicates the proportion of the total variance at the cluster level, calculated as:
 $$\rho = {{\sigma _1^2} \over {\sigma _1^2\; + \;{\pi ^2}/3}}$$
where σ 1 2 is the variance between clusters and π2/3 is the estimated variance between individuals. The proportion of explained variance (σ e 2) explained by clusters considered in the model, i.e. explained by different blocks of covariates, were then calculated using the formula:
 $$\sigma _e^2 = {{\sigma _i^2 - \sigma _{ii}^2} \over {\sigma _i^2}}$$
where σe 2 is the explained variance, σi 2 is the variance in the initial or empty model and σii 2 is the second-level variance in the models with various blocks of covariates.
The random-effects logistic regression model is a hierarchical model that assumes that the collected data are drawn from the hierarchy of populations, and their differences relate to that hierarchy. The model is used for controlling unobserved heterogeneity in the sample. Adjusted odds ratios (OR) with 95% confidence intervals (CI) were calculated to assess the likelihood of the association of gaps in hypertension continuum care with their selected covariates. All the estimates provided in this study were derived by applying appropriate sampling weights in the NFHS-4 dataset. The analyses were performed on a total of 101,433 hypertensive cases of men using STATA version 15.0. Data visualizations were performed using Excel 2016.
Results
Participants’ background characteristics
Table 2 presents the descriptive statistics of the study sample (N=101,433). Approximately one-third (31.5%) of the men belonged to 15–24 year age group. Around 57.3% had completed secondary education and 45.0% belonged to OBCs. The analytic sample were predominately rural residents (63.0%) and of the Hindu religion (83.6%). Thirteen per cent came from the North region, 2.9% from the North-East region, 23.7% from the Central region, 18.3% from the East region, 18.4% from the West region and 23.6% from the South region. Around 59.5% had a household size of four or more. Additionally, 54.0% didn’t consume tobacco, 30.1% consumed alcohol and 19.5% were overweight or obese.
Table 2. Descriptive statistics of study sample, NFHS-4, India, 2015–16

Participants’ blood pressure levels
Table 3 shows the prevalences of the different stages of hypertension among the participants by their background characteristics. The prevalences of normal BP and pre-hypertension in the sample were 42.2% and 43.2%, respectively. About 16.0% of the men had hypertension (see Table 4, column B), with 11.0% at Stage I, 2.5% at Stage II and only 1.0% at Stage III (p<0.001) (see Table 3). The prevalence of hypertension was significantly higher (p<0.001) in the old age group (see Table 4, column B).
Table 3. Prevalence (%) of hypertension status categories by participants’ background characteristics, NFHS-4, India, 2015–16

***p < 0.01.
Table 4. Prevalence of hypertension by screening, diagnosis, treatment and control levels by participants’ background characteristics, NFHS-4, India, 2015–16

‘Prevalence’ is for the total sample; ‘Conditional prevalence’ represents the respondent achieving at each step given that he already has hypertension.
Table 4 displays the overall prevalence of hypertension among the participants by background characreristics. Those aged 15–24 years had a lower prevalence of hypertension (4.7%) than those in the other age groups: 12.9% for those aged 25–34 years, 22.5% for those aged 35–44 years and 28.9% for those aged 45–54 years. The prevalences of hypertension in ever-married and never-married men were 20.3% and 6.4%, respectively, i.e. 3-fold higher among ever-married than among never-married men. Overall, the prevalence of hypertension was highest in the weathiest (rich) population (18.9%). The prevalence of hypertension in urban areas (17.5%) was higher than that in rural areas (14.3%). The prevalence of hypertension among salaried men (20.7%) was higher than that in other workers (15.8% in agricultural and 16.5% in casual workers). The prevalence of hypertension increased monotonically with BMI, progressing from 6.1% in underweight men to 38.7% in obese men.
Decomposition analysis of hypertensive individuals
Table 4 also shows the five mutually exclusive and exhaustive categories of hypertensive individuals by background characteristics. More than one-third of the men with hypertension were unscreened (Column D); 40.5% were screened but not diagnosed; 8.6% were diagnosed but not treated; and 6.3% were treated but uncontrolled (Columns F, H and J). Only 6.1% of hypertensive men had controlled blood pressure.
Younger men aged 15–24 years were at a higher risk of being unscreened (56.3%) than older men aged 45–54 years (29.7%). The proportion of unscreened men was higher in rural (41.5%) than in urban areas (30.21%). Men working in agriculture showed a high proportion of unscreened compared with salaried men. The proportion unscreened among poor men (51.4%) was higher than among rich men (24.1%) (Table 4, Column D).
An inverse trend was observed for those who were screened but undiagnosed. While it was evident for all socioeconomic and demographic characteristics, the reverse trend was most striking by wealth index. The percentage of screened but undiagnosed individuals varied from 34.7% in the poor, 40.9% in the middle and 49.2% in the rich (Table 4, Column F). Rich people were more likely to be both treated but uncontrolled as well as controlled compared with non-rich people (Table 4, Columns J and L).
Geographical distribution of hypertensive individuals
Table 5 shows the percentage of hypertensive individuals by screening, diagnosis, treatment and control (RoH) levels and by the states and UTs of India. The percentage of unscreened hypertensive individuals was high in most Indian states and UTs. Odisha (53.0%), Madhya Pradesh (50.7 %), Uttar Pradesh (47.2%) and Daman & Diu (47.2%) showed the highest proportions of unscreened men, whereas Chandigarh, Goa, Punjab and Kerala showed the lowest percentages. The ‘screened but undiagnosed’ category of hypertension varied from 65.3% in Lakshadweep to 20.9% in Daman and Diu; ‘diagnosed but untreated’ varied between 39.0% in Puducherry and almost zero in Chandigarh, Dadar & Nagar Haveli and Lakshadweep; ‘treated but uncontrolled’ varied between 26.9% in Chandigarh and 1.6% in Nagaland; and ‘controlled’ varied from 23.4% in Daman & Diu to 1.0% in Manipur.
Table 5. Prevalence of hypertension screening, diagnosis, treatment and control levels of participants across states and UTs, NFHS-4, India, 2015–16

Unmet need for hypertension care
Figure 2 presents a flowchart of the percentage of men receiving care at each level of RoH. At the national level, of the total 16,254 hypertensive men aged 15–54 years, 63.2% (10,314) were screened, 21.5% (3428) were diagnosed, 12.6% (1862) were treated and only 6.1% (905) were having their blood pressure controlled. Almost 63% (10,314) were screened for hypertension – a loss of 36.5% (5940) at the first level (screening stage). Among men who were screened, 33.2% (3428) were diagnosed with hypertension, confirming a loss of 66.8% (6886) at the second level (screened but undiagnosed). Of those diagnosed with hypertension, only 54.3% (1862) went for effective treatment, giving a loss of 45.7% (1566) at the third level (diagnosed but untreated cases). Among men currently under hypertensive medication, 48.6% (905) had their BP under control – again, a loss of 51.4% (957) at the fourth level (treated but uncontrolled cases). These outcomes confirm a significant loss at each level of the RoH, showing that hypertensive men in India exhibit the Rule of Halves: approximately one-third at the first level, two-third at the second level and about half at the third and fourth level each. Only 6.1% (905) had their BP under control. Also, the unmet need for hypertension care was 93.9% among the participating men.

Figure 2. Cascades in hypertension care and percentage loss at each stage, NFHS-4, India, 2015–16.
Results of regression analysis
Table 6 presents the results of the four sequential random-effect logistic regression models for men with hypertension and not receiving hypertension care. For each model applied for RoH level, the intra-class correlation coefficient within states/UTs (ρ) was used to measure the proportion of variation in the loss of patients within states/UTs. Model I shows the determinants for unscreened cases in hypertensive men. The chance of having unscreened hypertension were 62% (OR=1.62; 95% CI: 1.46–1.80) higher in men aged 25–34 years than those aged 15–24 years. Men with higher education had 0.3 times lower odds of having unscreened hypertension (OR=0.73; 95% CI: 0.65–0.83) than men with only primary education. Muslim men had a 19% (OR=0.81; 95% CI: 0.72–0.81) higher chance of having unscreened hypertension than Hindu men. Men from rural areas had 1.07 (OR=1.07; 95% CI: 0.98–1.16) higher odds of having unscreened hypertension than those from urban areas. The odds of having unscreened hypertension increased 2.9 times (OR=2.85; 95% CI: 2.42–3.36) for obese men compared with underweight men. The ρ of Model I was 0.15 (CI: 0.14–0.17), implying that variation within the state accounted for 15% of the total variation in unscreened hypertension, with individual characteristics causing the remaining 85% of variation.
Table 6. Predictors of unscreened, screened but undiagnosed, diagnosed but untreated and treated but uncontrolled hypertension among men, NFHS-4, India, 2015–16

Ref.: reference category; OR: Odds Ratio; CI: Confidence Interval.
*p < 0.1; **p < 0.05; ***p < 0.01.
Model II shows the determinants for screened but undiagnosed cases of hypertensive men. Factors showing significant association in Model I were also significant in Model II – except for respondent’s religion. The ρ of Model II was 0.14 (95% CI: 0.13–0.16). All the covariates found to be significant in Model II were significant in Model III, and the ρ for this model was 0.27 (95% CI: 0.24–0.31), i.e. 27%. Model IV explores the effect of correlates on treated but uncontrolled cases of hypertensive men. The covariates show the effect on this level of RoH among hypertensive men, similar to other models. Compared with the previous models, the effects of obesity on treated but uncontrolled hypertensive men were slightly high (OR=7.57; 95% CI: 5.04–11.38). The ρ of Model IV was 0.20 (95% CI: 0.15–0.26), implying that variation within the state accounted for 20% of the total variation in treated but uncontrolled hypertension, with individual characteristics causing the remaining 80% of variation.
Discussion
This study examined the burden of hypertension and unmet need for hypertension care among men of working age (15–54 years) from all 36 states and Union Territories of India. The results showed that around 36.5% had never been screened for hypertension, 40.5% had been screened but had not been diagnosed with hypertension and 8.6% had been diagnosed but had never received any treatment in 2015–16. Only 6.1% had controlled blood pressure. Moreover, 93.9% of the men currently consuming anti-hypertensive medication had an elevated BP level. These findings are in concordance with the existing literature on hypertension proposing the validity of the Rule of Halves in rural India (Faizi et al., Reference Faizi, Ahmad, Khalique, Shah, Khan and Maroof2016).
The escalating rates of hypertension in India have made it a critical public health concern in the country. However, in the case of self-reported hypertension rates, the burden seems low because the vast majority of the population are not aware of their elevated BP status (Prenissl et al., Reference Prenissl, Manne-Goehler, Jaacks, Prabhakaran, Awasthi and Bischops2019; Puri et al., Reference Puri, Singh and Srivastava2020). However, this is just the tip of the iceberg; none of the categories of hypertension management, i.e. diagnosis, treatment and control, has reached an optimal standard, and there is a need for improvement at every stage in India’s hypertension care cascade.
The study revealed that there was low screening coverage in the East region of India in 2015–16 (Odisha, Bihar and Jharkhand), followed by the Central region (Uttar Pradesh and Chhattisgarh). All these states have a low median age, i.e. a higher proportion of young population under the age of 25 years. However, studies have highlighted an increasing prevalence of hypertension among India’s working-age groups (Ramakrishnan et al., Reference Ramakrishnan, Zachariah, Gupta, Shivkumar Rao, Mohanan and Venugopal2019). A study on hypertension reporting heterogeneity, i.e. the gap between self-reported and clinically diagnosed hypertension, in India has suggested that respondents in the younger age groups are more prone to report that they do not suffer from hypertension. However, their clinical results state otherwise. The primary reason is that they have never been screened for the condition, so they are unaware of their actual health status (Puri et al., Reference Puri, Singh and Srivastava2020). This could be because of the general notion that hypertension is uncommon in younger age groups. Therefore younger men might consider screening to be unnecessary (Benetos et al., Reference Benetos, Petrovic and Strandberg2019).
The coverage of treatment has been found to be lower in the North-East region (the states of Nagaland, Sikkim, Manipur and Mizoram), followed by the North region (the states of Haryana, Punjab and Himanchal Pradesh) (Kasthuri, Reference Kasthuri2018). Moreover, the North-East region (the states of Manipur, Nagaland, Assam, Mizoram and Arunachal Pradesh), followed by the Central region (the states of Uttrakhand and Chhattisgarh), have the lowest control rates, even after receiving treatment. The probable reason for this is the fragile health care infrastructure in these regions (Saikia & Das, Reference Saikia and Das2012; Prinja et al., Reference Prinja, Kanavos and Rajesh2012), which is lacking one or more of the 5 ‘A’s, i.e. Awareness (of health), Access (to health care), Absence (of human power in health care), Affordability (for the cost of health care), and Accountability (of health care) (Kasthuri, Reference Kasthuri2018).
This study further found that age, obesity, alcohol consumption and occupation were significantly associated with unscreened, undiagnosed, untreated and uncontrolled hypertension cases among men aged 15–54 years in India. Unscreened cases were highest in the age group 25–34 years, i.e. the comparatively young age group. In contrast, undiagnosed, untreated and uncontrolled cases were highest in those aged 45–54 years. The dominance of unscreened cases among the younger age group could be due to assumption that hypertension is generally associated with the older population. Moreover, uncontrolled hypertension cases could be caused by the biological changes that occur in the arteries with the respondent’s age (Herxheimer et al., Reference Herxheimer, Dahlöf, Lindholm, Hansson, Scherstén and Ekbom1992; Pinto, Reference Pinto2007).
Obesity and alcohol consumption were found to be significant predictors of unscreened, undiagnosed, untreated and uncontrolled cases of hypertension in the study men, suggesting that this population is generally unaware of good health and lifestyle behaviour and tend to remain unaware of existing health conditions due to a lack of diagnosis. Furthermore, previous studies suggest that the regular consumption of alcohol can cause a substantial rise in blood pressure levels, leading them to be uncontrolled and resulting in chronic hypertension (Maheswaran et al., Reference Maheswaran, Gill, Davies and Beevers1991; Husain et al., Reference Husain, Ansari and Ferder2014). In addition, alcohol contains sugar and calories in high concentrations, which can lead to increases in BMI and obesity – significant risk factors for uncontrolled BP levels among men in the younger age groups (Sayon-Orea et al., Reference Sayon-Orea, Martinez-Gonzalez and Bes-Rastrollo2011; Traversy & Chaput, Reference Traversy and Chaput2015). The study also showed a preponderance of unscreened, untreated and uncontrolled hypertension cases among men aged 15–54 years. The primary reasons for this could be the affordability of medication and hypertension care services in India. Additionally, psychological stress caused by unemployment could lead to uncontrolled high blood pressure levels, even after receiving anti-hypertensive treatment (Shekhar & Shil, Reference Shekhar and Shil2020).
This study’s primary strength was its use of national-level data that included both self-reported and standardized measured SBP and DBP. Another important strength was the use of a continuum of care to depict population-level estimates for the individuals who make it through each stage of the care continuum from screening to hypertension control. However, the study had its limitations. It only considered men of working age (15–54 years), so the findings should not be extrapolated to women or older men. Secondly, it was based on cross-sectional data, so the actual loss of patients in the continuum of care for hypertension could be different.
In conclusion, India is being confronted with several health challenges simultaneously. These are manifold and include high burdens of maternal and child mortality and infectious disease and an accelerating non-communicable disease burden (Arokiasamy & Yadav, Reference Arokiasamy and Yadav2014; Munshi et al., Reference Munshi, Yamey and Verguet2016). Estimates from the present study suggest that hypertension is a significant public health concern among men in the 15–54 year age group, and poor management of hypertension is indisputable at both the national and sub-national level. There are wide gaps in screening, diagnosis, treatment and control of hypertension among different sub-groups in India, and the present study identified specific risk groups for effective hypertension care management by considering several socioeconomic and demographic factors at the individual level. These findings may assist the accountable authorities by providing vital insights at the individual level utilizing nationally represented data. Community-level measures to ensure increased hypertension detection and control should be promoted. Additionally, social marketing strategies are needed to educate the population on the importance of maintaining an optimal body weight and having regular health check-ups at all ages. The involvement of the private sector in the sustainable management of hypertension should be encouraged. If left uncontrolled, hypertension can have severe implications for an individual’s work performance, resulting in increased health care costs, absenteeism and loss of productivity. Therefore, it is crucial to study cascades in India’s hypertension care to ensure optimal work productivity and economic development. Further research is needed to explore the socioeconomic inequalities and their significant determinants and the association of hypertension with other morbidities such as diabetes in India.
Acknowledgments
The authors are thankful to the DHS programme for offering access to the NFHS-4 datasets.
Funding
This research received no specific grant from any funding agency, commercial entity or not-for-profit organisation.
Conflicts of Interest
The authors have no conflicts of interest to declare.
Ethical Approval
The authors assert that all procedures contributing to this work comply with the ethical standards of the relevant national and institutional committees.


