Introduction
Over the past two centuries the polar regions have been undergoing rapid change, including notable alterations in sea ice extent and duration (Thomas Reference Thomas2017 and references therein). Sea ice has decreased in parts of the Southern Ocean, such as the Antarctic Peninsula Region (Thomas Reference Thomas2017 and references therein). However, in the Ross Sea sector especially, but also in the Indian Ocean sector of the Southern Ocean, sea ice has been increasing in both area and duration (Thomas Reference Thomas2017 and references therein). The spatial variability in sea ice changes around Antarctica indicates a complex response to interacting factors (Thomas Reference Thomas2017 and references therein). Increases in sea ice extent in recent decades appear to have been influenced by wind patterns as a function of mid-latitude warming, including factors related to the Interdecadal Pacific Oscillation (Thomas Reference Thomas2017 and references therein). The moderate increase in overall sea ice extent around Antarctica has also been linked more directly to anthropogenic activities, including atmospheric warming at mid-latitudes and human use of chlorofluorocarbons that destroyed ozone over the polar region. These factors have changed wind patterns such that increased winds blow new, forming sea ice further from the continent, thickening as it moves away, with the end result being greater areal extent of sea ice (Thomas Reference Thomas2017 and references therein).
Changes in sea ice distribution, which seasonally covers 7% of the world’s surface, have the potential to alter marine ecosystem dynamics (Thomas Reference Thomas2017). In the Antarctic, distribution of sea ice, and its irradiance shading capacity, largely governs the location and timing of primary production in coastal (Arrigo et al. Reference Arrigo, van Dijken and Strong2015) and adjacent ocean regions that are seasonally covered by sea ice (Comiso et al. Reference Comiso, Maynard, Smith and Sullivan1990). Sea ice strongly affects the amount and quality of light available for photosynthesis (Thomas Reference Thomas2017) and for hunting by visual predators, including both invertebrates and vertebrates (Hamner & Hamner Reference Hamner and Hamner2000, Zimmer et al. Reference Zimmer, Wilson, Beaulieu, Ancel and Plötz2008). Variation in the amount of irradiance reaching the water column depends on seasonal and interannual differences in sea ice thickness, extent and snow cover (SooHoo et al. Reference SooHoo, Palmisano, Kottmeier, Lizotte, SooHoo and Sullivan1987). Sea ice also impedes surface gas exchange with the atmosphere and limits surface mixing (Thomas Reference Thomas2017 and references therein). The absence of mixing may contribute to low levels of water column primary productivity because of depleted iron concentrations in the near-surface waters (Tagliabue et al. Reference Tagliabue, Sallée, Bowie, Lévy, Swart and Boyd2014).
Large-scale studies encompass hemispheric-scale relationships between physical processes and sea ice variability, but can also obscure smaller scale patterns that are important in local systems. Most long-term studies have focused on pack ice, the mobile pieces of ice that make up most sea ice, but not fast ice, which is fixed in place by attachment to land, glaciers, grounded icebergs or ice shelves. Rarely has fast ice been considered because it is difficult to distinguish from coastal ice and snow in satellite imagery. However, time series of fast ice have been recorded for the South Orkney Islands (mostly from visual observations, Murphy et al. Reference Murphy, Clarke, Symon and Priddle1995), areas of East Antarctica (Fraser et al. Reference Fraser, Massom, Michael, Galton-Fenzi and Lieser2012) and Victoria Land (Ainley et al. Reference Ainley, Larue, Stirling, Stammerjohn and Siniff2015). Owing to its temporal and spatial stability, fast ice can play a large role in coastal physical and biological marine dynamics. However, existing summaries of changes in sea ice extent at coarse scales may conceal the local dynamics that impact nearshore systems. Fast ice can protect ice shelf fronts from impacts of floating icebergs (Langhorne et al. Reference Langhorne, Hughes, Gough, Smith, Williams, Robinson, Stevens, Rack, Price, Leonard, Mahoney, Haas and Haskell2015 and references therein) or erosive effects of currents (Hellmer et al. Reference Hellmer, Kauker, Timmermann, Determann and Rae2012), and may also slow ice shelf crack propagation and iceberg calving events (Langhorne et al. Reference Langhorne, Hughes, Gough, Smith, Williams, Robinson, Stevens, Rack, Price, Leonard, Mahoney, Haas and Haskell2015 and references therein). For some marine animals and birds, the fast ice surface provides an important platform for breeding and/or moulting (Ainley et al. Reference Ainley, Larue, Stirling, Stammerjohn and Siniff2015). As a physical barrier that damps wave action and local wind-induced currents, fast ice also impacts benthic animals. Particularly in shallow depths, the lack of wave motion results in less sediment resuspension and scouring, which reduces stress on soft-bodied organisms (e.g. Sahade et al. Reference Sahade, Lagger, Torre, Momo, Monien, Schloss, Barnes, Servetto, Tarantelli, Tatián, Zamboni and Abele2015). Soft-bodied invertebrates are a dominant component of Antarctic nearshore benthic ecosystems (Thrush et al. Reference Thrush, Dayton, Cattaneo-Vietti, Chiantore, Cummings, Andrew, Hawes, Kim, Kvitek and Schwarz2006) and this may in part be due to the low scour under a fast ice surface. Finally, fast ice, owing to its greater stability and persistence, has a rich microbial community that is distinct from that in pack ice (Arrigo et al. Reference Arrigo, Mock and Lizotte2010). Fast ice and pack ice may respond differently to climate change, and shifts may have different ramifications for the many dependent biological systems (e.g. Langhorne et al. Reference Langhorne, Hughes, Gough, Smith, Williams, Robinson, Stevens, Rack, Price, Leonard, Mahoney, Haas and Haskell2015 and references therein).
Interactions between icebergs that calve from ice shelves and sea ice are bidirectional, and grounded icebergs in particular influence fast ice (Fraser et al. Reference Fraser, Massom, Michael, Galton-Fenzi and Lieser2012). Mega-icebergs that calved from the Ross Ice Shelf in 2000 moved close to the entrance of McMurdo Sound, became temporarily stuck and persisted in the vicinity for five years (Brunt et al. Reference Brunt, Sergienko and MacAyeal2006). The mega-icebergs (B15 and C16, and the smaller pieces resulting from their break up) pinned the coastal sea ice in place and allowed it to thicken into multi-year fast ice that was further resistant to breakout. The mega-icebergs interrupted the normal movement of sea ice and, to a lesser degree, surface water within eastern McMurdo Sound during most of the years they were present (Robinson & Williams Reference Robinson and Williams2012), with corresponding ecological changes in the benthic community (Conlan et al. Reference Conlan, Kim, Thurber and Hendrycks2010), a local decline in zooplanktonic pteropods (Seibel & Dierssen Reference Seibel and Dierssen2003) and temporary emigration of some predator populations (Emslie et al. Reference Emslie, Berkman, Ainley, Coats and Polito2003). The exclusion of air-breathing predators from McMurdo Sound may have in turn affected the benthic fish fauna (Buckley Reference Buckley2013).
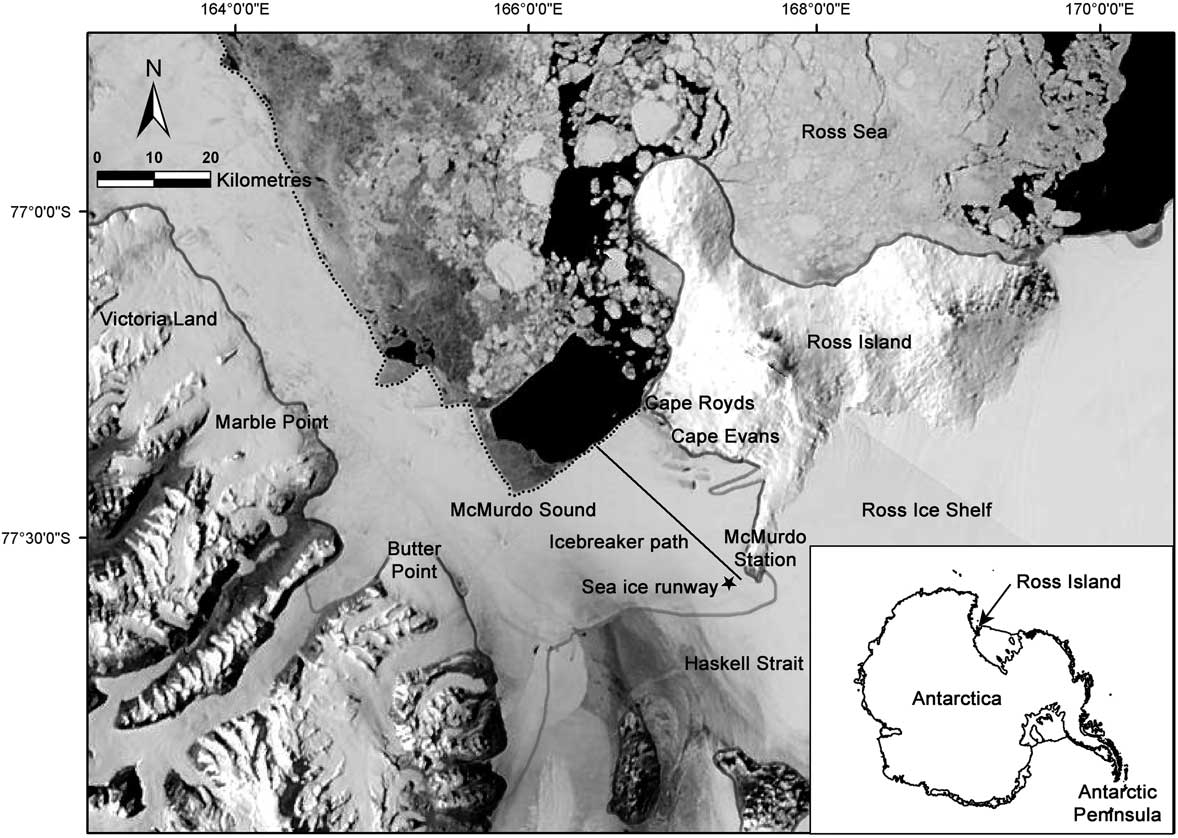
Southern Ocean ecosystems may be less altered by human activity than other marine ecosystems (Halpern et al. Reference Halpern, Walbridge, Selkoe, Kappel, Micheli, D’Agrosa, Bruno, Casey, Ebert, Fox, Fujita, Heinemann, Lenihan, Madin, Perry, Selig, Spalding, Steneck and Watson2008), although in polar regions particularly, indirect human impacts through climate change are significant (Thomas Reference Thomas2017 and references therein). Despite the minimal and transitory human population in Antarctica, research bases form focal points of direct human disturbance (Tin et al. Reference Tin, Fleming, Hughes, Ainley, Convey, Moreno, Pfeiffer, Scott and Snape2009). Since 1956, the largest Antarctic base, McMurdo Station, has been supported by icebreakers that annually cut an access channel through the McMurdo Sound fast ice to allow passage of supply vessels (Fig. 1). McMurdo Station has also maintained an aircraft sea ice runway on the adjacent fast ice during the spring before icebreaker arrival, and in conjunction, amassed a time series of fast ice thickness and temperature. Because McMurdo Station is a major research base and logistics hub, detailed satellite images and weather records for the area are also available.

Fig. 1 MODIS image of the McMurdo Sound region on a representative clear day (22 November 2015). The grey line indicates land/glacier/ice shelf edges, the dotted line indicates the fast ice-edge. The fast ice-edge is ~35 km from McMurdo Station; typical during winter, spring and summer before fast ice retreat. The black line indicates the standard annual path of an icebreaker through the fast ice. The star indicates the location of the ‘sea ice runway’ where fast ice thickness and temperature data were collected. Coastlines are derived from the SCAR Antarctic Digital Database v6.0.
Herein the local fast ice dynamics in McMurdo Sound in the southern Ross Sea are examined. In essence, this paper seeks to establish a climatology for regional fast ice and to test whether or not that climatology has remained consistent or is changing; it assesses whether the fast ice regime has been stable at this most southerly site of seasonally open ocean. Local-scale records of the seasonal extents of fast ice in McMurdo Sound for 1978–2015 (the satellite era) are presented. Also presented are direct measurements of fast ice thickness and temperature, and regional records of wind velocity are used to assess effects on fast ice formation and break-up. These datasets are used to evaluate the effects of climate variability and direct human disturbance on fast ice stability in McMurdo Sound. The hypothesis that the fast ice regime in McMurdo Sound has not changed in the past several decades is tested, including whether the icebreaker channel influences the persistence of fast ice in McMurdo Sound, and potential implications for the ecosystem are identified.
Materials and methods
Study area
McMurdo Sound is c. 55 km wide and long and is located at the southern end of the Ross Sea, with Ross Island to the east, the Antarctic continent (Victoria Land region) to the west, and the Ross and McMurdo ice shelves to the south (Fig. 1). This region is the southernmost navigable body of water in the world, and is home to a large number of Emperor and Adélie penguins (Aptenodytes forsteri Gray and Pygoscelis adeliae Hombron & Jacquinot), Weddell seals (Leptonychotes weddellii Lesson), Antarctic minke and killer whales (Balaenoptera bonaerensis Burmeister and Orcinus orca L.) (Ainley et al. Reference Ainley, Larue, Stirling, Stammerjohn and Siniff2015, Reference Ainley, Lindke, Ballard, Lyver, Jennings, Toniolo, Pennycook, Massaro and Santora2017), a robust mid-water food web (Eastman Reference Eastman1985) and a rich benthic ecosystem (Conlan et al. Reference Conlan, Kim, Thurber and Hendrycks2010).
The western and eastern portions of McMurdo Sound have different regimes. i) The west side is relatively shallow (200–400 m), gradually sloping upward toward the continent (Victoria Land), while a deep trench (600–700 m) lies along the eastern side of the Sound (Ross Island). ii) A cold, northward flowing current originating under the Ross and McMurdo ice shelves exits on the west side, and a warmer, southward current from the Ross Sea flows on the east side at least seasonally, with corresponding differences in other water properties (Langhorne et al. Reference Langhorne, Hughes, Gough, Smith, Williams, Robinson, Stevens, Rack, Price, Leonard, Mahoney, Haas and Haskell2015 and references therein). iii) The west side fast ice is historically persistent over multiple years, while east side fast ice is generally annual (Thrush et al. Reference Thrush, Dayton, Cattaneo-Vietti, Chiantore, Cummings, Andrew, Hawes, Kim, Kvitek and Schwarz2006). In fact, fast ice on the west side has been largely persistent for the last 2000 years (Emslie et al. Reference Emslie, Berkman, Ainley, Coats and Polito2003). The northern extent of the fast ice-edge usually runs east–west across the Sound from Cape Royds on Ross Island toward Butter Point, Victoria Land, but before reaching the latter turns abruptly north on the western side (Fig. 1). The L-shaped corner where these two hydrographic and sea ice regimes meet is a hotspot for pelagic predators (Ainley et al. Reference Ainley, Lindke, Ballard, Lyver, Jennings, Toniolo, Pennycook, Massaro and Santora2017, Pitman et al. Reference Pitman, Fearnbach and Durban2018, Saenz et al., unpublished data).
Satellite data
Satellite imagery was used to quantify fast ice trends in visible wavelength images from the Moderate-resolution Imaging Spectroradiometer (MODIS) aboard the Aqua and Terra satellites (250 m resolution; processing occurred for 2002/03–2014/15 seasons and Terra satellite data from 2000–02 were not used) and sea ice concentration was derived from the Scanning Multichannel Microwave Radiometer and Special Sensor Microwave Imager family passive microwave sensors (hereafter, SSM/I; 25 km resolution, 1978/79–2014/15). For simplicity, hereafter each summer season is referred to by the first of the two years involved, i.e. 2002 refers to the 2002/03 spring/summer. Seasons are defined classically, i.e. 21 December is first day of summer. MODIS data were acquired in one of two ways, from either processing of level 1 swath data into ‘true colour’ images using SeaDAS software v6.4 (2002–12) or from the corrected reflectance (true colour) layers of the NASA Worldview website (http://worldview.earthdata.nasa.gov/, 2012–15). The visual MODIS images, which use visible wavelength bands, are available only for the months when there is sunlight, generally October to April. Although MODIS near-infrared based ice and snow temperature data are available outside of the sunlit period, they are not used because fast ice cannot be distinguished from pack ice in this dataset and cloud masking limits its usefulness for determining the timing of sea ice concentration changes. For MODIS images, McMurdo Sound was divided into six zones that permit analysis of the distinct fast ice regimes found in these areas, particularly the west side (zones 3 and 4, Fig. 2a) and east side (zones 1 and 6). Fast ice areas are generated manually from clear sky images by drawing polygons in GIS software; mobile pack ice is excluded from analysis. Fast ice in MODIS imagery is sometimes obscured by clouds, so linear interpolation was used between valid data obtained on clear image days. From the MODIS imagery, the direct linear distance between McMurdo Station and the nearest fast ice-edge was measured by calculating the minimum distance between the open water-facing edges of fast ice polygons and McMurdo Station. The MODIS data are available for fewer years than SSM/I but offer detailed near-coastal imagery that allows separate assessment of ecologically relevant areas on the sides of the Sound. In contrast, the SSM/I records are available for all months of the year since 1978, but only a total of seven pixels in the 25 km polar stereographic projection encompass McMurdo Sound (Fig. 2b). For each pixel, daily or bi-daily fractional sea ice cover is extracted from data available at the National Snow and Ice Data Center (NSIDC). The SSM/I ice concentration is retrieved from the NSIDC website and ftp site (http://nsidc.org/data/seaice/). To minimize the biases inherent to the different data processing algorithms and in order to reduce the daily variability introduced by the movement of pack ice, the maximum of either the Bootstrap or NASATEAM processed values were taken (Comiso Reference Comiso2000, Cavalieri et al. Reference Cavalieri, Parkinson, Gloersen and Zwally2015) and then a 5 day median filter was used to smooth changes in sea ice concentration. The sea ice concentration algorithms may be less reliable at high sea ice concentrations (Connolley Reference Connolley2005), i.e. oscillations in fractional sea ice cover between 0.8 and 1.0 are common for heavy ice cover, although the ice cover is not significantly changing. To further compensate for short-term oscillations, ice concentrations >80% were masked when extracting the dates of changes in sea ice cover. For detecting the timing of sea ice changes, sea ice concentrations <15% are excluded from the analysis, following the methods of Comiso & Steffen (Reference Comiso and Steffen2001).
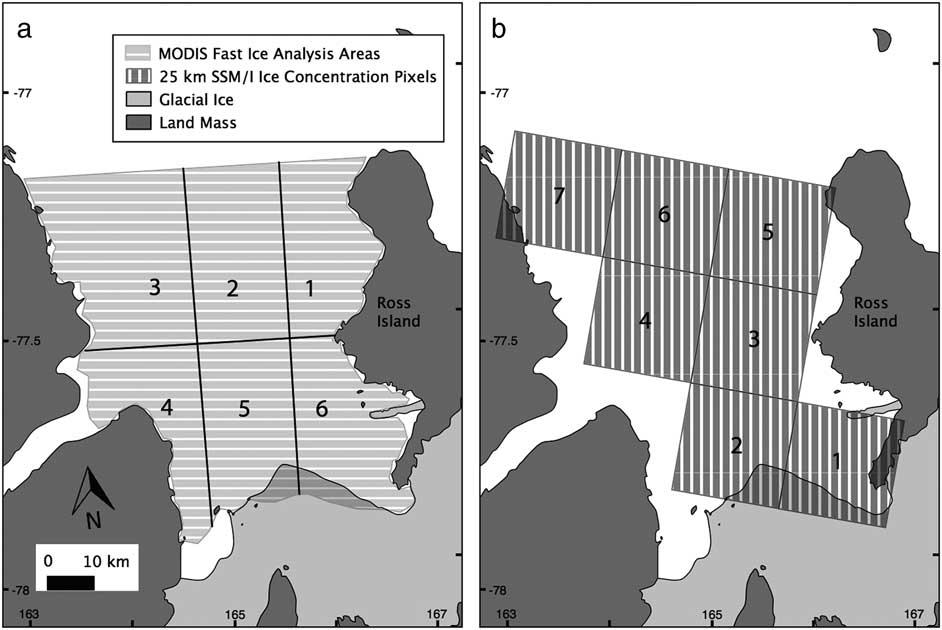
Fig. 2 McMurdo Sound divisions for satellite analyses. a. The six zones analysed using visual MODIS satellite data. White areas in the southern Sound indicate areas of persistent multi-year fast ice or glaciers that were not considered in the analysis. b. The regions of the seven pixels of SSM/I satellite data covering McMurdo Sound. Small amounts of land (mostly glaciated) and ice shelf contaminate pixels 1, 2, 5 and 7. Map data are from the SCAR Antarctic Digital Database v6.0 as distributed through Quantarctica QGIS package by the Norwegian Polar Institute.
Field measurements
The icebreaker channel from the fast ice-edge to McMurdo Station has been created each year since 1956, with the location of the channel remaining consistent, by and large, over the entire period. The channel location was initially selected to allow the prevailing south-easterly wind to blow broken ice seaward to aid in clearing the channel (Phil McGillivary, personal communication 2016). Dates of the icebreaker arrival at the fast ice-edge and/or at McMurdo Station since 1957 are acquired from scientist and icebreaker logbooks and contractor records (DACS 2012, Phil McGillivary, personal communication 2016), along with the distance, which was measured by radar from the fast ice-edge to McMurdo Station on the date that the icebreaker began breaking fast ice.
Fast ice thickness and temperature data, used to monitor the fast ice as an aircraft landing and take-off platform, are recorded monthly by the United States Antarctic Program (USAP) logistic support contractors and are provided by the Ice Surveyor (Jeff Scanniello) for 1986–2014, except for 2008 and 2014 when the sea ice runways were not built. Fast ice measurements are available from a standard suite of 16 stations along a 3000 m distance and five stations across an orthogonal 1000 m distance. At each station, small holes are drilled through the fast ice and the thickness measured using a metre tape with a lever arm that held the zero point against the bottom of the fast ice. Thickness is measured for solid ice and does not include underlying platelet ice or overlying snow. Therefore, our technique is comparable to that of Gough et al. (Reference Gough, Mahoney, Langhorne, Williams, Robinson and Haskell2012), but could result in a slight overestimate if the subice platelet layer is especially dense. However, eastern McMurdo Sound and the location of sea ice runway are not characterized by pervasive platelet ice (Langhorne et al. Reference Langhorne, Hughes, Gough, Smith, Williams, Robinson, Stevens, Rack, Price, Leonard, Mahoney, Haas and Haskell2015 and references therein). Fast ice temperature is measured at 15 cm depth beneath the ice surface. Note that the sea ice runway area is routinely cleared of excess snow, which may affect the fast ice thickness and temperature measurements, so these data are used only for comparisons between years at this site. Both fast ice thickness and temperature were used as proxies for ice strength (Timco & Weeks Reference Timco and Weeks2010). While it would be preferable to have profiles of ice temperatures throughout the depth of the fast ice, our data do not include profiles, and use of single point measurements to represent profiles has been supported in several studies (e.g. Thomas Reference Thomas2017 and references therein). Air temperature and snow thickness are additional factors that are important (Timco & Weeks Reference Timco and Weeks2010) but these were not measured.
Local wind velocity data were obtained from an Antarctic Meteorological Research Center (http://amrc.ssec.wisc.edu/) weather station at McMurdo Station which has been maintained since 1973. Data from full seasons are examined, but averages for statistical tests are limited to data encompassing late winter, spring and summer seasons from 27 August (1 week before the earliest date of initial fast ice retreat) to 23 March (the latest date of fast ice reaching minimum extent).
Statistical analyses
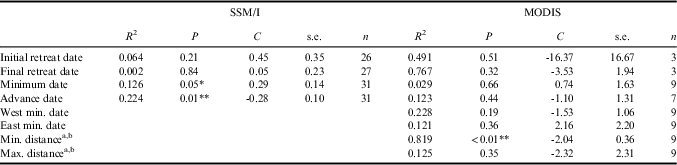
For simplicity, the inclusive term ‘fast/sea ice’ is used to refer to fast ice as determined by MODIS and sea ice as determined by SSM/I, although the two different satellite datasets are analysed separately. Fast/sea ice area is plotted over time and the following sequential pattern of fast/sea ice events is identified: i) initial fast/sea ice retreat from winter maximum, ii) final rapid fast/sea ice retreat to minimum extent, iii) fast/sea ice cover minimum in the entire McMurdo Sound, and iv) fast/sea ice advance. From the MODIS data, the following were additionally determined: v) fast ice cover minimum on the west side of the Sound and vi) fast ice cover minimum on the east side of the Sound. Dates of these events are determined by finding the local maxima or minima in the change in per cent difference in fast/sea ice area. The error in determining dates of fast/sea ice events is dependent on the gaps in the data. SSM/I imagery was obtained every other day from 26 October 1978 to 19 August 1997, and then daily, except for gap of 41 days from 3 December 1987 to 12 January 1988. MODIS imagery is weather dependent and more variable. Table I shows the number of clear sky days that visible MODIS data are available each year.
Table I MODIS observations during the period 2002–14.
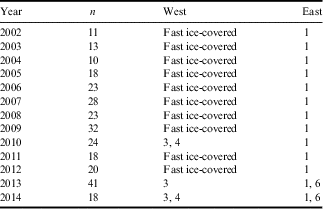
n=number of clear day observations from which the dates of changes in fast ice extent are determined.
More clear days may have occurred in each year, but images are not used in analyses if no change in fast ice from previous dates is apparent.
2002–05 mega-icebergs present.
West=fast ice-free zones on the west side of McMurdo Sound (zones 3 and 4).
East=fast ice-free zones on the east side of McMurdo Sound (zones 1 and 6).
For each satellite-based date, the statistical tests are based on the midpoint between the observation event (final fast/sea ice retreat, minimum, etc.) and the previous valid observation. Observations are weighted using the inverse of the time between the consecutive observations (error term = the true variance of the observation). Generally the longest gaps occur in spring when weather (cloud cover) is worst, prior to most fast/sea ice events (Fig. 3). Using the Statsmodels module in Python (v 0.8.0, based on R), regressions are performed using weighted least squares linear models when errors are variable (i.e. for dates of fast/sea ice events) and ordinary least squares linear regressions when errors are constant (i.e. for wind, fast ice and distance parameters). Assumptions are checked by examining plots of residuals vs predicted values and residuals vs independent variables. To determine whether data are normally distributed the Kolmogorov–Smirnov test is used; only the fast ice thickness data require a reciprocal transformation to meet the normality assumption. Significance is assessed at α=0.05. Trends over years are evaluated in fast/sea ice dates (initial retreat, final retreat, minima, advance), wind parameters (speed, direction, U and V) and fast ice parameters (thickness and temperature). Regressions are calculated between factors (icebreaker date, wind parameters, fast ice parameters), and MODIS- and SSM/I-derived fast/sea ice dates.
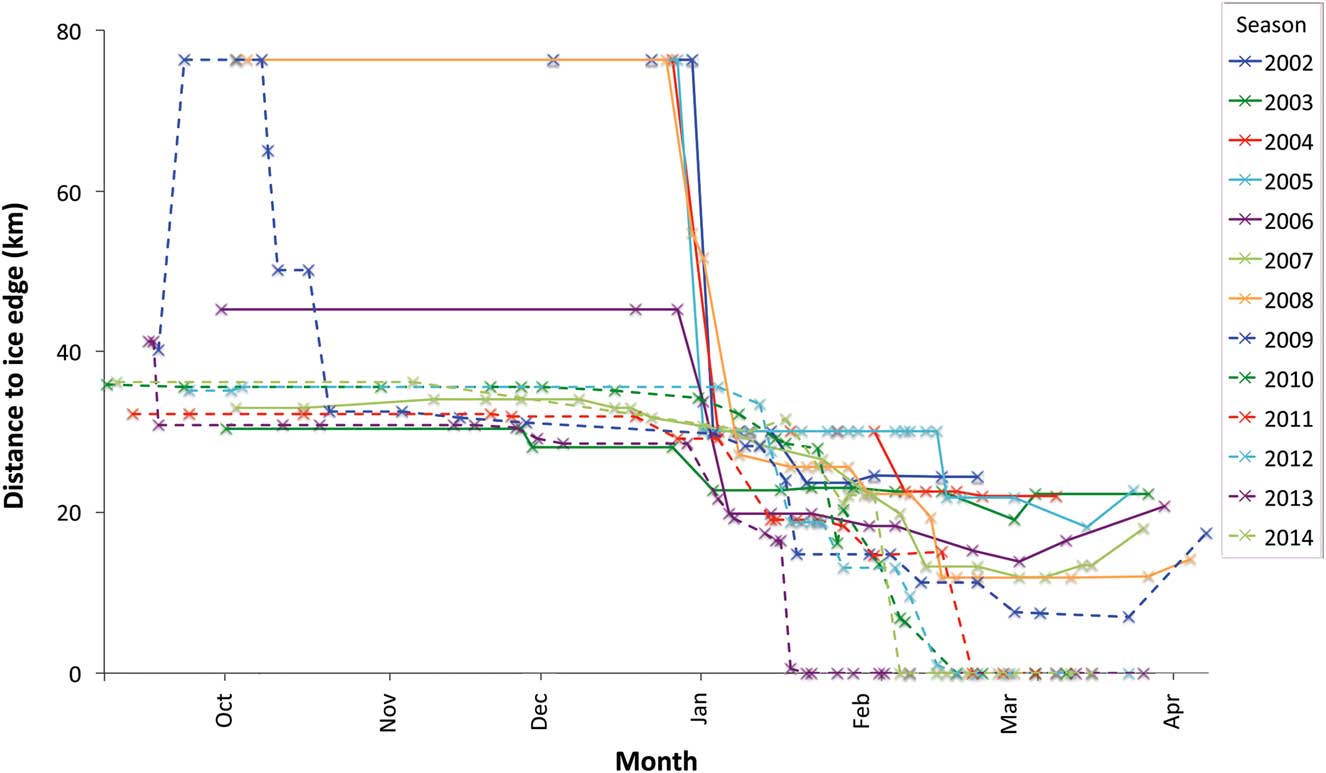
Fig. 3 The distance from the fast ice-edge to McMurdo Station from 2002–14, obtained from MODIS satellite imagery. X indicates dates when imagery was clear and measurements were made and lines are extrapolations between datapoints. Measurement error of 1 km (not shown) is from the 0.25 km resolution of MODIS images plus GIS processing inaccuracy.
In 2000–05, mega-icebergs obstructed the mouth of McMurdo Sound and influenced the movement of fast and sea ice (Brunt et al. Reference Brunt, Sergienko and MacAyeal2006). This unusual, multi-year iceberg event allowed formation of multi-year sea ice, which has different physical properties than first year sea ice (Timco & Weeks Reference Timco and Weeks2010); therefore, 2000 through 2005 are not included in trend analyses.
Results
Spatial patterns
Sea ice is present in some amount in McMurdo Sound year-round, owing to the severe climate at 79°S latitude, proximity to the McMurdo Ice Shelf, and trapping features such as the Drygalski Ice Tongue; however, overall sea ice cover follows a seasonal pattern. Extensive fast/sea ice typically is present in the winter and early spring. MODIS imagery and scientific operations since 1957 confirm that the majority of the sea ice occurs as fast ice, spanning the entire Sound. A band of pack ice offshore of the fast ice is often present during spring and, depending on the strength and duration of winds and currents from the north, can accumulate in a strip up to a few kilometres wide of compacted floes. The much stronger wind episodes that occur from the south usually blow the pack ice north, 10 km or more away from the fast ice-edge (see Fig. 1). In late spring the weakening fast ice begins to break up into floes. Depending on wind, these floes may depart quickly, within hours to days, or remain in the Sound for up to several weeks. Ultimately, much of the pack ice is transported northwards during the frequent bouts of strong southerly winds; it is unknown what fraction melts within the Sound.
The MODIS imagery was of sufficient resolution that the location of the east–west section of the fast ice-edge (Fig. 1) could be distinguished throughout the spring/summer/autumn seasons. Two different ‘modes’ are observed in the seasonal fast ice-edge location and timing of retreat (Fig. 3). In 2002, 2004, 2005, 2008 and 2009 the fast ice-edge was generally 76 km from McMurdo Station in the beginning of spring (October). In the remaining years, during early spring the fast ice-edge was c. 34 km away from the station, except for 2006 when the distance to the fast ice-edge was 45 km. In 2003, 2009, 2011 and 2013 the fast ice began an initial retreat in mid-September to late November (Fig. 4a); the limited number of years when initial retreat was observed may have been due to the lack of useable images from early spring in several years (Fig. 3). The fast ice-edge began a sharp final retreat between early January and mid-February, followed by a gradual retreat of the ice-edge from c. 27 km from McMurdo Station to the minimum distance from McMurdo Station observed for the season. The date the fast ice reached the minimum extent for the year varied from late January to early March (Fig. 4b). Even when the fast ice was at the minimum for the year, some fast ice typically remained in the south and west Sound, although it can occur anywhere. From 2002 through 2006, the fast ice-edge did not retreat all the way to McMurdo Station, remaining 7–24 km away (Fig. 3); this included the years when the mega-icebergs blocked the entrance to McMurdo Sound and encouraged the formation of multi-year ice. The dates of the fast ice minima in the east and west sides of the Sound were more variable than the dates of the overall minimum. Although the sides of the Sound broke out before the middle more often than not, this was not a consistent pattern.
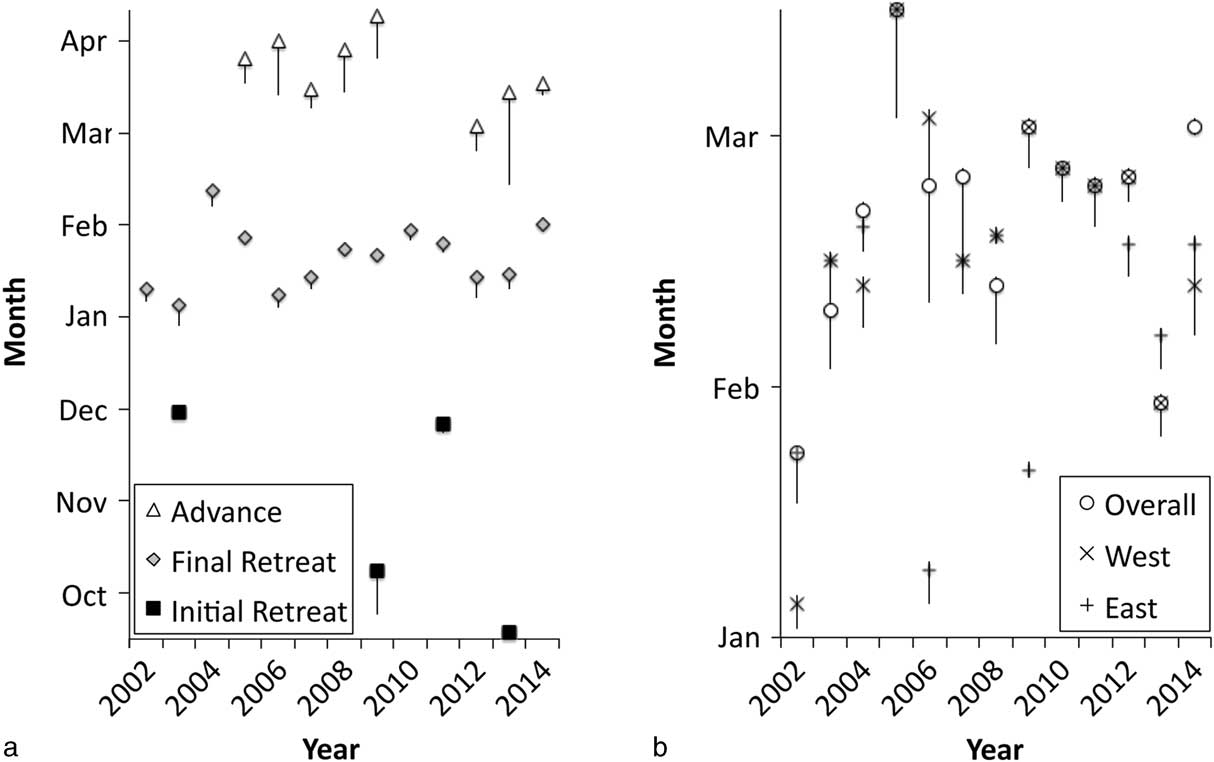
Fig. 4 Fast ice event dates in McMurdo Sound as observed in MODIS satellite imagery between 2002–14. Blanks indicate years when events were not observed, e.g. initial retreat and advance were not observed in all years. Vertical lines indicate errors (number of days to preceding observation). a. Initial fast ice retreat, final fast ice retreat and fast ice advance dates. b. Overall, west side and east side fast ice minimum dates.
Ice advance, or persistent increase in fast ice area in the autumn, was only observed during seven years (2005–09, 2012–14), occurring between early March and mid-April (Fig. 4a). Several bouts of freezing and clearing may happen before consistent fast ice cover is established. Anecdotes and operational experience (Jeff Scanniello) over winter indicate that sea ice in the winter months is dynamic and may break out, advance and remain partially mobile until late winter. Thus, the limited seasonal timeframe of MODIS visible data might result in a too-early estimation of advance date.
From the spatially coarser SSM/I data, a similar but longer term record of total sea ice (i.e. fast and pack ice) events was extracted and qualitative comparisons were made with the MODIS fast ice data. The SSM/I data show that the initial sea ice retreat occurred between mid-September and late November (Fig. 5), with one value in late December; this was similar to what was observed in the MODIS visible imagery. However, MODIS data often did not include the winter maximum fast ice extent, so initial fast/sea ice retreat was observed in just three of nine seasons, vs 26 of 31 with SSM/I. The SSM/I data show that the final retreat to minimum sea ice extent was in mid-January to early February (one date in early January, Fig. 5), starting later and ending earlier than for fast ice observed in the MODIS images. The SSM/I final retreat dates were probably influenced by the departure or melting of pack ice that was excluded from the MODIS analysis. The SSM/I dataset shows that the sea ice reached minimum extent between mid-January and late February (Fig. 5). The SSM/I sea ice minimum dates also started earlier and ended earlier than the MODIS minimum dates, and this may be partially due to the 15% ice concentration lower cut-off applied to the SSM/I data. The SSM/I data indicate that sea ice advance usually began between mid-February and mid-March (Fig. 5), earlier than in the sparse MODIS data.
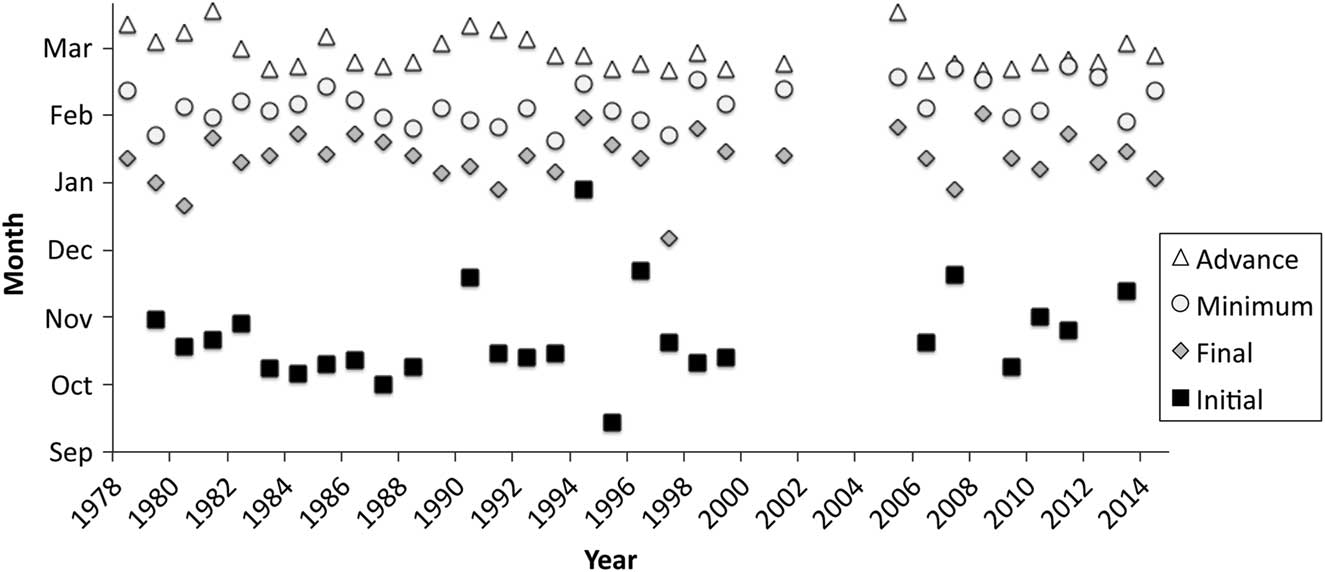
Fig. 5 Event dates observed in SSM/I satellite imagery between 1978–2014 for initial sea ice retreat, final sea ice retreat, sea ice minimum and sea ice advance. Blanks indicate years when events did not occur, e.g. sea ice remained in McMurdo Sound in 2002–04. Errors (not shown) were one day in 1978–96 (SSM/I images collected every other day) and zero days in 1997–2014 (SSM/I images collected every day).
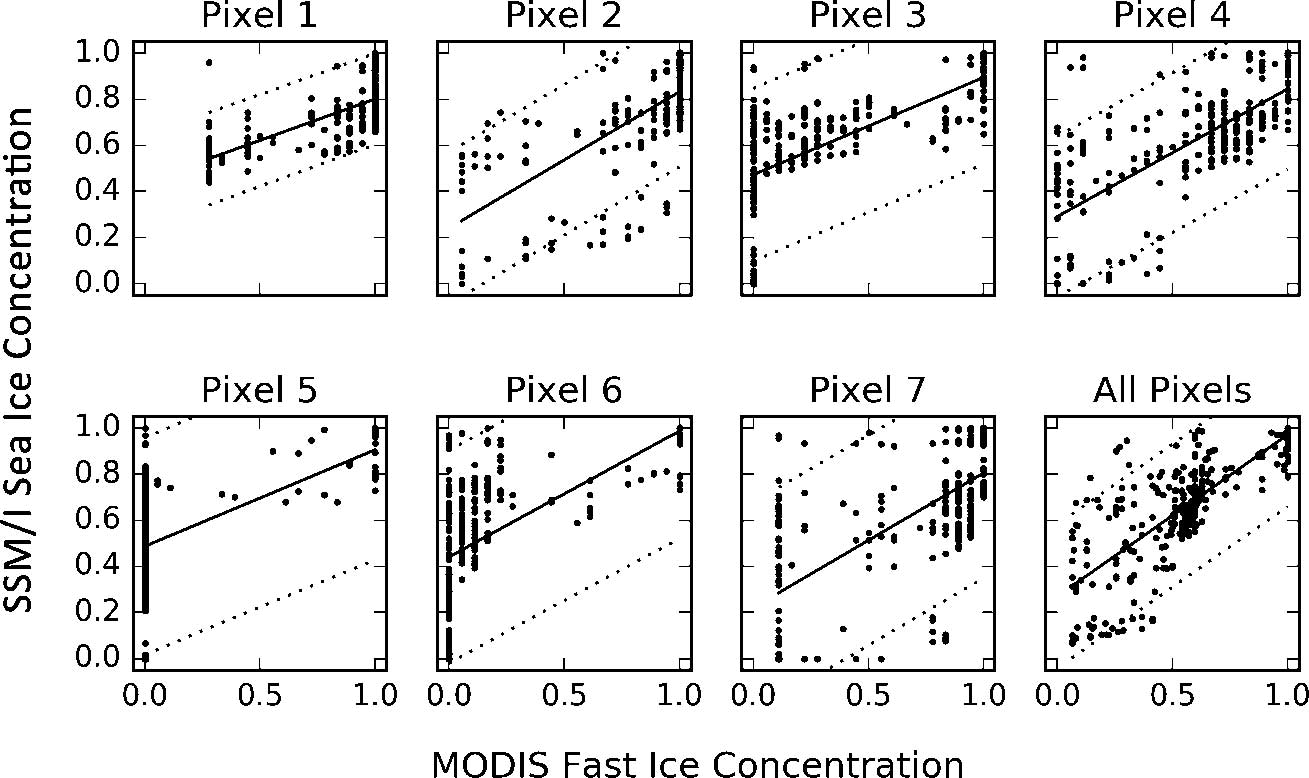
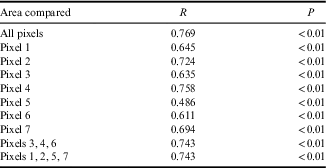
The broad similarities in dates of fast/sea ice events extracted from the SSM/I sea ice concentration and MODIS fast ice cover data encouraged us to test for a significant correlation between them using Pearson correlations despite the differences in image resolution and type. To directly compare the MODIS and SSM/I data, the SSM/I pixel mask was overlaid on the fast ice polygons generated from processed MODIS imagery and the per cent cover (= concentration) of fast ice in each ‘pixel’ in each MODIS image was manually classified, so that the areal coverage is exactly the same. The MODIS fast ice and SSM/I sea ice concentrations are significantly linearly correlated in each of the seven pixels and overall (Table II), although in some pixels (e.g. 5) the correlation has low predictive value. There are no major differences observed in correlations between pixels that had some land/ice shelf contamination (1, 2, 5, 7) and those that did not, indicating that the contamination does not preclude using SSM/I sea ice concentrations to discern changes in fast ice in the area covered by those pixels. Visually there is substantial scatter in plots comparing SSM/I to MODIS (Fig. 6), some of which may be attributed to poor microwave satellite sea ice algorithm performance during summer, when snow melt can cause large changes in emissivity in the microwave bands. Linear intercepts indicate that SSM/I sea ice concentration is most frequently higher than MODIS fast ice concentration, which is expected given that both fast and pack ice were included in the SSM/I values. Based on the overall confidence boundaries of the correlations, large changes in sea ice concentrations determined from SSM/I are deemed to be an acceptable proxy for fractionally large changes in fast ice cover extracted from MODIS data in McMurdo Sound, and justifies analyses over the full timespan available from the SSM/I sensor to look for trends in the timing of McMurdo Sound fast ice seasonal events. Note that correlations are not used to predict fast ice cover. Instead, large changes in the SSM/I sea ice concentration are interpreted to be indicative of fast ice break-up (and formation). The longer SSM/I time series contributes to the usefulness of our analysis; however, to allow conservative interpretation separate analyses were maintained for MODIS and SSM/I data.

Fig. 6 Comparison of SSM/I sea ice and MODIS fast ice concentrations in McMurdo Sound for each of the seven SSM/I pixels and all of the pixels summed together. Dotted lines indicate the correlation 95% confidence bounds.
Table II Correlations between SSM/I sea ice and MODIS fast ice concentrations. Pearson R values for individual SSM/I pixels, uncontaminated pixels (3, 4, 6), pixels contaminated by land or ice shelf (1, 2, 5, 7) and all pixels. For each comparison, n=279, the number of coincident SSM/I and MODIS observations.

Temporal patterns (trend analysis)
Some of the substantial variability in the fast ice data is from the obstruction of the mouth of McMurdo Sound by sea ice backed up behind the mega-icebergs that were present during 2000–05. Excluding these years, since 1978 there has been only one year, 1993, when SSM/I data indicate that McMurdo Sound remained almost completely covered by sea ice year-round. Thus, years of minimal fast/sea ice breakout are within normal variability.
The fast ice in McMurdo Sound only partially followed the Ross Sea region pack ice pattern of increasing extent and duration that has been observed in recent decades. The SSM/I data trend (1978–2014) indicates that the sea ice has been reaching a minimum later (0.29 days per year) and refreezing earlier (-0.28 days per year) in more recent years (Table III). MODIS data (2002–14) also indicate that the minimum distance to the fast ice-edge from McMurdo Station has been declining (-2.04 km yr-1) in more recent years (Table III). The fast ice retreated all the way to McMurdo Station in 2010–14. It is possible that during the first few years following the mega-iceberg era, remnant multi-year ice in the Sound prevented complete fast ice retreat, especially along the edges of the Sound (Table I). Overall, the data indicate that the fast/sea ice retreat dates in McMurdo Sound have not significantly changed over the last 37 years.
Table III Trends in dates of fast/sea ice events in McMurdo Sound over the study period, based on the MODIS and SSM/I datasets; mega-iceberg years (2000–05) are not included.
a Distances were from the fast ice-edge to McMurdo Station.
b Ordinary least squares regressions; all others are weighted least squares linear regressions.
C=regression coefficient, n=number of observations, R 2=coefficient of determination, s.e.=standard error.
*P≤0.05, **P≤0.01.
Icebreaker effect
Since 1956, an icebreaker has annually cut a channel through the fast ice in McMurdo Sound, from the fast ice-edge to McMurdo Station (Fig. 7). To determine whether the icebreaker channel destabilizes the fast ice in McMurdo Sound, the relationship between icebreaker arrival date and fast/sea ice breakout dates was investigated. The icebreaker arrival date at the fast ice-edge varied widely when the entire 58 year time series was considered (Fig. 8a). In early years, icebreaker arrival ranged from 28 October (1956) to 16 December (1957, 1958), before settling around early January in the 1970s and throughout the most recent decades. Sometimes ship arrival was after the fast ice had already begun to retreat, as in 2011 and 2012 when icebreaker arrival dates were the latest of the time series (Fig. 8a). For analysis, only those years when the icebreaker arrived before final fast/sea ice retreat began were considered. These were 22 of the 31 SSM/I years (excluded were 1979, 1980, 1991, 1997, 2007, 2010, 2011, 2012 and 2014) and seven of the nine MODIS years (excluding 2012 and 2013). Icebreaker arrival date is significantly correlated with sea ice minimum date in the SSM/I data (Table IV) with a regression coefficient of 0.47. On average, the overall sea ice minimum was reached 24 (±9) days after icebreaking began.
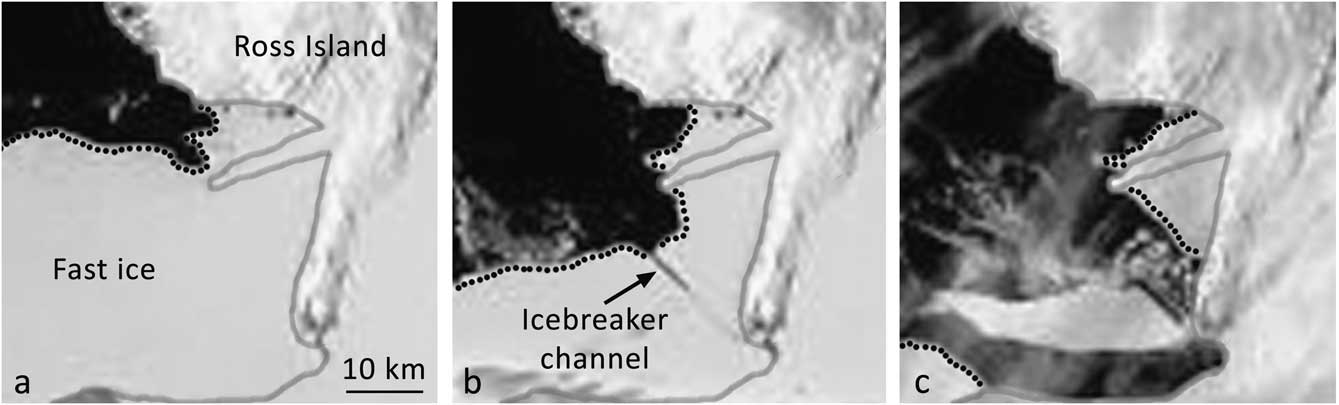
Fig. 7 Example MODIS satellite images showing the icebreaker channel in McMurdo Sound; the image centre is at 77.7341°S, 166.528°E. The grey line indicates land/glacier/ice shelf edges and the dotted lines indicate the fast ice-edge. a. Prior to icebreaker arrival, 17 January 2013. b. The icebreaker channel from the fast ice-edge to McMurdo Station, 8 February 2013. c. Large chunk of ice bordering the channel cut moving out of the Sound, 16 February 2013.
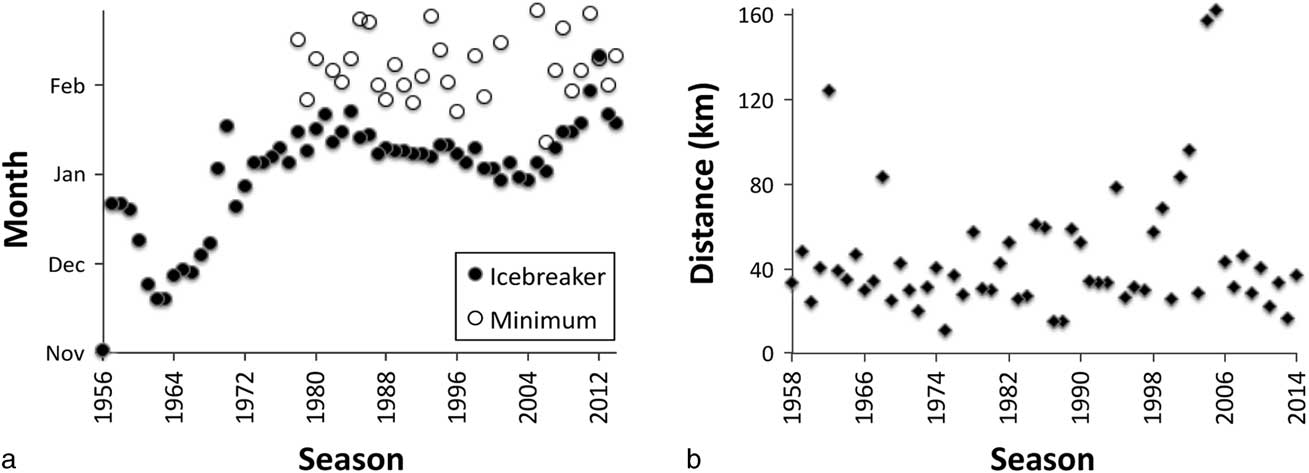
Fig. 8 Icebreaker information from 1956–2014. Note that icebreaker arrival was on a different date each year. a. Date that the icebreaker arrived at the fast ice-edge in McMurdo Sound between 1956–2014, and SSM/I ice minimum date between 1978–2014. b. Distance between the fast ice-edge and McMurdo Station as recorded by the icebreakers upon their arrival in McMurdo Sound, 1958–2014. Distance was not recorded in 1956 and 1957. Errors in distances measured by radar (not shown) are on the order of tens of metres, with precise values dependent on the radar make/model installed on the different icebreakers.
Table IV Regressions between icebreaker date and fast/sea ice dates in McMurdo Sound using weighted least squares linear models; mega-iceberg years (2000–05) are not included.
C=regression coefficient, n=number of observations, R 2=coefficient of determination, s.e.=standard error.
**P≤0.01.
Given that the icebreaker began to break into McMurdo Sound on different dates each year, especially in the 1950s and 1960s, the distance between the fast ice-edge and McMurdo Station recorded by the icebreaker is not directly comparable between years. Nevertheless, it confirms that the distance between McMurdo Station and the fast ice-edge was usually c. 35 km (Fig. 8b) and that this has not changed greatly in 56 years. The effect of the mega-icebergs is clearly seen in the larger distance to the fast ice-edge in 2001, 2002, 2004 and 2005; the other years when the distance was greater were years when the icebreaker arrived early in the season, 1962 (14 November) and 1968 (3 December). However, some years with similarly early icebreaker arrival dates do not have longer distances to the fast ice-edge.
Ice parameters
Fast ice thickness measured at the McMurdo Station sea ice runway tends to increase gradually from July to October and only very slightly thereafter (Fig. S1 found at http://dx.doi.org/10.1017/S0954102017000578). The median fast ice thickness is 235 cm. Within the range of years in which thickness was measured (beginning in 1986), certain years stand out as anomalies; the fast ice was unusually thin in 1993 (median 185 cm) even though McMurdo Sound remained almost completely sea ice-covered according to SSM/I sea ice concentrations. Thicker fast ice than usual occurred in 1995 and 2000–04 (median 276–518 cm), with fast ice thickness increasing annually in the latter group of years. Thicker fast ice in 2000–04 can be explained by the presence of the mega-icebergs that blocked the exit of sea ice from McMurdo Sound and protected the fast ice from wave action. In those years, the fast ice did not break out, becoming multi-year fast ice. Fast ice temperature, also measured since 1986 at the sea ice runway, showed the same general pattern in all years, dropping from July to reach a minimum in mid-September and then increasing through December (Fig. S2 found at http://dx.doi.org/10.1017/S0954102017000578).
Fast ice thickness and temperature data were collected primarily during spring (September to December), and median values are used for testing for regressions with dates. Fast ice thickness data are non-normally distributed (P≤0.01); therefore, a reciprocal transformation is applied. When examining relationships with year between 1986 and 2013 no trends were found in either fast ice thickness (R 2=0.015, P=0.60, regression coefficient <0.01, standard error < 0.01, n=21) or temperature (R 2=0.101, P=0.17, regression coefficient = -0.10, standard error = 0.07, n=20). In tests for regressions with dates of fast/sea ice retreat and fast/sea ice minima, there are no significant relationships between median fast ice thickness or temperature and any fast/sea ice dates (Table V).
Table V Regressions between springtime median fast ice parameters and fast/sea ice dates in McMurdo Sound; mega-iceberg years (2000–05) are not included.
a Ordinary least squares regressions; all others are weighted least squares linear regressions.
C=regression coefficient, n=number of observations, R 2=coefficient of determination, s.e.=standard error.
Wind parameters
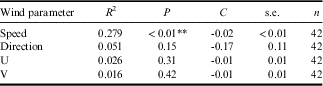
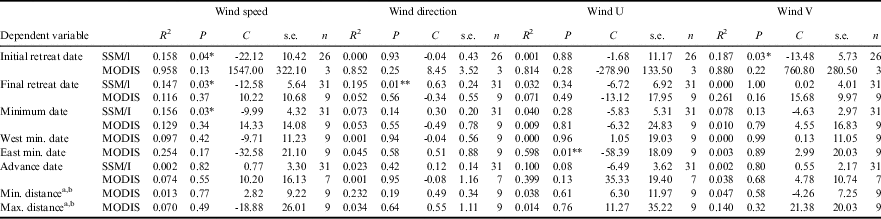
The wind parameters used for analyses include direction, speed, U-component (speed to the east) and V-component (speed to the north). Though winds are locally variable in McMurdo Sound, the meteorological observations from a consistent location at McMurdo Station provide a way to compare regional winds to fast/sea ice events over the full range of years. Wind parameters are averaged over the late winter/spring/summer seasons and examined for trends from 1973–2014 and for regressions with fast/sea ice dates between 1978–2014. Since 1973, seasonal average wind direction has not changed, but seasonal average wind speed shows a slight decrease (-0.02 m s-1 yr-1, Table VI). Note that fast/sea ice dates are only tested against interannual trends in wind intensity; responses of fast ice to short-term wind parameters are not modelled, although these are probably important. Though the results are not always consistent (e.g. a wind parameter might be related to a date in the SSM/I data but not in the MODIS data), some regressions are significant (Table VII). In the SSM/I data, initial retreat, final retreat and ice minimum dates are related to average wind speed (regression coefficients -22.12, -12.58 and -9.99 m s-1 day-1, respectively); in years with higher wind speeds, the sea ice retreated earlier but reached a minimum later. SSM/I final retreat and average wind direction are also related (although with a small regression coefficient of 0.63° per day). Wind direction was generally between east and ESE (80–120°), and the final retreat began later as wind direction shifted more toward ESE (regression coefficient -13.48° per day).
Table VI Trends of seasonally averaged wind parameters in McMurdo Sound, 1973–2015, using ordinary least squares linear regressions.

C=regression coefficient, n=number of observations, R 2=coefficient of determination, s.e.=standard error.
**P<0.01.
Table VII Regressions between average wind parameters and fast/sea ice dates in McMurdo Sound; mega-iceberg years (2000–05) are not included.

a Distances were from the fast ice-edge to McMurdo Station.
b Ordinary least squares regressions; all others are weighted least squares linear regressions.
C=regression coefficient, n=number of observations, R 2=coefficient of determination, s.e.=standard error.
*P≤0.05, **P≤0.01.
Factors influencing the fast ice minimum dates on the west and east coasts of McMurdo Sound are not necessarily the same (Table VII). In the MODIS data, the east side fast ice minimum is related to average U-direction wind speed (regression coefficient -58.39 m s-1 day-1), indicating that as wind speed to the east increased, the fast ice on the east side of the Sound reached a minimum earlier.
Discussion
Temporal trends
The local-scale analysis of SSM/I and MODIS satellite data demonstrates some trends in the McMurdo Sound fast ice seasonal climatology over the past several decades. The SSM/I trend results show that the sea ice reaches a minimum later and refreezes earlier, a pattern that agrees with larger scale studies that show a lengthening of the pack ice season and increase in pack ice extent in the Ross Sea region (Thomas Reference Thomas2017 and references therein). However, fast/sea ice retreat dates in McMurdo Sound have not changed over the 37 year study period (mega-iceberg years excluded), and this element of stability in the McMurdo Sound fast/sea ice record contrasts with the changing Ross Sea region pack ice record. McMurdo Sound fast ice also may be retreating closer to McMurdo Station, though remnant influences of the mega-icebergs that occluded the mouth of the Sound may affect this recent pattern. The current hypothesis explaining the increase in the Ross Sea regional pack ice includes wind- and temperature-driven processes, as well as other contributing factors (Thomas Reference Thomas2017 and references therein). Strong winds, accompanying the current positive state of the Southern Annular Mode (SAM), break up and advect forming sea ice away from the coast, while new ice continues to form in its place; this results in more pack ice distributed further from the continent. Our observations reveal that the regional-scale wind-driven mechanism does not necessarily alter fast ice extent substantially in McMurdo Sound. In fact, the average wind speed at McMurdo Station, near the head of the Sound, has decreased since 1973. However, the ultimate fate of the McMurdo Sound fast ice is to break up into pack ice and potentially be exported from McMurdo Sound; further seasonal evolution of exported sea ice may then follow the trend of the greater Ross Sea region.
Our results, and lack of change in fast ice trends observed in areas adjacent to ice shelves (Langhorne et al. Reference Langhorne, Hughes, Gough, Smith, Williams, Robinson, Stevens, Rack, Price, Leonard, Mahoney, Haas and Haskell2015), suggest that fast ice, at the small areal scale of McMurdo Sound, is decoupled from the climate drivers that influence pack ice on a larger scale. However, other local drivers, such as nearby ice shelves that produce plumes of super-cooled meltwater and promote the formation of platelet ice (Langhorne et al. Reference Langhorne, Hughes, Gough, Smith, Williams, Robinson, Stevens, Rack, Price, Leonard, Mahoney, Haas and Haskell2015 and references therein), may influence fast ice thickness and strength. The only time series of fast ice parameters that are available to us are fast ice thickness and temperature at the sea ice runway, a region that was consistently altered by snow removal and had minimal platelet ice. In this analysis, no trends in fast ice thickness are found over the years, consistent with the results of Langhorne et al. (Reference Langhorne, Hughes, Gough, Smith, Williams, Robinson, Stevens, Rack, Price, Leonard, Mahoney, Haas and Haskell2015) who compiled data from a variety of sources beginning in the early 1900s and suggested that there has been no change in ice shelf melting in McMurdo Sound during the past century. However, the west side of McMurdo Sound is more strongly influenced by ice shelf meltwater than the east side (Langhorne et al. Reference Langhorne, Hughes, Gough, Smith, Williams, Robinson, Stevens, Rack, Price, Leonard, Mahoney, Haas and Haskell2015 and references therein) and if more frequent west side breakout continues, as indicated by our recent observations (Table I), this might suggest that ice shelf melt production is also undergoing change.
In contrast to the consistent fast/sea ice retreat pattern in McMurdo Sound over the last 37 years, a local-scale study in the Davis region of East Antarctica between 1969 and 2003 recorded a delay in fast ice breakout date (Heil Reference Heil2006). A larger scale study around East Antarctica observed that although fast ice temporal shifts paralleled those of pack ice over nine years, the overall increase in fast ice extent was due to a significant increase in one sector, the Indian Ocean, while the western Pacific sector showed a non-significant decrease (Fraser et al. Reference Fraser, Massom, Michael, Galton-Fenzi and Lieser2012). McMurdo Sound is relatively sheltered and influenced by hundred-kilometre-scale ice features, such as mega-icebergs, ice shelves and ice tongues, that can substantially alter local fast ice (Langhorne et al. Reference Langhorne, Hughes, Gough, Smith, Williams, Robinson, Stevens, Rack, Price, Leonard, Mahoney, Haas and Haskell2015 and references therein). Thus, it must be recognized that fast ice may respond to changes in forcing in different regions in different ways, and that spatial scales and locations may influence results.
Spatial changes
Our local-scale spatial analysis allows us to consider fast ice dynamics along the sides of McMurdo Sound. Although there has been no significant change in the fast ice minimum dates on either side of the Sound over the years, closer examination of the zones in MODIS images that show the nearshore fast ice in detail indicates that during the last few years fast ice may be clearing more along the sides of the Sound (Table I). If a trend is underway, changes in fast ice patterns in west McMurdo Sound in particular could manifest in ecological shifts within both benthic and pelagic biotic systems. Historically the west side of the Sound has retained multi-year fast ice (Thrush et al. Reference Thrush, Dayton, Cattaneo-Vietti, Chiantore, Cummings, Andrew, Hawes, Kim, Kvitek and Schwarz2006), which has contributed to the low productivity that controls species composition and density in the benthic ecosystem (Dunbar et al. Reference Dunbar, Leventer and Stockton1989). The multi-year fast ice presence along the west side dates back 2000 years, prior to which Adélie penguin colonies existed along that coast in response to open water during late spring/summer (Emslie et al. Reference Emslie, Berkman, Ainley, Coats and Polito2003). If west side fast ice breakouts are now becoming more extensive this may alter the community structure to include species that are currently excluded by limitations in food or access to the open ocean. In addition, greater areal fast ice coverage on the west side of the Sound compared to the east side may have been acting as a refuge for pelagic micronekton (krill and fishes) that persist there when predation pressure increases late in the summer (unpublished data, see also Buckley Reference Buckley2013). Further, the high concentration of platelet ice under extensive west Sound fast ice cover (Langhorne et al. Reference Langhorne, Hughes, Gough, Smith, Williams, Robinson, Stevens, Rack, Price, Leonard, Mahoney, Haas and Haskell2015 and references therein) probably provides a major spawning area for Antarctic silverfish (Pleuragramma antarctica Boulenger), a key species in the food web (Eastman Reference Eastman1985). A change in annual fast ice patterns on the west side of McMurdo Sound would clearly alter the food web dynamics of this area. In contrast, any changes that have occurred on the east side of the Sound, where fast ice normally is more ephemeral, have been subtle enough that they have not affected the population of Weddell seals in Erebus Bay and points south, that species having an obligatory relationship to stable fast ice for several months of the year (Ainley et al. Reference Ainley, Larue, Stirling, Stammerjohn and Siniff2015). More extensive west side fast ice breakout could even have an impact on logistic support to McMurdo-based research activities if fuel deliveries via ship to Marble Point, which require a stable fast ice platform, are incorporated into the McMurdo Station support plan.
Factors affecting fast ice climatology
The potential effects of the annual icebreaker arriving in McMurdo Sound are evaluated based on the icebreaker channel adding a destabilizing factor and contributing to differences in fast/sea ice retreat dates. In the SSM/I data, which encompass more years than the MODIS data, icebreaker arrival date is significantly related to the sea ice minimum date. Since 2007 the icebreaker date has been scheduled to coincide with expected minimum fast ice extent (George Blaisdell, personal communication 2016), but despite this there are no significant regressions with icebreaker date in the shorter MODIS dataset. The longer SSM/I dataset extends to earlier decades when the icebreaker schedule was set by a variety of logistic concerns other than fast ice extent and, even with this wider range, icebreaker date explains sea ice minimum date only slightly better than wind speed. However, penguin and whale response to the arrival of the icebreaker in McMurdo Sound suggest that this anthropogenic disturbance has a direct effect on predator dynamics. Killer whales in particular are observed to follow the icebreaker through the newly opened channel, as it provides access to prey resources that were previously beyond the air-breathing limitations of the predators (Ainley et al. Reference Ainley, Lindke, Ballard, Lyver, Jennings, Toniolo, Pennycook, Massaro and Santora2017). Having been exposed to the regular appearance of the icebreaker for decades, it remains an open question whether learning may have altered the whales’ behaviour, i.e. whether they expect the icebreaker arrival. Elsewhere, killer whales have certainly learned that fishing vessels signal the onset of enhanced feeding opportunities (Roche et al. Reference Roche, Guinet, Gasco and Duhamel2007).
McMurdo Sound fast ice breakout appears to be influenced by both natural processes and anthropogenic activities. Although there is a significant regression between icebreaker arrival date and sea ice minimum date, there are only limited fast/sea ice breakout data from pre-icebreaker years, which would provide a control for more rigorous hypothesis testing. Some pre-icebreaker historical information can be gleaned from the Heroic Age of Antarctic exploration, 1897–1922 (Ferrar Reference Ferrar1905, Scott Reference Scott1905, Shackleton Reference Shackleton1909, Reference Shackleton1919). During the Discovery Expedition (Scott), there was open water to Winter Quarters Bay (WQB, adjacent to McMurdo Station) on 8 February 1902, the Sound remained fast ice-covered in 1903, and open water returned to WQB on 14 February 1904. The Nimrod Expedition (Shackleton) encountered open water to the barrier (the edge of the McMurdo/Ross Ice Shelf) at the end of February 1908 and to Cape Royds on 28 February 1909. The Terra Nova Expedition (Scott) found open water to Cape Evans on 4 January 1910, to Butter Point on 26 January 1911, and to Cape Evans on 18 February 1912 and 18 January 1913. These historical data provide a rough pre-icebreaker average fast ice minimum date of 7 February. From the existing satellite data an equivalent average fast/sea ice minimum date, since 1978, of 3 February can be estimated. This difference of four days is not significant using a Mann–Whitney test (U=144, P=0.49). Other potentially relevant differences between the Heroic Age and the satellite era are in the fast/sea ice retreat distance into the Sound and the consistent annual presence of an icebreaker channel. The mean minimum distance from the fast ice-edge to the future location of McMurdo Station was 17 km during the Heroic Age, and in the satellite era since 1978 the mean distance was only 7 km. The 10 km difference is also not significant (Mann–Whitney U=66, P=0.31). The Heroic Age numbers are necessarily imprecise and other environmental factors may also differ between the early and late 1900s. However, the icebreaker channel and subsequent fast/sea ice retreat may override the natural variability of the system, which included rare years when the fast ice would remain fixed across all of McMurdo Sound. Although critically necessary to the operation of McMurdo Station, the icebreaker channel is also a direct anthropogenic effect that may alter the McMurdo Sound system and its (un)predictability, with a possible cascade of ecological consequences.
Overall, our regression analyses indicate that wind velocity, especially speed, influenced fast/sea ice retreat. Higher annual average wind speeds led to earlier initial and final sea ice retreat dates and later sea ice minimum dates. Final retreat was also later when wind direction was more southerly and east side fast ice retreated earlier when wind to the east was stronger. This suggests that winds not only influence the quick movement of fast/sea ice away from the land and ice shelves but also continue to erode the fast/sea ice later in the season, leading to later fast/sea ice minima. Previous researchers have suggested that a combination of heavy swell originating from storms in the open Ross Sea (swells from the north hitting against the fast ice-edge) and strong winds from the south are necessary to break up and clear the McMurdo Sound fast ice (Thomas Reference Thomas2017 and references therein). The average wind speeds and directions for the season were examined without consideration of any lag terms, and correlations with swell events or daily wind parameters were not examined, but this is a provocative avenue for further work. Winds in McMurdo Sound are complex, in part due to the surrounding mountainous topography. The complexity of interactive events was highlighted by Brunt et al. (Reference Brunt, Sergienko and MacAyeal2006), who showed that wind events were ameliorated by the presence of mega-icebergs in this region during 2001–05.
Our trend analysis shows a slight decrease in seasonal average wind speed in McMurdo Sound since 1973, although the correlation was low (R 2=0.279, Table VI) and data were from only one location. In contrast, regional wind speeds in the Ross Sea area have increased in recent decades (Thomas Reference Thomas2017 and references therein), in response to the SAM remaining in a positive state since the mid-1970s. Positive SAM and higher wind speeds result in more sea ice in the Ross Sea region, as noted above, as well as more reliable generation and larger size of coastal polynyas (persistent areas of open water; Thomas Reference Thomas2017 and references therein). The change in wind speed over the last four decades may have altered the opening or persistence of the McMurdo Sound polynya. Polynya generation has important ramifications to coastal processes including primary productivity and prevalence of higher trophic level predators, influencing the ecology of the southern Ross Sea region (Arrigo et al. Reference Arrigo, van Dijken and Strong2015). The contrast between regional increases and local decreases in wind speed highlights the potential differences that considerations of scale introduce.
Changes in fast ice parameters
Fast ice thickness and fast ice temperature are not significantly related to fast/sea ice retreat dates in McMurdo Sound. However, ice thickness and temperature both contribute to ice strength, although other ice qualities (e.g. salinity, porosity) are more direct predictors of ice strength (Timco & Weeks Reference Timco and Weeks2010). For ice thickness and temperature values approximating those observed in this study, greater ice thickness has the most impact on increasing both flexural and tensile strength in first-year ice (Thomas Reference Thomas2017 and references therein). The ice strength equations are only applicable to first-year ice, and fast ice on the sides of McMurdo Sound, especially the west side, is generally multi-year (Table I). To our knowledge, there are no appropriate equations developed for multi-year ice strength (Timco & Weeks Reference Timco and Weeks2010 table 1). In addition, fast ice thickness and temperature measurements were taken from one location on the east side of the Sound, and may not be appropriate for the west side or other locations where the conditions may differ. These factors may contribute to the lack of significant regressions in our study. Murphy et al. (Reference Murphy, Clarke, Symon and Priddle1995) found a strong correlation between ice thickness and seasonal duration of the fast ice near Signy Island off the northern tip of the Antarctic Peninsula and suggested that offshore winds and air temperatures were controlling factors. Air temperature was not tracked in our study, although LaRue et al. (Reference LaRue, Ainley, Swanson, Dugger, Lyver, Barton and Ballard2013) report that the summer average near McMurdo Station has increased in recent years by 0.5 °C per decade beginning in the mid-1980s. Note, however, that temperatures in the southern Ross Sea are far colder than those of Signy Island, a region of even greater air temperature increase (e.g. Turner et al. Reference Turner, Overland and Walsh2007).
Fast ice thickness is difficult to measure over large areas (Langhorne et al. Reference Langhorne, Hughes, Gough, Smith, Williams, Robinson, Stevens, Rack, Price, Leonard, Mahoney, Haas and Haskell2015 and references therein), but efforts have been made to validate remote ice thickness measurements (Thomas Reference Thomas2017 and references therein) and will perhaps simplify data collection. Ainley et al. (Reference Ainley, Larue, Stirling, Stammerjohn and Siniff2015) inferred decreasing McMurdo Sound fast ice thickness between 1980 and 2007 from the shorter time that icebreakers required to make their first pass from the fast ice-edge to McMurdo Station. However, in our spatially limited dataset, there was no change in fast ice thickness between 1986 and 2013. On the regional-scale, in areas that were already ice-covered, an unchanged fast ice thickness might indicate that there are no direct impacts via changed light levels on in situ production of ice algae or phytoplankton. However, fast ice physical and biological dynamics are heavily modulated by snow cover as a result of its insulating properties and its heavy attenuation and reflection of the solar irradiance required by primary producers (Arrigo et al. Reference Arrigo, van Dijken and Strong2015). Although precipitation is expected to increase in the Southern Ocean as a result of climate change (IPCC 2014), the local effects of climate shifts in the McMurdo region are largely unknown. Ainley et al. (Reference Ainley, Russell, Jenouvrier, Woehler, Lyver, Fraser and Kooyman2010) predict more snow and a continuation of the increasing extent and persistence of regional sea ice at least for the near term. The accumulation of snow cover on McMurdo Sound fast ice may be governed more by winds, including katabatic wind events, than by overall precipitation. More careful monitoring of snow cover, temperature and other factors controlling ice algae will be required to understand how changes in McMurdo Sound fast ice may impact the marine ecosystem.
In McMurdo Sound, relatively high concentrations of sea ice-associated algae and advected phytoplankton blooms from the open Ross Sea contribute to the overall production available to both pelagic and benthic ecosystems (Barry & Dayton Reference Barry and Dayton1988). Though advected bloom productivity greatly predominates on the eastern side (Barry & Dayton Reference Barry and Dayton1988), potential changes in quantity or quality of ice algae and phytoplankton may have far-reaching effects (Barry & Dayton Reference Barry and Dayton1988). As increasing winds expand the size, rate of annual growth and persistence of the Ross Sea polynya, and melting ice shelves impart more iron, phytoplankton production has increased in the Ross Sea (Arrigo et al. Reference Arrigo, van Dijken and Strong2015). The increased production in the nearby polynya may have noteworthy consequences for the food-poor benthos far south and west in McMurdo Sound (Barry & Dayton Reference Barry and Dayton1988) that depend on advected productivity. Cascades through the food web would be expected to occur but require a long-term research programme to elucidate (e.g. Conlan et al. Reference Conlan, Kim, Thurber and Hendrycks2010). The serendipitous ‘natural experiment’ brought about by the mega-iceberg event, 2000–05, showed that understanding how fast ice and pack ice play their roles in the Sound requires not just long-term but multidisciplinary research, with much still to be learned despite the large amount of research on sea ice and its associated biota already accomplished (Thomas Reference Thomas2017 and references therein).
Conclusions
In summary, between 1978 and 2014 the fast/sea ice in McMurdo Sound has been retreating further, reaching a minimum later and refreezing earlier, although the dates of retreat have not changed. Our analysis shows a significant relationship between SSM/I-derived sea ice concentration and MODIS-derived fast ice extent in the Sound, indicating that a portion of this change in sea ice seasonality may be ascribed to changes in fast ice seasonality. Although icebreaker activity has an effect on minimum fast ice date, wind velocity, especially speed, influences the timing of summertime fast ice retreat in McMurdo Sound. While we cannot eliminate the influence of recent scheduling of the icebreaker when fast ice extent is minimal, the indication that icebreaker timing plays a role in fast ice dynamics in McMurdo Sound should encourage consideration of broader ramifications of anthropogenic activities in this ecosystem that has few other direct human impacts.
Acknowledgements
This material is based upon work supported by the National Science Foundation (NSF) under grant numbers ANT-0944747 to Kim, ANT-9044511 to Daly and ANT-0944694 to Ainley. Any opinions, findings and conclusions or recommendations expressed in this material are those of the authors and do not necessarily reflect the views of the NSF. The authors appreciate the support of the University of Wisconsin-Madison Automatic Weather Station Program for the dataset, data display and information, NSF grant number ANT-1245663. We acknowledge the use of data products and imagery from the Land, Atmosphere Near real-time Capability for EOS (LANCE) system operated by the NASA/GSFC/ESDIS with funding provided by NASA/HQ. We are grateful to George Blaisdell for contributing important icebreaker information. We also greatly appreciate support in all forms provided by Martin Hynes, Laughlin Barker, Rob Robbins and Steven Rupp. Many others contributed to data collection and analysis including Kamille Hammerstrom, Clint Collins, Bob Pitman, John Durban, Peggy Malloy, Eric Stackpole, Heather Broadbent, Dan Mahon, Dorota Szuta, Philip Chung and Andrea Sartorius. Inspirational thanks are always due to Paul Dayton and John Oliver. We are very grateful to several anonymous reviewers for helpful comments.
Author contributions
SK, DA, KD and BS developed the concepts and approach. SK and BS performed data extraction and analysis. All co-authors participated in data collection, and writing and editing the manuscript.
Details of data deposit
Except where otherwise noted in the text, all data for this paper are hosted at BCO-DMO, in project ‘Food web dynamics in an intact ecosystem: the role of top predators in McMurdo Sound’ (http://www.bco-dmo.org/project/665131).
Supplemental material
Two supplemental figures will be found at http://dx.doi.org/10.1017/S0954102017000578.