Milk is an emulsion or colloid of fat globules within a water-based fluid that contains dissolved carbohydrates and protein aggregates with minerals. There are two major categories of milk protein that are broadly defined by their chemical composition and physical properties. The casein family proteins contain phosphorus and coagulate or precipitate at pH 4.6, whilst the serum (whey) proteins do not contain phosphorus, and remain in solution in milk at pH 4.6. Several minor proteins with unique properties mostly on providing immune-protective, growth and antimicrobial factors to the new-born, are found in the serum fraction of mammalian milks (Indyk and Filonzi, Reference Indyk and Filonzi2005).
Lactoferrin (LF) is an iron-binding glycoprotein of the transferrin family with a high molecular weight (80 kDa). It is present in many biological fluids and is widely distributed in colostrum and milk (Tsakali et al., Reference Tsakali, Petrotos, Chatzilazarou, Stamatopoulos, D'Alessandro, Goulas, Massouras and Van Impe2014). Several studies have demonstrated the potential antiviral, antifungal, and antiparasitic activity of LF toward a broad spectrum of species (Wakabayashi and Takase, Reference Wakabayashi and Takase2006), deriving mostly from its ability to bind iron (Jenssen, and Hancock, Reference Jenssen and Hancock2009). In addition, it interacts with molecular and cellular components of both hosts and pathogens (García-Montoya et a l., Reference García-Montoya, Cendón, Arévalo-Gallegos and Rascón-Cruz2012). Lactoferrin is also considered to be an important host defence molecule during infant development (Jenssen, and Hancock, Reference Jenssen and Hancock2009). The lactoferrin content in milk varies between different mammalian species and, within a given species, between lactation periods (Levay and Viljoen, Reference Levay and Viljoen1995).
Such biological significance allowed LF to be the focus of many research studies in the last two decades. The increasing commercial interest in exploiting the therapeutic value of lactoferrin has stimulated the need for reliable concentration assays for its determination at endogenous levels in milk and colostrum (Indyk and Filonzi, Reference Indyk and Filonzi2005). Several analytical and biological tools have been employed to quantify LF in its various natural sources. A number of chromatographic techniques for the quantitation of lactoferrin in milk and whey have been reported (Indyk and Filonzi, Reference Indyk and Filonzi2005). Ultra-high-performance liquid chromatography (UPLC) and triple-quadrupole tandem mass spectrometry under the multiple reaction monitoring (MRM) modes have also been used to quantify LF. Other suggested methods include immunochemical techniques, enzyme-linked immunosorbent assays (ELISA), gel electrophoresis (GE) and capillary electrophoresis (CE) (Indyk and Filonzi, Reference Indyk and Filonzi2005). However, the chromatographic methods are still the most attractive for the determination of proteins in milk and dairy products, such as the determination of para-κ-casein (Alexandraki and Moatsou, Reference Alexandraki and Moatsou2018). Currently there is no reference method for quantifying lactoferrin in dairy products. The most common difficulties result from its low concentration compared to other proteins and fats, the complexity of the milk matrix in which it is embedded and the absence of a common certified standard and/or reference material (Pocheta et al., Reference Pocheta, Arnoulda, Debournouxb, Flamentb, Rolet-Répécauda and Beuviera2018). Moreover, most of the reported methods are complicated and time consuming. In the case of most of the HPLC methods, an extensive preparation step of the samples is included to separate LF. The extraction of high-value dairy proteins normally requires extensive pre-treatments of milk to remove fat and caseins by centrifugation, precipitation, Ca2+ chelation, or filtration. Such pre-treatments can result in significant loss of protein yield or activity (Palmano and Elgar, Reference Palmano and Elgar2002).
The objective of the current paper was to test and adjust a reversed-phase (RP) HPLC method previously validated for detection and quantification of LF in whey (Tsakali et al., Reference Tsakali, Petrotos, Chatzilazarou, Stamatopoulos, D'Alessandro, Goulas, Massouras and Van Impe2014), for novel application in mature milk of various species. This would allow the quantification of LF directly in milk with limited pre-treatment of the samples and without the use of an extensive separation technique.
Materials and methods
Samples
Mature milk samples (i.e. taken at least two weeks post-partum) of different species (10 samples of each species), namely, bovine, ovine, caprine, donkey milk were collected from local producers while human milk was offered by volunteers. All milk samples were pasteurized at 72 °C for 15 s apart from human milk. Fat was removed from milk by centrifugation at 3000 g for 15 min while separation of serum was performed via precipitation using HCl 1 M to pH 4.6 and centrifugation at 3000 g for further 15 min and filtration with 25-mm filters and 0.45-μm Cellulose Acetate Blue Luer Lock filters (Restek, Bellefonte, PA). Lactoferrin from bovine serum (90% purity; Sigma- Aldrich, Milwaukee, WI) standards were used. All samples were tested three times and each time in triplicate.
RP-HPLC analysis
The RP-HPLC method tested was applied exactly as described by Tsakali et al. (Reference Tsakali, Petrotos, Chatzilazarou, Stamatopoulos, D'Alessandro, Goulas, Massouras and Van Impe2014) on a VWR Hitachi module with a diode-array detector L-2455 Elite La Chrom (VWR International, Radnor, PA).
The concentration of LF was calculated by the method of standard curves. Different concentrations of commercial bovine LF (Sigma-Aldrich) were used, corrected by the given purity. All standards were examined twice, on different days and in duplicates each time.
Results and discussion
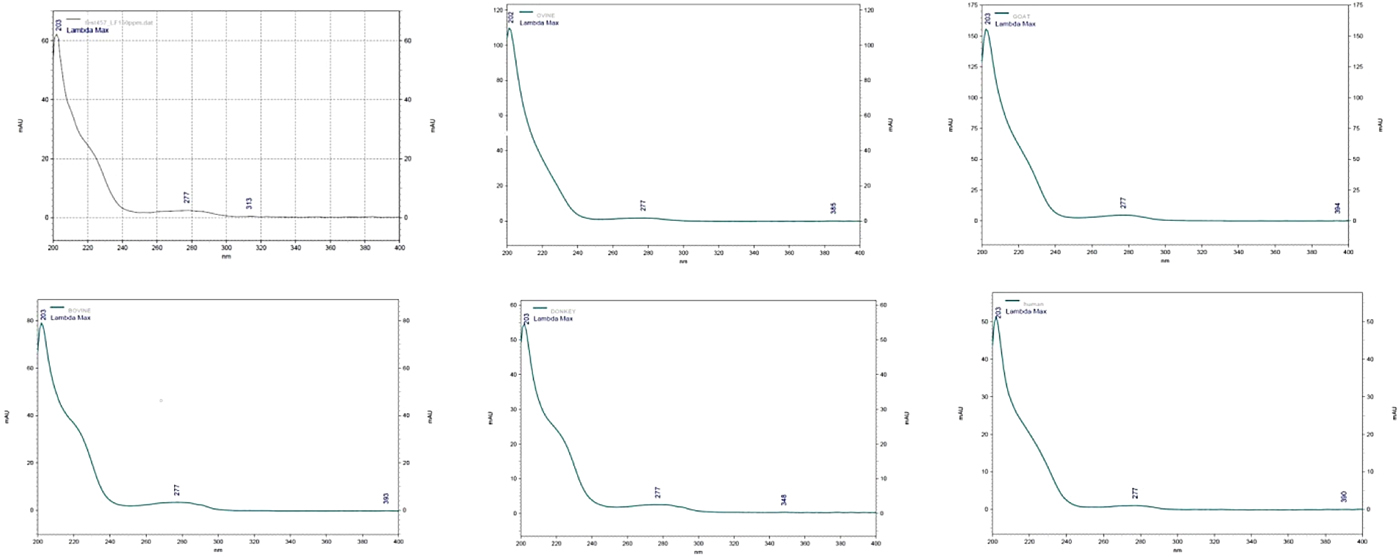
Elution was monitored at the range of 200 to 400 nm and detection of LF was achieved at both 203 and 277 nm. At 205 nm, the detection of LF has the advantage that it improves the sensitivity of response, as the LF peak (of the used standard) had better baseline resolution. The peak of LF in each milk sample was confirmed by comparing UV spectrum obtained with the UV spectrum of the LF standard (Fig. 1). In addition, each milk sample was re-tested with the addition of LF standard (100 µg/ml). In this case, an increase of the obtained peak was observed in the chromatographs while no alterations were observed in the spectrums. When only LF standards were tested, the elution time of LF was 10.2 min and its peak had a distinctive shape exactly as described by Tsakali et al. (Reference Tsakali, Petrotos, Chatzilazarou, Stamatopoulos, D'Alessandro, Goulas, Massouras and Van Impe2014) (λ max = 203 nm). When the milk samples were tested under the same conditions the elution time of LF was altered to 8.8 min for ovine milk, 11.4 min for caprine milk and at 12.1 min for ovine, donkey and human milk samples (Fig. 2). As can be seen in the presented chromatographs the LF peak resolution is different for the tested milk samples and LF interferes with other peaks in the cases of caprine and human milk, those with the highest reported serum protein concentrations. Native lactoferrin has a high isoelectric point (pI > 8), which makes it largely positively charged over a wide range of acidic and neutral pH such that it can interact with anionic molecular and cellular components (Pocheta et al., Reference Pocheta, Arnoulda, Debournouxb, Flamentb, Rolet-Répécauda and Beuviera2018). Being positively charged, lactoferrin tends to form complexes through non-covalent bonds with other negatively charged milk proteins such as soluble β-lactoglobulin, bovine serum albumin (BSA) and immunoglobulin (Lampreave et al., Reference Lampreave, Pineiro, Brock, Castillo, Sanchez and Calvo1990), soluble β-casein, and also with milk fat globule membrane lipopolysaccharides (Fong et al., Reference Fong, Norris and MacGibbon2007). Tsakali et al. (Reference Tsakali, Petrotos, Chatzilazarou, Stamatopoulos, D'Alessandro, Goulas, Massouras and Van Impe2014) had taken into consideration that BSA could have a retention time equal to that of bovine LF and similar to that of bovine α-lactalbumin in the cases of whey originating from ovine-caprine milk. For this reason and in order to be sure that there is no overlapping BSA peak, a pool sample of each species was re-tested with addition of LF standard in different concentrations (25, 50, 100 and 200 µg/ml). The ratio of the LF concentration in the milk sample to the LF concentration of each spiked sample was graphically represented against the ratio of the signal of the sample to the signal of each of the spiked sample. The trend line of each chart was linear with correlation coefficient (R 2) of at least 0.99 for bovine, ovine and donkey milk and 0.98 for caprine and human milk. The ratio comparison showed that the LF peak increased linearly with increasing LF concentration, which is a strong indication that no other peak was included.

Fig. 1. Spectrum of lactoferrin at 205 nm and of ovine, caprine, bovine, donkey and human milk samples
Fig. 2. Chromatographs of ovine and caprine milk (lactoferrin peak elution time at 8.8 min and 11.4 min respectively) and chromatographs of bovine, donkey and human milk (lactoferrin peak elution time at 12.1 min)
The results of the quantification of LF in the tested samples (Table 1) were within the literature values in the cases of bovine, donkey and human milk. In the cases of ovine and caprine milk the results were much higher than the reference values but since re-testing with addition of LF standard in different concentrations gave a linear increase of LF, the difference appears to relate genuinely to the milk composition. Discrepancy between determined values and literature has been reported for other milk components, such as free fatty acids, and in other species, such as human milk (Santillo et al., Reference Santillo, Figliola, Ciliberti, Caroprese, Marino and Albenzio2018). There are several factors that are known to influence the concentration of milk constituents in predictable ways (Cheng et al., Reference Cheng, Wang, Bu, Liu, Zhang, Wei, Zhou and Wang2008). These include lactation stage, breastfeeding routine, parity, age, and other maternal characteristics such as regional differences and, in some cases, season of the year and maternal diet (Welty et al., Reference Welty, Smith and Schanbacher1976; Cheng et al., Reference Cheng, Wang, Bu, Liu, Zhang, Wei, Zhou and Wang2008). Lactoferrin was shown to be significantly associated with the stage of lactation (r = 0.557) and daily milk production (r = −0.472) (Cheng et al., Reference Cheng, Wang, Bu, Liu, Zhang, Wei, Zhou and Wang2008). Its concentration increased many times (even up to 100 mg/ml) during mammary gland involution (Welty et al., Reference Welty, Smith and Schanbacher1976). Tsakali et al. (Reference Tsakali, Petrotos, Chatzilazarou, Stamatopoulos, D'Alessandro, Goulas, Massouras and Van Impe2014) reported that the average amount of LF in Feta cheese whey was 272 ± 24 µg/ml since the main materials for Feta cheese is ovine and caprine milk (70 : 30), this is a strong indication of increased LF content in the milk of these species.
Table 1. Mean values of LF concentrations as detected in milk samples of different species and reference values

a Polidori and Vincenzetti (Reference Polidori, Vincenzetti and Hurley2012).
b Gubid et al. (Reference Gubid, Milovanovid, Iličid, Tomid, Torbica, Šarid and Ilid2015).
c Queiroz et. al. (Reference Queiroz, Assis and R Júnior Had2013).
In conclusion, a single step RP-HPLC method originally developed for the determination of LF in whey was tested for its application in milk samples of various species. The results in terms of resolution were satisfactory within the limitation mentioned above for caprine and human milk and quantification of LF was possible, although further tests should be done for the estimation of its accuracy in each species. This is a rapid method that could be used as a qualitative screening for presence or absence of LF.