


I. INTRODUCTION
In an industrial electrowinning tank-house used for the solvent extraction of copper (Cu), lead (Pb)-based alloy anodes are placed in a bath of concentrated sulphuric acid in an alternating sequence with stainless steel cathodes (Schlesinger et al., Reference Schlesinger, King, Sole and Davenport2011). Under galvanostatic (constant current) conditions, the Cu dissolved in the acid electrolyte is plated on to the cathode while O2 is evolved at the anode, because of the significant anodic polarisation on the anode being in the oxygen evolution regime (i.e. >1 VNHE). To harvest a sheet of Cu takes about 7 days, but the Pb-based anodes are expected to have an average lifetime of about 5 years (Camurri et al., Reference Camurri, López, Pagliero and Vergara2001). The lifetime of the Pb-based anode is strongly influenced by the behaviour of the passivating layer that forms on its surface, which evolves from PbSO4 to PbO2 depending on the pH of the electrolyte and the potential applied to the anode.
Given rising energy costs worldwide and concerns about greenhouse gas emissions, there exists a need to design anodes that can help to reduce the amount of energy consumed during solvent extraction processes, including electrowinning. Any given tank-house can contain thousands of Pb-alloy anodes in acid baths, and therefore a small percentage reduction in energy consumption could translate to millions of dollars being saved annually, with significant emission reductions. In industrial electrowinning, a power interruption in the cell can occur for a number of reasons, leaving the Pb-based anodes exposed at their open-circuit potential (OCP) while immersed in the H2SO4 electrolyte, and allowing potentially unfavourable chemical reactions such as the transformation of PbO2 back to PbSO4 to occur. This scenario is comparable with the charge/discharge (ON–OFF) situation in a lead acid battery (Pavlov and Monahov, Reference Pavlov and Monahov1996). In electrowinning applications, a PbO2 surface layer is more desirable than PbSO4, as PbO2 is often present as a dense, compact and (electron) conductive film (Pavlov, Reference Pavlov2011), properties which are all critical to the efficiency of the Cu electrowinning process.
At present, the commonly used Pb-based anode in industry has a composition of Pb-0.08Ca-1.52Sn (wt%). In the present work, the effects of different alloying elements on the electrochemical performance of Pb-based anode alloys when exposed to alternating galvanostatic (GALV) and power interruption (open circuit) conditions are investigated. Each of the compositions investigated was selected based on preliminary testing on the basis that they exhibited an apparently superior performance relative to the industry standard alloy. This follows on from our recent in situ synchrotron X-ray diffraction (S-XRD) investigation of PbO2/PbSO4 surface layer evolution during electrochemical cycling of a pure Pb anode (Clancy et al., Reference Clancy, Styles, Bettles, Birbilis, Chen, Zhang, Gu, Kimpton and Webster2015), where it was shown for the first time that it is possible to characterise the PbO2/PbSO4 surface layer evolution, both in terms of the relative weight fractions of the crystalline phases and the layer thickness, in a sulphuric acid electrolyte and in real time. An in situ approach to surface layer characterisation is superior to an ex situ one since the anode remains in the cell with electrolyte flowing over the anode surface, and avoids artefacts introduced by the extraction of the sample from its operational conditions.
II. EXPERIMENTAL
A. Alloy compositions and preparation
Four Pb-based alloys were investigated in addition to 99.97% pure Pb and the industry standard alloy used in copper electrowinning (Pb–0.08Ca–1.52Sn); the custom Pb-binary alloys studied were Pb–0.73Mg, Pb–0.05Ag, Pb–0.07Rh, and Pb–1.4Zn. All alloy compositions are given in wt%. For the purpose of this investigation all alloys were studied in their as-cast form, including the industry standard Pb–Ca–Sn. The compositions selected were close to the maximum of solubility of each dopant in pure Pb (and hence the unique alloy loading in each case). The custom alloys were produced via the conventional crucible method. Finely chopped pieces of Pb and powdered alloying elements were heated in a quartz tube that was backfilled with argon (Ar) before sealing. The quartz tube was placed in a muffle furnace and held for extended periods at temperatures suitable for alloying of the respective elements. The alloy compositions were externally confirmed by ICP-AES (Spectrometer Services, Coburg, Australia). To enable the in situ S-XRD experimentation using a novel electrochemical flow cell [such a cell was previously described in Clancy et al. (Reference Clancy, Styles, Bettles, Birbilis, Chen, Zhang, Gu, Kimpton and Webster2015)] a section of each alloy was mounted in epoxy resin before the surfaces were ground to a 1200 grit finish using SiC paper.
B. In situ S-XRD
In situ S-XRD experiments were performed on the powder diffraction beamline at the Australian Synchrotron. Schematics of the flow cell and photographs of the experimental setup have been provided previously (Clancy et al., Reference Clancy, Styles, Bettles, Birbilis, Chen, Zhang, Gu, Kimpton and Webster2015). 1.6 M H2SO4 (sulphuric acid) solution was pumped over the alloy at 45 °C, and S-XRD data were collected throughout six galvanostatic – open circuit (GALV-OCP) electrochemical cycles, with individual data sets collected for 1 min using two detector positions, P1 and P2 (the detector contains 0.2° gaps every 5°2θ; data were collected in two detector positions 0.5° apart in order to cover the entire 2θ range). Asymmetric diffraction geometry with an incident beam-to-sample angle (defined hereafter as ω) of 8° was utilised for data collection, over the range 10° ≤ 2θ ≤ 90°. The vertical and horizontal slit widths were 0.2 and 5.0 mm, respectively. The X-ray wavelength was 0.9998 Å and was calibrated using LaB6 (NIST 660b line position standard) contained in a 0.3 mm diameter glass capillary.
For the purposes of visualisation of the formation and decomposition of phases as the electrochemical experiment progressed, individual P1 and P2 data sets were merged using CONVAS2 (Rowles, Reference Rowles2010) to remove the detector gaps. Merged data sets were stacked to produce a plot of accumulated data with elapsed time plotted vs. 2θ, viewed down the intensity axis. The merged data sets were also used for Rietveld refinement-based quantitative phase analysis (QPA) implemented in TOPAS (Bruker, 2014). A correction to account for sample displacement error in the asymmetric diffraction geometry was incorporated into the refinement model, as was an intensity correction to account for the asymmetric diffraction geometry and also the absorption of the diffracted X-rays in H2SO4. Details of the models have been provided previously (Clancy et al., Reference Clancy, Styles, Bettles, Birbilis, Chen, Zhang, Gu, Kimpton and Webster2015). Phase concentration values are relative crystalline wt% calculated via the Hill and Howard (Reference Hill and Howard1987) algorithm. The crystal structure information reported in Goodwin and Whetstone (Reference Goodwin and Whetstone1947), Straumanis (Reference Straumanis1949), Wyckoff (Reference Wyckoff1963) and D'Antonio and Santoro (Reference D'Antonio and Santoro1980) were used for Pb, β-PbO2, α-PbO2, and PbSO4, respectively. An anisotropic crystallite size broadening correction was implemented to account for the observed peak profiles for the β-PbO2 phase, to improve the quality of fit of the profile calculated using the conventional crystallite size (CS) and microstrain (MS) models. Details of the model, including equations, have been provided previously (Clancy et al., Reference Clancy, Styles, Bettles, Birbilis, Chen, Zhang, Gu, Kimpton and Webster2015), with Lorentzian CS and MS being refineable parameters in the Rietveld analysis.
For the purposes of calculation of the thickness (t) of the PbO2/PbSO4 surface layer as a function of time, the decay in intensity (I/I 0) of the (111) Pb reflection at 20.2°2θ was implemented in (Cullity, Reference Cullity1978).
 $$\displaystyle{I \over {I_0}} = e^{ - \mu t(1/\sin \omega + 1\!/\!\sin \beta )}$$
where μ is the X-ray linear absorption coefficient of the PbO2/PbSO4 surface layer, ω is 8° and β is the angle of the diffracted beam to the detector (i.e. β = 2θ – ω = 12.2° for the (111) Pb reflection). The relative concentrations of β-PbO2, α-PbO2, and PbSO4 returned from the QPA were used to calculate the value of μ at each data point. This approach assumes crystallographic density of the surface layers, and is treated as a semi-quantitative approach only without accurate knowledge of the actual surface layer density as a function of time.
C. Electrochemical conditions
The working electrode (Pb-based anode alloy) was exposed to a galvanostatic signal via a BioLogic® SP-150 potentiostat in conjunction with EC-Lab software. The potentiostat was connected to the cell via leads to the working electrode, the Ag/AgCl reference electrode and a Pt counter electrode. The applied current was equal to that used in industrial tank-houses, such that the current density was 300 A m−2 for each sample. After 40 min of applied galvanostatic current, the OCP was recorded for a 30 min period, during which no applied current was imposed to the system. This experiment was designed to examine the performance of the Pb-based anodes during a tank-house power failure or when the power is switched off. The galvanostatic segment, followed by the OCP segment, which made up one cycle, was repeated a further five times to record the evolution of the electrochemical performance of the Pb-based anode. It is important to note that the reference electrode used for the in situ flow cell study utilised an Ag/AgCl electrode, which has a potential difference of +0.199 V versus the standard hydrogen electrode.
III. RESULTS AND DISCUSSION
A. Electrochemical characteristics of Pb-alloys
The electrochemical potential versus time plots during the galvanostatic–OCP cycling for (a) Pb–Mg, (b) Pb–Ag, (c) Pb–Rh, (d) Pb–Zn, and (e) pure Pb alloys, are individually compared against the Pb–Ca–Sn alloy (Figure 1). There was a minor disturbance caused by a bubble in the cell for the Pb–Rh alloy. This is evidenced in Figure 1(c) by a spike in the measured potential in the first cycle, but was resolved once the bubble migrated away from the surface of the working electrode surface. During the OCP segments the PbO2 transforms to PbSO4 at a potential of ~1.25 VAg/AgCl. The rate at which each system undergoes the PbO2 to PbSO4 transformation, and to what extent over the 30 min period, varies significantly as can be seen in the results presented in Figure 4.

Figure 1. (Colour online) Potential versus time plots for the (a) Pb–0.73Mg, (b) Pb–0.05Ag, (c) Pb–0.07Rh, and (d) Pb–1.4Zn alloys (red traces), compared with the industry standard Pb-0.08Ca–1.52Sn alloy (black trace). For completeness the results reported by Clancy et al. (Reference Clancy, Styles, Bettles, Birbilis, Chen, Zhang, Gu, Kimpton and Webster2015) for the pure Pb anode are also shown in (e). The GALV and OCP segments of the first electrochemical cycle for the Pb–Mg/Pb–Ca–Sn alloys are labelled in (a).
The systems ranked in descending rate of transformation, were Pb–Ca–Sn, Pb, Pb–Zn, Pb–Mg, Pb–Ag, and Pb–Rh. In other words, the “best” performing alloy overall was considered to be the Pb–Rh alloy, with the Pb–Ag alloy only marginally behind in performance. Such an assessment is also based on the lower overpotential (~1.5 VAg/AgCl) achieved in response to the same galvanostatic polarisation conditions as the Pb–Ca–Sn, Pb–Mg, Pb–Zn, and pure Pb alloys (each measuring an overpotential of ~1.7 VAg/AgCl). This can have a significant (beneficial) effect in lowering the overall energy requirement of the cell, where the power requirement is i × V, where “i” is a constant fixed galvanostatic current, and “V” (in the context of power requirement) is the overpotential. Herein, the overpotential resulting from Rh and Ag additions is minimised, translating to a lower overall power requirement. Furthermore, the reduced change in the OCP across the six cycles compared with the other alloys is also unique to the Pb–Rh alloy. For example, the potential during the OCP segment of the first cycle for the Pb–Rh alloy reached a minimum value of 0.14 and 0.25 VAg/AgCl in the sixth cycle. In comparison, the potential during the OCP segment of the first cycle for the Pb–Ca–Sn alloy reached a minimum value of 0.21, and 0.98 VAg/AgCl in the sixth cycle. Based on these measures, the Pb–Mg, and Pb–Zn anodes also exhibit improved electrochemical performance from electrochemical testing, when compared with Pb–Ca–Sn. The stark differences induced by relatively low level alloying additions are indeed significant. It should be noted, however, that properties such as good mechanical strength and creep resistance, which are key factors in pure Pb being an unsuitable anode material for industrial use, must also be taken into account when considering an alloy to replace the industry standard. One feature of the Pb–Rh, and Pb–Ag alloys identified here, however, and which is a factor that would require longer term testing, is the minor increase in potential with each galvanostatic cycle, compared with the insignificant change in the potential galvanostatic region for the other alloys.
B. Surface evolution and phase analysis
Figure 2 reveals the plot of accumulated in situ S-XRD data for the Pb–Mg alloy. The first of the six galvanostatic and OCP segments is labelled. During the galvanostatic segments, the tetragonal β and orthorhombic α polymorphs of PbO2 both formed, while the orthorhombic form of PbSO4 formed during the OCP segments. Other than those from the substrate, no reflections from any other phases were observed during the experiment. α-PbO2 was observed together with the β phase during the galvanostatic segments of the experiments performed for the Pb–Ca–Sn, Pb–Ag, and Pb–Zn alloys; for pure Pb and the Pb–Rh alloy however, β-PbO2 was the only phase observed during the galvanostatic segments. A shift of the broad PbO2 reflections to lower 2θ during conversion of this phase to PbSO4 was observed, which is attributed to substitution of larger Pb2+ (ionic radius = 1.33 Å) (Shannon, Reference Shannon1976) cations for Pb4+ (0.915 Å) in the β-PbO2 structure during conversion to PbSO4, forming a non-stoichiometric phase (Butler and Copp, Reference Butler and Copp1956).

Figure 2. (Colour online) A plot of accumulated diffraction data collected for the Pb-0.73Mg alloy during electrochemical cycling, where GALV = galvanostatic and OCP = power interruption regimes. Some of the key Pb, β-PbO2, α-PbO2, and PbSO4 reflections are labelled. The features at ~18.7° and 19.2°2θ, which are present over the duration of the experiment are artefacts from the detector.
Another noteworthy feature of the in situ S-XRD data is that the β-PbO2 peaks for Pb–Rh, and Pb–Ag (seen specifically for Pb–Ag in Figure 3) are significantly sharper than those observed in the data for the other alloys investigated. This manifests in a higher value for the CS parameter in our anisotropic CS broadening model (Table I). Owing to the nature of the experimental setup and the assumptions in the modelling employed, these values are only an approximate measure of the CS. However, they can provide a qualitative insight into the microstructure of the β-PbO2 layer on the different alloys, namely the β-PbO2 crystallites appear larger on the Pb–Ag and Pb–Rh than on the other alloys. The CS value for the Pb–Ag alloy was higher than that for Pb–Rh, which may be the property giving rise to the greater upwards slope of the galvanostatic segment for this alloy, thought to be a potential indicator of a lack of long term stability in the oxide layer.

Figure 3. (Colour online) A plot of accumulated diffraction data collected for the Pb-0.05Ag alloy during electrochemical cycling. The β-PbO2 peaks are significantly narrower in these data, compared with the Pb–0.73Mg sample (Figure 2), indicating a larger average crystallite size.
Table I. Refined values of the Lorentzian crystallite size (CS, in nm) and micro-strain (MS) parameters for β-PbO2 in the dataset collected after 237 min i.e. during the fourth galvanostatic segment) for each alloy. The numbers in parentheses are Rietveld errors indicative of error in fit between the experimental and calculated profiles.

C. QPA and thickness evolution
The comprehensive results of Rietveld refinement-based QPA are presented in Figure 4, showing the evolution in relative concentration of the alloy substrate and the β-PbO2, α-PbO2, and PbSO4 surface layers as a function of time. It should be noted that the S-XRD data collection for the Pb–Zn alloy stopped after 248 min because of an unforeseen loss of the X-ray beam, whereas the electrochemistry was allowed to continue until after the sixth cycle was complete. Figure 4(b) shows the QPA results for the Pb–Mg alloy, and general trends observed across Figures 4(a)–4(e) are discussed in relation to these results. Both β- and α-PbO2 formed immediately on the substrate, and continued to grow during the galvanostatic segment of the first cycle, as indicated by the increase in crystalline phase concentration from 6 wt% (β-PbO2) and 2 wt% (α-PbO2) at t = 0 min, to 22 and 9 wt%, respectively at the end of the segment (t = 38 min). The concentration of β-PbO2 also increased as the number of cycles increased; β-PbO2 represented 45 wt% at the start of the galvanostatic segment of the second cycle (t = 74 min), compared with 22 wt% at the end of the galvanostatic segment of the first cycle, for example. In addition, whilst at each of the OCP to galvanostatic transitions the PbSO4 transforms completely, the dissolution of β- and α-PbO2 at the galvanostatic to OCP transitions is incomplete and the amount of residual PbO2 increases, reaching 25 wt% (for β-PbO2) in the final cycle. No α-PbO2 was detected on the Pb and Pb–Rh surfaces during cycling, whereas the Pb–Mg and Pb–Zn systems showed the most significant amounts which remained quite stable throughout electrochemical exposure. After the six galvanostatic cycles the Pb–Ca–Sn, Pb–Mg, Pb–Zn, and Pb alloys all had combined relative phase concentrations of β-PbO2 and PbSO4 that were significantly higher than those of the Pb–Ag and Pb–Rh alloys. Given that the detected Pb is from the underlying substrate, the alloys with these higher phase concentrations (of β-PbO2 and PbSO4) are likely to have thicker surface layers than Pb–Ag or Pb–Rh. It is suggested that Rh functions to lessen the rate of the PbO2 to PbSO4 transformation, resulting in a preference to retain a thinner, denser layer of β-PbO2 on the substrate surface.

Figure 4. (Colour online) Results of Rietveld refinement-based quantitative phase analysis, showing the evolution in relative concentration of the alloy substrate and the β-PbO2, α-PbO2, and PbSO4 surface layers during the electrochemical tests for (a) Pb–0.08Ca-1.52Sn, (b) Pb–0.73Mg, (c) Pb–0.05Ag, (d) Pb–0.07Rh, (e) Pb–1.4Zn, and (f) pure Pb [reported by Clancy et al. (Reference Clancy, Styles, Bettles, Birbilis, Chen, Zhang, Gu, Kimpton and Webster2015)]. In (e), at 248 min there was a loss of beam and so X-ray data were not collected beyond this point. The electrochemical cycling, however, was allowed to continue [Figure 1(d)].
The evolution of the thickness of the PbO2/PbSO4 surface layers formed on each alloy, calculated from the diffraction data using Eq. (1), is presented in Figure 5. The calculated surface layer thickness was greatest for the pure Pb anode. However, from electrochemical testing it was not the anode with the greatest surface layer thickness that had the poorest electrochemical performance, rather the Pb–Ca–Sn alloy (Figure 1). As such, the surface layer thickness appears not the prime factor in dictating anode performance, where a more detailed interpretation based on the results of the QPA reveals that poor electrochemical performance of the Pb–Ca–Sn alloy was governed chiefly by two factors. The first is that the relative amount of β-PbO2 did not overtake that of PbSO4 until the fifth cycle – this occurred earlier for each of the other alloys (during the second cycle for Pb–Ag, Pb–Rh and Pb, during the third cycle for the Pb–Mg and Pb–Zn). As such the difference between the maximum β-PbO2 and PbSO4 concentrations during the sixth cycle is only 6 wt% for the Pb–Ca–Sn alloy. In contrast, the difference values for the Pb–Mg, Pb–Ag, Pb–Rh, and pure Pb anodes were 16, 14, 12, and 15 wt%, respectively. Secondly, the amount of retained β-PbO2 during the OCP segments is lower for the Pb–Ca–Sn alloy than for the other anodes; 12 wt% during the sixth cycle, compared with 25, 20, 18, and 17 wt% for Pb–Mg, Pb–Ag, Pb–Rh, and pure Pb, respectively. It is, however, not completely clear at present if the stability of an anode alloy can be decided based on the dissolution of PbO2 and subsequent formation of PbSO4. Other very important variables that can and will affect mass transport across the anodic layer that has formed are the associated porosity, conductivity, and texture limitations. Such factors require dedicated studies, however, the time-resolved measurements of relative phase fractions and surface layer thicknesses presented in this study provide significant new insights.
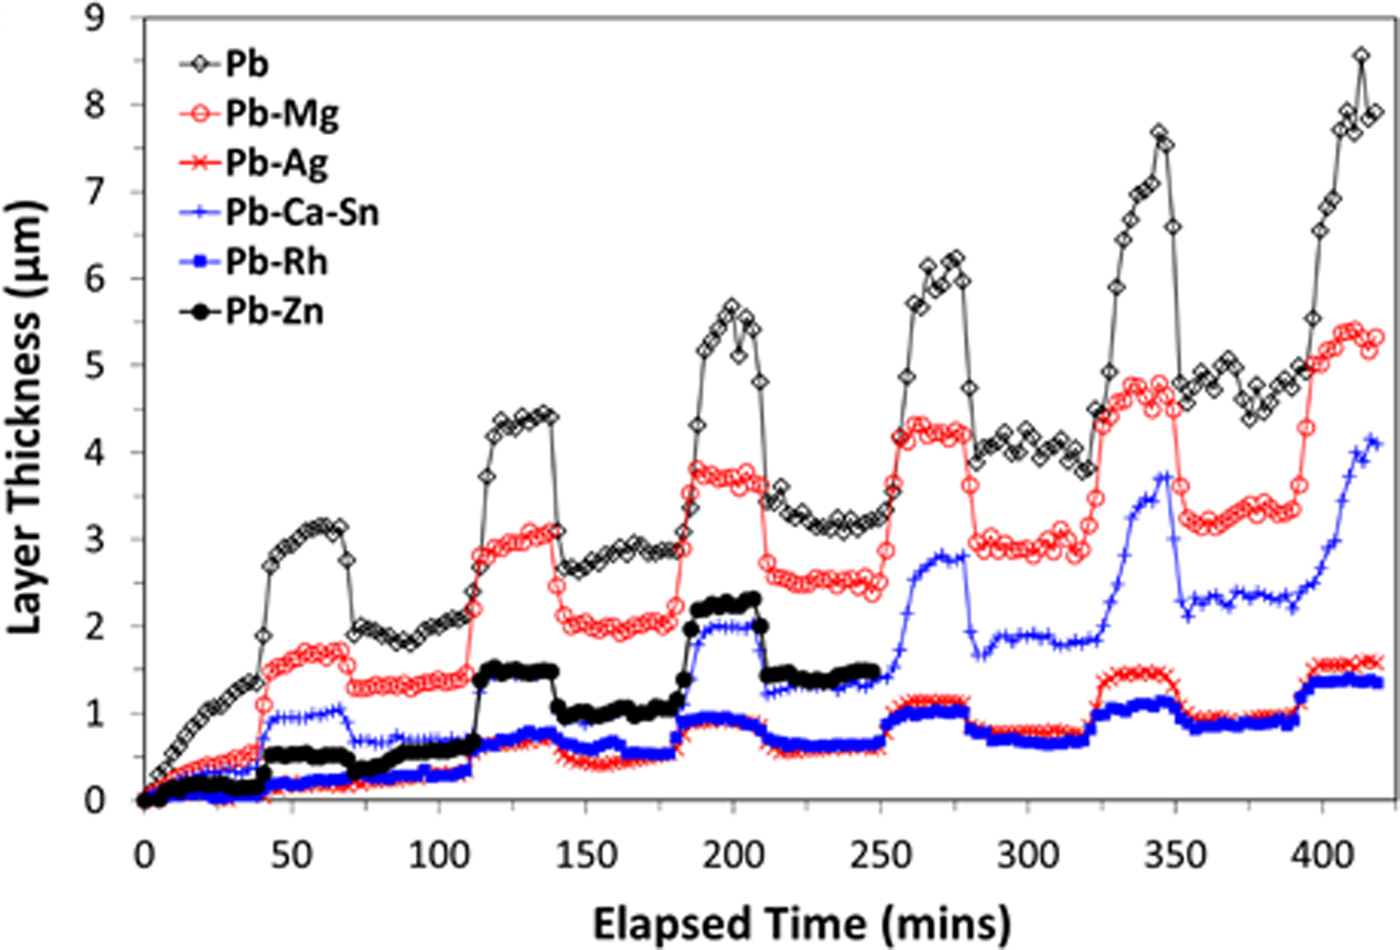
Figure 5. (Colour online) Calculated surface layer thickness as a function of time for each alloy.
Further evidence of the layer thickness not being the sole determining factor in electrochemical behaviour is the comparison between the thickness curves for Pb–Mg and Pb–Zn in Figure 5, which are significantly different. Again, the key factor in determining electrochemical performance appears to be the similar proportions of the PbO2 and PbSO4 phases as cycling progressed [Figures 4(b) and 4(e)]. It is also noted that the model used to calculate the layer thickness [Eq. (1)] assumes that the density of the passivation layer is consistent across all of the samples. Variations in the density of this layer from sample to sample could affect the interpretation of the electrochemical performance. Further work is required to investigate the role of porosity within the passivation layers of these alloys. Based on the available data there is not considered to be sufficient evidence to determine whether or not the formation of α-PbO2 is detrimental to the performance of an alloy material. Formation of the α-PbO2 phase may be promoted by the presence of dopants with a tendency to form divalent cations, since the Pb–Mg and Pb–Zn alloys resulted in the formation of up to 11 wt% of this phase, with 5 wt% being the next highest amount observed (for the industry standard alloy which happens to contain Ca). Consequently, the influence of so-called “reactive elements” uniquely is also an area worthy of further pursuit.
IV. CONCLUSION
The effect of different alloying elements, Mg, Ag, Rh, and Zn, on the electrochemical performance of Pb-based anode alloys when exposed to alternating galvanostatic (operational) and open circuit (power interruption conditions) was assessed via in situ electrochemical S-XRD measurements. There was good correlation between the results, regarding the performance of the studied alloys, when assessed by both electrochemical and crystallographic methods. From an electrochemical perspective, Rh-additions produced an alloy with the most favourable electrochemical properties, although additions of Ag, Mg, and Zn also produced alloys with superior electrochemical performance compared with the industry standard Pb–Ca–Sn alloy. Such alloys were down selected from a large number of alloys screened in preliminary work. The S-XRD measurements showed that a prevalence of PbSO4 relative to PbO2 was a detrimental factor with respect to electrochemical performance, in agreement with previous work in the field (Pavlov, Reference Pavlov2011). The utility of such alloying in the industrial setting is however, beyond the scope of the present study, as factors such as cost and mechanical properties would need to be considered. Nevertheless, this present work is an important starting point for understanding the Pb-alloy surface film and the relationship between its composition and the attainment of desirable electrochemical performance. The present work also has relevance to electrowinning beyond that of Cu production, such as for the electrowinning of Zn, or in the context of lead-acid batteries. The level of research on Rh in particular is scarce (whereas Ag has been noted to offer energy savings in the solvent extraction industry), and considering the beneficial effects seen herein, alloying with Rh warrants further research from a metallurgical perspective and to elucidate the influence of Rh on the portfolio of Pb properties.
ACKNOWLEDGEMENTS
This research was undertaken on the powder diffraction beamline at the Australian Synchrotron, Victoria, Australia, under beamtime award AS141/M7391. The authors also acknowledge use of facilities within the Monash Centre for Electron Microscopy and financial support provided by the Australian Research Council's Centres of Excellence funding scheme (CoE for Design in Light Metals) and the ARC Linkage Project Scheme. Thanks also to Nick Hardcastle of Consolidated Alloys for contributing materials to this project. The authors wish to thank Miao Chen (CSIRO Minerals Resources) for assistance with the electrochemical flow cell, Mark Gibson and Ian Madsen (CSIRO Manufacturing and Mineral Resources, respectively) for helpful discussions and Jean-Pierre Veder and Mikko Vepsalainen (CSIRO Minerals Resources) for their assistance with the reference electrode preparation.


