


Introduction
The acceleration of charged particles in laser-plasma interactions was demonstrated more than 20 years ago, by Coulomb-exploding small molecular clusters (Ditmire et al., Reference Ditmire, Gumbrell, Smith, Mountford and Hutchinson1996, Reference Ditmire, Zweiback, Yanovsky, Cowan, Hays and Wharton1999) resulting in a spatial more or less isotropic acceleration of ions. When in the early 2000s, first experiments revealed the capability of ion acceleration from solid targets (Clark et al., Reference Clark, Krushelnick, Zepf, Beg, Tatarakis, Machacek, Santala, Watts, Norreys and Dangor2000; Snavely et al., Reference Snavely, Key, Hatchett, Cowan, Roth, Phillips, Stoyer, Henry, Sangster, Singh, Wilks, MacKinnon, Offenberger, Pennington, Yasuike, Langdon, Lasinski, Johnson, Perry and Campbell2000), the effect of target-normal-sheath acceleration (TNSA) (Wilks et al., Reference Wilks, Langdon, Cowan, Roth, Singh, Hatchett, Key, Pennington, MacKinnon and Snavely2001; Mora, Reference Mora2003) gained a high interest and moved the scope of research onto studying a wide range of parameter dependence, for example, pulse duration, target thickness, or laser-energy dependence. More recently, other acceleration mechanisms, like radiation-pressure acceleration (RPA; Henig et al., Reference Henig, Steinke, Schnurer, Sokollik, Horlein, Kiefer, Jung, Schreiber, Hegelich, Yan, Meyer-ter-Vehn, Tajima, Nickles, Sandner and Habs2009; Yan et al., Reference Yan, Lin, Sheng, Guo, Liu, Lu, Fang and Chen2009; Aurand et al., Reference Aurand, Kuschel, Jaeckel, Roedel, Zhao, Herzer, Paz, Bierbach, Polz, Elkin, Paulus, Karmakar, Gibbon, Kuehl and Kaluza2013) or break-out-afterburner (BOA; Yin et al., Reference Yin, Albright, Hegelich and Fernandez2006) were intensively studied. All those effects use solid targets which come with certain drawbacks, like the need of target replacement after every shot and, in most cases, a high debris and shrapnel production, damaging optics and degrading the laser beam quality over time.
In a recent experiment, we demonstrated the stable multi-Hertz acceleration (Aurand et al., Reference Aurand, Grieser, Toncian, Aktan, Cerchez, Lessmann, Prasad, Khoukaz and Willi2019) of protons from tens of nanometer large cryogenic hydrogen clusters (Grieser et al., Reference Grieser, Aurand, Aktan, Bonaventura, Buescher, Cerchez, Engin, Leßmann, Mannweiler, Prasad, Willi and Khoukaz2019), an alternative target, overcoming some of the aforementioned problems. In this Coulomb-explosion driven scheme, proton energies in the range of hundreds of keV were obtained in a spatially isotropic distribution around the interaction point. The low particle energy compared to experiments, for example, using foil targets is a result of the cluster size and can be overcome by larger clusters, generated for example with different cluster source setting. Developing a new cluster source, the cluster size was increased to the 10 s on micrometer range, with the drawback of a very low interaction probability with these large clusters (Aurand et al., Reference Aurand, Schwind, Toncian, Aktan, Cerchez, Lessmann, Mannweiler, Prasad, Khoukaz and Willi2020). Another disadvantage of experiments using the cryogenic equipment comes with restrictions on the accessibility of the interaction chamber due to warm-up and cool-down times, which are typically in the order of several hours. A different approach to generate mass-limited targets is the use of liquids which can be either dispersed as a spray (Ramakrishna et al., Reference Ramakrishna, Murakami, Borghesi, Ehrentraut, Nickles, Schnuerer, Steinke, Psikal, Tikhonchuk and Ter-Avetisyan2010; Prasad et al., Reference Prasad, Borghesi, Abicht, Nickles, Stiel, Schnurer and Ter-Avetisyan2012) generating nanometer-size particles or as a continuous train of droplets (Schnuerer et al., Reference Schnuerer, Ter-Avetisyan, Busch, Risse, Kalachnikov, Sandner and Nickles2005; Sokollik et al., Reference Sokollik, Schnurer, Steinke, Nickles, Sandner, Amin, Toncian, Willi and Andreev2009). While in the previous experiments rather small droplets in the range of 16-μm diameter were used to investigated the plasma and electric field formation (Sokollik et al., Reference Sokollik, Schnurer, Steinke, Nickles, Sandner, Amin, Toncian, Willi and Andreev2009), we were particular interested in larger droplets in the order of 50 μm diameter to study, if a further increase in droplet target size results on an increase in particle energy. To our knowledge a similar target size was used in before by Burza et al. (Reference Burza, Gonoskov, Genoud, Persson, Svensson, Quinn, McKenna, Marklund and Wahlstrom2011), but the targets in this study were hollow shells, and the scope of the work presented was pointing toward an energy enhancement due to the special geometry. In this manuscript, we report on the results of the laser interacting with water droplets in the order of 50-μm diameter. The acceleration of protons, the resulting proton beam profile, and the effect of the target geometry on the electron motion for purely mass-limited targets compared to a two-dimensional target structure were studied.
Setup
The droplet target generator is based on a reservoir from which a liquid – here water – is pressed by a backing gas into a glass capillary. Those capillaries were produced using a laser-heated fully automated capillary-puller to obtain reproducible results. In front of the capillary, a filter frit with a mesh size of 0.3 μm was implemented to prevent clogging of any residual particles in the nozzle tip. Careful handling and pre-cleaning, as well as the use of ultra-pure water (HPLC grade) as droplet forming material lead to a continuous operation time of the capillary in the range of several hours in the experiment. The liquid exits the fine tip as continuous beam and breaks due to Plateau–Rayleigh Instabilities (Plateau, Reference Plateau1873; Rayleigh, Reference Rayleigh1878) into random fragments, which form droplets to minimize the surface energy. A piezo-actuator was attached to the capillary and excited at a multiple of the systems resonance frequency. These vibrations triggered the breakup and lead to a continuous formation of droplets of equal size and equal spacing. The technical details on the droplet target generator, like the parameter range and the dependence of the resulting capillary geometry on the pulling parameters, can be found in the publication by Schwind et al. (Reference Schwind, Aktan, Cerchez, Prasad, Willi and Aurand2019a). To control the droplet formations and as a diagnostic tool in the experiment, shadowgraphy was performed, using a frequency-doubled ( ${\rm \lambda} = 400$ nm,
  ${\rm \tau} = 30$ fs) probe beam at an angle of 100° with respect to the pump-beam direction. A separate delay line enabled us to probe the interaction at different times in the range of several 100 s of picoseconds with respect to the arrival of the pump pulse. Figure 1b shows a shadowgraphy image of the droplets by this beam. The droplet size was estimated to (48 ± 3) μm and the spacing in between droplets about (101 ± 4) μm.
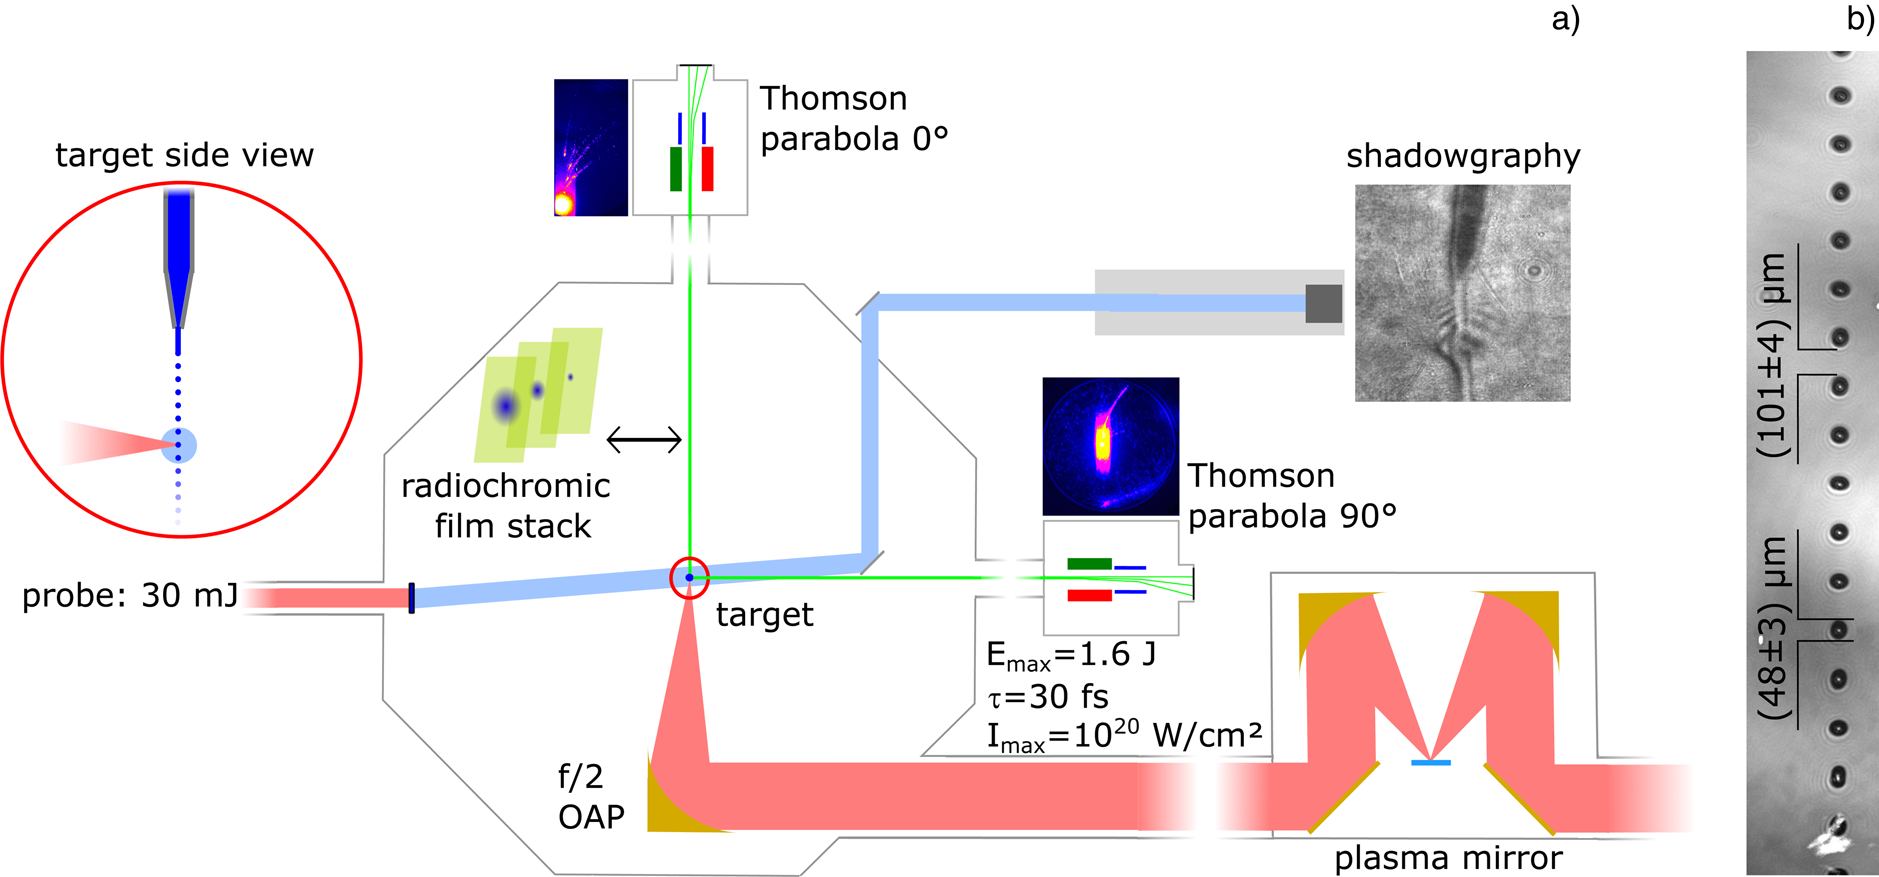
Fig. 1. (a) Scheme of the experimental setup. An f/2-OAP focussed the pump -pulse onto the droplet beam. The ion spectrum was measured in 0° and 90° with respect to the incident pump-beam axis. Additional RCF stacks could be placed in the forward direction. For alignment purpose and to measure the plasma expansion velocity, a frequency-doubled probe-beam is used to perform shadowgraphy. (b) Shadowgraphy image of the droplet stream.
The main setup is shown in Figure 1a. Using the ARCTURUS laser system at the University of Duesseldorf (Willi et al., Reference Willi, Behmke, Gezici, Hidding, Jung, Koenigstein, Pipahl, Osterholz, Pretzler, Pukhov, Toncian, Toncian, Heyer, Jaeckel, Kuebel, Paulus, Roedel, Schlenvoigt, Ziegler, Buescher, Feyt, Lehrach, Ohm, Oswald, Raab, Ruzzo, Seltmann and Zhang2009), a 200 TW double CPA scheme Ti:sapphire laser with an XPW contrast enhancement unit. The laser pulse with up to 1.6 J of energy on target and a pulse duration of 30 fs was focused by an off-axis parabolic mirror (OAP) onto the droplet stream, which was sent vertically – top to bottom – through the interaction chamber. The interaction point was set 15 mm downstream of the capillary tip, to prevent damage on the capillary. A focus diameter of 5 μm (FWHM) was obtained, corresponding to an intensity of 1 × 10²⁰ W/cm2. Performing a long-term pointing stability test, we measured the drift of the focus position to be (2.1 ± 3.1) μm over 30 min. The proton energy spectra were measured simultaneously by two Thomson-parabola (TP) spectrometers (Gwynne et al., Reference Gwynne, Kar, Doria, Ahmed, Cerchez, Fernandez, Gray, Green, Hanton, MacLellan, McKenna, Najmudin, Neely, Ruiz, Schiavi, Streeter, Swantusch, Willi, Zepf and Borghesi2014) in 0° and 90° with respect to the incident pump-beam axis. Using micro-channel plates (MCP) and a read out by CCD cameras enabled online monitoring of the spectrum. The energy resolution was chosen to be in the range of 0.05–10 MeV/n. Additional radiochromic films (RCF; Hey et al., Reference Hey, Key, Mackinnon, MacPhee, Patel, Freeman, Van Woerkom and Castaneda2008) could be inserted in the laser forward direction to retrieve the spatially resolved proton beam profile in this direction.
Measurements
The effect of the mass limitation and the electrical insulation of the droplets compared to the jet was studied. Therefore, the target expansion was probed for two different cases. Besides shooting on the isolated droplets, the interaction point was moved closer to the capillary nozzle to interact with the water jet before its fragments. This case represents a two-dimensional target structure, allowing hot electrons to escape along the jet direction. Figure 2a and 2b shows the raw images of the shadowgraphy for the laser, interacting with the jet before fragmentation and interaction with the droplets for a time in between 0 and 750 ps after the main pulse arrives, respectively. From those data, the longitudinal expansion velocity – full extension along the laser propagation direction – can be calculated to (0.26 ± 0.08) μm/ps for the jet and (0.45 ± 0.04) μm/ps in case of the droplets, as presented in Figure 2c. The difference by a factor of 1.6 can be correlated to the transverse escape of the electrons in the jet case, reducing the target heating and therefore the expansion velocity.

Fig. 2. (a,b) Shadowgraphy raw images of the plasma expansion from a water jet and droplets, probed at different delays in between 0 and 750 ps. (c) Measurement of the longitudinal expansion velocity of the jet or the droplet case, respectively.
This escape of the electrons described above can be observed experimentally in the accelerated proton beam profile. Placing an RCF layer in the laser forward direction, measuring the spatial beam profile of the protons (1.0 MeV < E Kin < 1.3 MeV) as shown in Figure 3, reveals the differences for both cases. In the horizontal plane, the opening angle for the jet is Θh,jet > ±30° and for the droplet about Θh,drop = ±9°. In the vertical plane, both opening angles are similar Θv,jet = Θv,drop = ±8°. This can be understood by accounting for the vertical escape of the electrons, which leads to a smoother electric field gradient in this direction compared to the horizontal plane. The proton divergence angle is proportional to the field gradient of the electric sheath field, as demonstrated before by Aurand et al. (Reference Aurand, Senje, Svensson, Hansson, Higginson, Gonoskovc, Marklund, Persson, Lundh, Neely, McKenna and Wahlstrom2016) for a flat target, working with an elongated laser beam structure. In the present case, the strong gradient in the horizontal direction causes a high divergence of the proton beam in this direction, resulting in a line-shape structure. In the case of the droplet, the proton beam pattern is symmetric around the laser forward direction since the electrons heated in the target perform a homogeneous motion, for example, to compensate reflux-currents, along the droplet surface. For both conditions, a filamentation in the proton beam profile becomes visible, which was observed before for non-conducting target material, for example, by Antici et al. (Reference Antici, Boella, Chen, Andrews, Barberio, Boker, Cardelli, Feugeas, Glesser, Nicolai, Romagnani, Sciscio, Starodubtsev, Willi, Kieffer, Tikhonchuk, Pepin, Silva, Humieres and Fuchs2017). This can be explained by Weibel instabilities Weibel (Reference Weibel1959), marking insufficient reflux of charges, causing a filamentation of the currents driven in the target, which imprints on the rear side sheath field and therefore on the proton beam profile. Measuring the proton energy spectra simultaneously in 0° and 90° reveal more information on the acceleration process from the droplet target. As can be seen in Figure 4, protons are accelerated in both spatial directions. In the 90° direction, the energy distribution is continuous, similar to a Boltzmann-shaped thermal distribution occurring for TNSA with a maximum proton energy of up to 6 MeV. In the 0° direction, the particle flux is overall much weaker, showing dominant peaks toward the cutoff energy at around 1.5–2.0 MeV. This peaked proton spectra in 0° direction appeared for most of the shots, while for the remaining spectra, there is only the very weak tail, as for example visible in the raw data image of Figure 5, reaching to about the same energy.

Fig. 3. Single layer of RCF placed 5 cm behind the interaction point in the forward direction. (Left) Interaction with the 2D jet structure leads to a directional proton beam signal, while (right) the interaction with a droplet gives a more homogeneous proton beam pattern.

Fig. 4. Proton energy spectra measured in the 0° and 90° direction with respect to the laser axis from the droplet target.

Fig. 5. Collective acceleration of protons and oxygen ions in the 0° direction with respect to the target occurring in some shots.
While in the 90° direction, the proton signal was dominant showing no acceleration of oxygen ions, in the 0° direction on some of the shots up to three times ionized oxygen (O1+, O2+, and O3+) ions were detected. These ions have more or less similar energy of about 0.11 MeV/n for all three charge states, as can be seen in Figure 5.
Simulations and analytic results
The target expansion velocity measured for the droplet – as a mass-limited target – of v D = (0.45 ± 0.04) μm/ps at an intensity of 1020 W/cm2 can be compared to previous measurements done on water droplet targets. Prasad et al. (Reference Prasad, Barnwal, Naik, Chakera and Gupta2011) revealed an expansion speed of 0.12 μm/ps for I = 1018 W/cm2 by inteferometric measurements, while Brandstätter et al. (Reference Brandstätter, Gambino and Abhari2018) retrieved 0.02 μm/ps for a much lower intensity of I = 1011 W/cm2 using a time-of-flight (ToF) detector. Since the target volume in these cases is still small – in the order of a few hundred μm3 – in a first approximation the droplet expansion velocity v D can be used as the lower estimate for the plasma expansion velocity v P. Using the correlation
 $$T_{{\rm e}}\lpar v_P\rpar = {v_P^{2}\cdot m_I\over Z_I}$$
the electron temperature can be deduced to T e ≈ 25 keV for the assumption that the target is evenly heated. As already can be seen in the raw images (Fig. 2), the expansion is not homogeneous, indicating that the heating and, therefore, the electron temperature is not evenly within the target, which will be further discussed in the simulation below. Therefore, the temperature above can only be used as a lower estimate of the achieved electron temperature.
Comparing the proton energy achieved (see Fig. 4) of 6 MeV to the other experiments on a spray or droplets, we got an increase in proton energy. In the spray experiments (Ramakrishna et al., Reference Ramakrishna, Murakami, Borghesi, Ehrentraut, Nickles, Schnuerer, Steinke, Psikal, Tikhonchuk and Ter-Avetisyan2010; Prasad et al., Reference Prasad, Borghesi, Abicht, Nickles, Stiel, Schnurer and Ter-Avetisyan2012) with a typical target size in the several 100 s of nanometer-diameter range proton energies of 1–2 MeV were obtained, while using droplets in the 10–20 μm diameter range, energies of 0.5–2 MeV were measured. With the specially designed 50 μm target in Burza et al. (Reference Burza, Gonoskov, Genoud, Persson, Svensson, Quinn, McKenna, Marklund and Wahlstrom2011), similar proton energies of 5–6 MeV were detected. It should be noted, using a 6-μm Ti-foil target and similar interaction conditions at the ARCTURUS laser system, a maximum proton energy of 6 MeV was reported in Schwind et al. (Reference Schwind, Aktan, Prasad, Cerchez, Eversheim, Willi and Aurand2019b).
In order to understand more details of the acceleration process, we performed 2D particle-in-cell (PIC) simulations, employing the EPOCH code (Arber et al., Reference Arber, Bennett, Brady, Lawrence-Douglas, Ramsay, Sircombe, Gillies, Evans, Schmitz, Bell and Ridgers2017). The target was initialized as a sphere with a diameter of 48 μm and an initial density of 3 × 10²² atoms/cm3, with a mass ratio of 0.811:0.189 ( $m_{{\rm O}}/m_{{\rm H}_2}$). As starting condition every cell contained 100 neutral particles representing the hydrogen and 50 neutral particles representing the oxygen atoms, while the barrier-suppression tunnel-ionization model used by the code was employed to depict the ionization process. The laser pulse is represented by a Gaussian-shaped electromagnetic field, polarized in the y-direction, with a wavelength of
  ${\rm \lambda} = 800$ nm propagating in the positive x-direction. The pulse is focused to a spot diameter of 4 μm and an intensity of 5 × 10¹⁹ W/cm2 at the left surface of the sphere. Figure 6 shows the evolution of the electric field within the first picosecond after the interaction, for the central plane (z = 0) of the sphere. At t = 0, the pulse is initialized at the left boundary of the box. From the simulation can be seen, that at the time step of 200 fs, the laser pulse is already gone and a number of hot electrons generated at the target front are moving toward the target rear-surface. While a few of those hot electrons are capable to leave the target rear side – visible at the right edge of the simulation box for
  ${\rm \tau} = 400$ fs – causing at this time a stronger electric field at the rear surface, a re-circulation of electrons around the target starts. At the time step of, for example,
  ${\rm \tau} = 600$ fs, the field maximum is at the target front surface again and was observed to travel at least two times forth and back along the surface, while continuously decaying. This re-circulation of the electrons was observed for different target geometries, for example, by Quinn et al. (Reference Quinn, Yuan, Lin, Carroll, Tresca, Gray, Coury, Li, Li, Brenner, Robinson, Neely, Zielbauer, Aurand, Fils, Kuehl and McKenna2011) for several hundred micrometer-thick plastic foils or by Tresca et al. (Reference Tresca, Carroll, Yuan, Aurand, Bagnoud, Brenner, Coury, Fils, Gray, Kuehl, Li, Li, Lin, Quinn, Evans, Zielbauer, Roth, Neely and McKenna2011) for the case of mass-limited metal foils. Besides re-circulation, a more pronounced, quasi-static field evolves transverse to the laser propagation direction, which becomes visible at
  ${\rm \tau} = 600$ fs and
  ${\rm \tau} = 1000$ fs.

Fig. 6. Evolution of the electric field in the y-direction around the target in the center plane (z = 0) of the sphere at four different time steps after the interaction. An inhomogeneous field distribution around the sphere can be seen.
The investigation of ions accelerated from the target in the 0° and 90° directions (Fig. 7) with respect to the laser propagation direction show that the protons which are accelerated in the transverse direction (90°) achieve higher energy compared to those accelerated in the forward direction (0°). Comparing the timing in Figures 5 and 6, this energy increase is correlated to the appearance of the field enhancement in the transverse direction. Note that the chosen simulation period of 1 ps was a compromise between accuracy and simulation-runtime since the given geometry is already very large to model for with PIC code. Actually, the obtained proton energy is still increasing for both directions at the end of the simulation period. Nevertheless, the effect of directionality becomes visible.

Fig. 7. Proton energy spectra obtained for the simulations within the first 1 ps after the laser-matter interaction in the 0° and 90° directions with respect to the laser propagation direction.
While in our studies on the much smaller hydrogen clusters, the laser electric field removed all electrons quasi-instantaneously, resulting in an isotropic electrostatic repulsion of the remaining ions in a CE (Aurand et al., Reference Aurand, Grieser, Toncian, Aktan, Cerchez, Lessmann, Prasad, Khoukaz and Willi2019), the experimental and numerical results above reveal, on the one hand, that the laser cannot remove all electrons and, on the other hand, the acceleration process is not isotropic.
Assuming in a first approximation still a CE, for which only a portion  $\hat {N}$ of the particles are ionized (assume q 1 = 1) and homogeneously distributed in the droplet, the electric potential Φ(r) at a position r can be described by
 $${\rm \Phi}\lpar r\rpar = {\hat{N}q_1\over 4{\rm \pi}{\rm \epsilon}_0R}\left({3\over 2}-{r^{2}\over 2R^{2}}\right)$$
with R the droplet radius. The highest energy is gained by a proton of charge q 2 = 1 situated at the shell (r = R) of the sphere and is given by
 $$E_{{\rm max}} = {\rm \Phi}\lpar R\comma\; q_1\rpar \cdot q_2 = {\hat{N}q_1q_2\over 4{\rm \pi}{\rm \epsilon}_0R}$$
 The number  $\hat {N}$ of ionized particles for such a large droplet is estimated to be the number of hot electrons N he generated in the interaction, for example, employing the model of Andreev et al. (Reference Andreev, Okada, Platonov and Toraya2004), with
 $$N_{\rm {he}} = {\rm \eta}{E_L\over T_{\rm {he}}}$$
where  ${\rm \eta}$ is the plasma absorption coefficient (Andreev et al., Reference Andreev, Platonov, Okada and Toraya2003), T he = m ec 2(a 0 − 1) is the hot electron temperature (Wilks et al., Reference Wilks, Langdon, Cowan, Roth, Singh, Hatchett, Key, Pennington, MacKinnon and Snavely2001), and E L is the laser energy on target. In this simplified ansatz, it is assumed that the absorbed part of the laser energy is evenly distributed into a number of hot electrons with the temperature T he derived from theory. For our interaction parameters with I L = 1 × 10²⁰ W/cm2 and E L = 1.6 J, we calculate a 0 = 6.8;
  ${\rm \eta} = 0.23$; T he = 2.9 MeV; and finally, N he ≈ 1.2 × 10¹². Inserting this result in Eq. (3) would get maximum proton energy of E max = 69.8 MeV which overestimates the measurement by a factor of 10. This discrepancy can be caused by different effect. Since the number of hot electrons (N he) calculated above is only a fraction of ≈ 10−5 of all electrons in the droplet a strong interaction with the remaining cold electrons will occur, distributing the energy more evenly into a larger number of electrons, while at the same time, the neutral atoms will shield the electric fields. This is in agreement with the experimental finding that the electron temperature we found from the expansion measurement, assuming a fully homogenized temperature distribution is more than a factor of 103 smaller than the calculated one. In addition, the model as mentioned above does not include the effects by a multi-ion mixture as it is the case for water as a target material.
Figure 8 shows the maximum proton energy depending on the droplet size, comparing the numerical and analytical models and the experimental value. The solid black line marks the maximum achievable energy for the CE of a fully ionized water droplet with q 1 = 10 (2 · H+ + O8+). As already deduced in the experiment, the highest ionization state observed for the oxygen ions is O3+. For this reason, it can be assumed that the degree of ionization is less than 1, represented by the different ( ${\rm \sigma} _{\rm {ioniz.}}$) of the target (colored solid lines in Fig. 8). Additionally, taking the number of electrons N he [Eq. (4)] – the laser can heat/ionize directly for our interaction condition – as constant, is represented by the dashed line. Finally, the solid point denotes the experimental value and the hollow square the simulated value for the maximum proton energy after 1 ps into the simulation.

Fig. 8. Calculated maximum proton energies for a Coulomb explosion of water droplets depending on the size and the degree of ionization (solid lines) or the number of ionized particles calculated for the interaction (dashed line). The points represent the experimentally measured and numerical calculated maximum proton energies.
The effect of the mono-energetic ion components appearing in the 0° direction effect was observed before for different kinds of mass-limited targets. For heavy-water droplets, this effect was reported by Ter-Avetisyan et al. (Reference Ter-Avetisyan, Schnurer, Nickles, Kalashnikov, Risse, Sokollik, Sandner, Andreev and Tikhonchuk2006) and for micrometer-size CH-dots attached to a Ti-foil by Schwoerer et al. (Reference Schwoerer, Pfotenhauer, Jackel, Amthor, Liesfeld, Ziegler, Sauerbrey, Ledingham and Esirkepov2006). A number of analytic models exist to explain this feature based on the target composition. While layered targets, with two spatially separated components, can be described by a model of Esirkepov et al. (Reference Esirkepov, Bulanov, Nishihara, Tajima, Pegoraro, Khoroshkov, Mima, Daido, Kato, Kitagawa, Nagai and Sakabe2002), which is not suitable for our case, the model, proposed by Tikhonchuk et al. (Reference Tikhonchuk, Andreev, Bochkarev and Bychenkov2005) fits our experimental conditions. In this model, the ions are accelerated to a certain velocity by a shock, originating by a collisionless rarefaction, of light and heavy ions which are driven by a two-temperature electron distribution in the target. This is true for our experiment, in which the laser heats only a fraction of the target material, directly. The electrostatic potential due to the charge separation in the rarefaction is given by Ter-Avetisyan et al. (Reference Ter-Avetisyan, Schnurer, Nickles, Kalashnikov, Risse, Sokollik, Sandner, Andreev and Tikhonchuk2006):
 $$q{\rm \Phi} = T_{\rm {e}} \lpar 1 + \ln{\lpar 8\sqrt{Z_{i}}\rpar }\rpar $$
with T e the electron temperature and Z i the heavy ion charge state. Assuming that the oxygen ions in the droplet bulk are at most one time ionized (Z i = 1) and the electron temperature is between minimum 25 keV – as the lower estimate from the droplet expansion velocity above – and maximum 2.6 MeV – as calculated above –, this results in an electrostatic potential in between 77 kV and 9 MV accelerating the lighter ions (protons). This is in the range with the observed energy of 1.5–2 MeV for the protons in Figures 4 and 5. For the oxygen ions, as occurring in Figure 5, the acceleration process is not fully conclusive. While the normalized energy per nucleon, for  $^{1}_{1}{\rm H}^{ + }$ and
  $^{16}_{8}{\rm O}^{1 + }$, would indicate an acceleration in the same electrostatic field since the oxygen ions gains consequently about 1:16 of the energy per nucleon compared to the protons, the observation is not in agreement with the same energy measured for the different charge states of oxygen. If those different charge state ions are accelerated in the same field, they should gain different energies per nucleon. The obtained results point toward a collective acceleration process, at least for the oxygen ions, which was observed for a mechanism like RPA (Aurand et al., Reference Aurand, Senje, Svensson, Hansson, Higginson, Gonoskovc, Marklund, Persson, Lundh, Neely, McKenna and Wahlstrom2016) before. To our current understanding, there is no model explaining both features at the same time.
Conclusion
Employing a synchronized water droplet target generating droplets in the 50-μm diameter range, we investigated the interaction of these droplets with a high-intensity laser pulse, studying different effects. On the one hand, the benefit of mass-limited targets, compared to 2D target structures in terms of target heating, measured by the expansion velocity of the target, was found. On the other hand, a study on the spatial beam profile of the accelerated protons revealed that the target geometry can have a significant impact of the spatial distribution of these accelerated particles, for example, enabling a pre-shaping of the particle beam for further applications. Overall, proton energies of up to 6 MeV were obtained, which were higher compared to previous results, reported in the literature for smaller droplets and correspond to the proton energies obtained from foil targets using the same laser system. This underlines that this target scheme, with the benefits of high repetition rate and easy target delivery, in terms of energy is comparable to the results obtained by the well-known TNSA process. In addition, the energy spectra reveal – depending on the observation direction – a narrow energy distribution, which could be beneficial for further applications like post-acceleration. Employing numerical simulations enabled us to model the dependence of the acceleration process on the spatial direction and to identify a spatially inhomogeneous electrical field distribution evolving around the droplet as the cause. Different analytical models reveal that the achieved proton energies are within the expected range, depending on the number of hot electrons and their distribution within the target. The occurrence of the narrow-energetic spectral components for the protons can be explained by an existing model which accounts for the rarefaction of two ion species.
Besides the study of this fundamental processes, the droplet target source was proven to deliver a continuous stream of targets for the laser-plasma interaction and is capable to operate over several hours as a source for laser-accelerated protons in the MeV range.
Acknowledgments
This project was supported by the strategic research fund of the University of Düsseldorf (Project: F2015/750-13). Computational support and infrastructure was provided by the “Centre for Information and Media Technology” (ZIM) at the University of Düsseldorf (Germany).


