1. Introduction
Single-use plastic bags started appearing in Nepal in the 1990s and their use as a cheap and convenient tool for shopping has increased very quickly. They are however a major source of non-degradable solid waste, estimated at 12 per cent in Nepal in 2012 (Manandhar, Reference Manandhar2012; Asian Development Bank, 2013). Without effective management, they could become a major source of soil and water pollution (Baker, Reference Baker2010) while also marring the beauty of the landscape and clogging the drainage systems, contributing thereby to floods (Spivy, Reference Spivy2003; Pervin et al., Reference Pervin, Rahman, Nepal, Haque, Karim and Dhakal2019; Rai et al., Reference Rai, Nepal, Khadayat and Bhardwaj2019). When burnt, these bags emit dangerous air pollutants and when dumped in landfill sites, their long decomposition process comprising toxic chemicals leaches into the ground, polluting ground water reservoirs.
Across the world, authorities have adopted different approaches to control the use of plastic bags, among them, levies, indirect taxes and bans (Nielsen et al., Reference Nielsen, Holmberg and Stripple2019). While a ban on the use of plastic bags is more popular in African and Asian countries, levies are preferred in Europe. Previous studies have suggested that a ban or levy on plastic bags affects consumer behavior (Office of Economic Analysis, 2011) resulting in a reduction in plastic bags use (Gupta, Reference Gupta2011) and an increase in the use of reusable bags (Waters, Reference Waters2015), though with varying results.
Although a levy on plastic bags was associated with a reduction in the use of plastic bags in Portugal (Martinho et al., Reference Martinho, Balaia and Pires2017), in contrast in South Africa its effectiveness was found to be short-lived (Dikgang et al., Reference Dikgang, Leiman and Visser2012). The effectiveness of the interventions also depends critically on their implementation (Gupta, Reference Gupta2011; He, Reference He2012). Even though the production and distribution of plastic bags is banned in Bangladesh and parts of India, this interdiction is poorly implemented and commonly violated in some places (Hossain, Reference Hossain2002; Gupta, Reference Gupta2011). A recent study found that South Asian stakeholders prefer conversion of waste to energy as a way of managing solid waste properly (Haque et al., Reference Haque, Lohano, Mukhopadhyay, Nepal, Shafeeqa and Vidanage2019).
In Nepal, the government started to regulate the use of plastic bags by issuing a Plastic Bag Reduction and Regulation Directive in 2011, which essentially prohibits the use of thin plastic bags (below 20 microns) in the retail sector. However, at the local level, the adoption of the ban varied, with some municipalities prohibiting all single-use plastic bags while others showed no interest at all in regulating their use. Moreover, even where a partial ban (defined as a ban on single-use plastic bags thinner than 20 micron, i.e., a thickness-based ban) or a complete ban (defined as a ban on all kinds of single-use plastic bags regardless of their thickness) was adopted, the effective implementation of the ban also varied. This led one local newspaper to state: ‘Several loopholes prevalent in the ban have made its implementation more challenging. (…) No doubt, any law becomes meaningless when it lacks effective enforcement, and this has been very common in Nepal’ (The Rising Nepal, n.d.).
Our study is based on an original survey carried out in 56 sites in 13 municipalities in Nepal in 2014 in order to investigate the determinants of the effectiveness of the plastic bags ban policy across municipalities. We focus in particular on the role of the perceived sanction when violating the ban, both in terms of the probability of detection of the violation and in terms of the amount of the fine that consumers or retailers expect to be charged. These measures are proxies for the monitoring and enforcement effort of the policy at the municipality level.
As the plastic bags ban has not been implemented randomly across municipalities, we also consider an instrumented version of our estimations, using the size of the city police as an instrument for the perceived sanction. We wish to emphasize that the main objective of our study is to provide empirical evidence of the effects of law enforcement (with police per capita used as a proxy) on plastic bag use, and not to make a claim for causal inference. For our purposes, ‘single-use’ plastic bags refer to those bags that cannot be reused, mainly thin grocery bags less than 20 micron in thickness.
Our results indicate that partial bans, based on the thickness of the bag, are poorly implemented. More importantly, the results suggest that the perceived sanction is a critical determinant of plastic bags use as a doubling of the perceived sanction could reduce the use of plastic bags by two-thirds for retailers and one-half for consumers. Moreover, while the nominal amount of the fine does not seem to play a role, the probability of being detected is a major factor behind the perceived sanction. This implies that effective monitoring of the ban by the municipal authorities, at least in the initial stage of the ban, would be critical for the successful implementation of the plastic bags ban policy.
In section 2, we briefly describe the evolution of the plastic bags policy in Nepal. We present our empirical strategy in section 3 and the main estimation results in section 4. Section 5 discusses some of the results and concludes.
2. Bans on plastic bags and enforcement in Nepal
The history of banning plastic bags in Nepal dates back to 1995 when the Hetauda municipality decided to ban single-use plastic bags. The ban however became ineffective after a while and, during the decade-long Maoist insurgency in the country, no other action was taken (Nepal et al., Reference Nepal, Bohora and Gawande2011). In 2010, the Ilam municipality in far Eastern Nepal imposed a complete ban on single-use plastic bags.Footnote 1 In 2011, the government of Nepal issued a Plastic Bags Reduction and Regulation Directive that prohibits the use and the production of plastic bags thinner than 20 microns (Government of Nepal, 2011).Footnote 2 The emphasis on the thickness of the bag stems from the following two facts: one, thicker bags, when discarded, are easier to collect and can be recycled profitably unlike thinner bags; and two, in practice, thicker plastic bags can be reused several times. Since, the implementation of the directive was left to the municipalities, they have adopted various approaches to regulate the use of plastic bags.
Some municipalities, following the municipality of Ilam, imposed a ‘complete ban’ on all types of single-use plastic bags. In these ‘complete ban’ municipalities, plastic bags that can be used several times, typically the thicker ones, continue to be allowed (as well as nylon, cotton or paper bags). A second set of municipalities, following the Directive, imposed a ‘partial ban’, prohibiting single-use plastic bags less than 20 microns in thickness.Footnote 3 They permitted the use of bags thicker than 20 microns, even if they were of the single-use type. In contrast, a third set of municipalities did not take any particular action as the Directive was not specific about the consequences of non-implementation as it was only a directive, not a regulation. By 2013, among the 58 municipalities in Nepal, nine had imposed a complete ban and ten a partial ban.Footnote 4
The typical procedure followed in the implementation of the plastic bags ban is as follows. Once approval by the municipal council and negotiations with the relevant stakeholders such as the local traders’ association are complete, a coordination committee is formed. An awareness campaign is launched, after which the ban is declared and announced in various public meetings. A phase of intensive monitoring and inspections follows thereafter, a few weeks after which the level of monitoring is gradually reduced, becoming occasional, after which the task of ensuring effective implementation of the ban is delegated to the city police.
The enforcement of the ban varies significantly across municipalities. The interviews carried out with local officials revealed that among the reasons for ineffective implementation were lack of resources and changing priorities of the municipalities, as well as weak support from retailers’ associations and the general public.Footnote 5 Furthermore, while some municipalities decided on a ban, they did not impose any sanctions in case of violations. In the case of others like the Gorahi municipality, which decided on a complete ban and fixed a fine (of 25 Nepalese rupees or NPRFootnote 6) per offence, the ban was ineffective in the absence of proper implementation of the sanction. Similarly, although the Kathmandu Metropolitan City declared a complete ban in 2013, the plastic bags producer association filed a case against the ban in the Supreme Court of Nepal and the court issued a stay order on the ban. Again in 2015, the Government of Nepal declared a ban on single-use plastic bags in the Kathmandu Valley (Government of Nepal, 2015) but the implementation of the ban was dropped after the country was hit by massive earthquakes claming thousands of lives.
3. The empirical approach
3.1 The survey
We carried out an original survey in the fall of 2013, interviewing 1,357 retailers and 1,375 consumers. First, we randomly selected five out of the nine municipalities that had implemented a complete ban, three out of the ten municipalities that had implemented a partial ban, and five out of 39 municipalities that had not implemented a ban. We then divided each municipality in the sample based on area and population size into different geographical regions and randomly drew three to five clusters from each of them, for a total of 56 clusters. In each cluster, we randomly selected a couple of neighborhoods (for example, going by commercial street and junction for demarcation) in which to carry out individual interviews with all the retailers and 30 of the consumers.Footnote 7 The response rate among retailers was very high, close to 100 per cent, while it fell to 70 per cent among customers. Those who refused to take part in our survey cited ‘lack of time’ as their main reason (as in He, Reference He2012).
The retailer questionnaire centered around their use of different categories of plastic bags, in kilograms (kg) per week, and the associated costs as well as information on individual and shop characteristics (such as the weekly sales or the type of shop). The consumer questionnaire included various questions about their weekly use of plastic bags and reusable bags, broken down by the type of good purchased (e.g., grocery, dairy products, meat, vegetables, clothes, medicine and other types of goods). (The retailer and the consumer questionnaires are available in the online appendix.) We also recorded the use of various types of bags that were used by the sampled consumers during the survey. The participants were also asked about household size and household characteristics. In municipalities that had imposed a ban, both types of respondents were also asked about their chances of being caught and fined for using a plastic bag. We also interviewed a local official in each municipality about the fines that they levied on both retailers and consumers in case of violation. Where applicable, we also solicited information from officials on the history of the ban.
3.2 The empirical strategy
In our estimations, we essentially focus on the behavioral response of consumers and retailers to the plastic bags ban policy in different municipalities of Nepal. We first investigate the use by both consumers and retailers of single-use versus reusable plastic bags as a function of the type of ban chosen by the municipality (complete, partial or no ban). To this end, we first estimate a very simple model, using ordinary least squares (OLS), as follows:

where B im,j is a measure of the use of type j bags by individual i in municipality m. j refers to type of bag: (a) plastic bags that are of single-use type, and (b) reusable bags which include all types of reusable bags such as cotton or jute; completebanm = 1 if municipality m has a complete ban and 0 otherwise; and partialbanm = 1 if municipality m has partial ban and 0 otherwise. For retailers, we measure bags use by weight, in grams (g) per day, as most of the bags are bought in bulk and paid for by weight. For consumers, we measure the number of bags used over the past week.
In equation (1), X refers to a vector of individual, household and municipality characteristics that may affect the bags use decision of an individual. Thus, for consumers, we include relevant individual characteristics such as education, gender, age, house ownership, type of household, monthly income and the average number of trips to the market in all regressions. Most of these have been shown to be significantly associated with compliance in the literature (Becker, Reference Becker1968; Winter and May, Reference Winter and May2001; Convery et al., Reference Convery, McDonnell and Ferreira2007; Zhang et al., Reference Zhang, Hussain, Deng and Letson2007; Barnes et al., Reference Barnes, Chan-Halbrendt, Zhang and Abejon2011; He, Reference He2012; Ravara et al., Reference Ravara, Castelo-Branco, Aguiar and Calheiros2013).
Gender is especially important as women in Nepal generally carry reusable bags in their handbags. For retailers, we control for two measures of the activity level of the retailer, i.e., the average number of transactions per day and the daily sales income as well as a number of relevant individual characteristics such as age, gender, house ownership, registered retailer, membership in a traders’ association, and the type of shop and goods sold. The municipality characteristics include the average number of trips to the market by consumers, population density, literacy rate, administrative performance index, the amount of grants received from the central government (as a measure of the available resources at the municipality level), and the proportion of urban area (measured as the percentage of urban wards in the municipality). As discussed in Tyran and Feld (Reference Tyran and Feld2006), a larger area or a denser population may weaken enforcement if the monitoring effort remains the same across municipalities. Finally, in all regressions, we estimated consumer and retailer equations using clustered robust standard errorsFootnote 8 as the behavior of consumers (or retailers) is likely to be similar within a given cluster.
With regard to the estimation of equation (1), one could argue that just comparing the use of bags as a function of the type of ban decided by the municipality is not very informative. On the one hand, this comparison across types of ban misses the actual level of enforcement implemented by the municipality, which may be more important than the type of ban in terms of the behavioral response. On the other hand, the decision on a plastic bags ban could itself be endogenous, carrying a risk of reverse causality because it is possible that the decision to enforce a stricter policy was itself the result of excessive plastic bag use in those particular municipalities.
In our main analysis, we therefore concentrate on two relevant dimensions of enforcement that show variation across municipalities. The first is the level of the fine in case of violation, which varies from NPR15 (or, in some cases, even 0) to NPR500 (which is the case in Ilam). The second dimension is the probability with which a violation is detected and sanctioned, which closely depends on the capacity to monitor the ban. Since we measure this dimension by the perceived probability of detection expressed by the users, this dimension also varies within municipalities. Following the literature (Becker, Reference Becker1968; Winter and May, Reference Winter and May2001; Gray and Shadbegian, Reference Gray and Shadbegian2005), we expect the impact of a ban on consumers and retailers to depend on the perceived sanction in case of violation. We define the perceived sanction by individual i in municipality m, E im, as:

where p im represents the probability of individual i being sanctioned, and F m represents the amount of the fine in municipality m. In our estimations, we follow the literature and rely on a self-reported measure of the probability of sanction, estimated through a five-point scale (from ‘never’ to ‘always’; see, for example, Burby and Paterson, Reference Burby and Paterson1993; Rooij et al., Reference Rooij, Fryxell, Lo and Wang2013). This is because we focus on individual behavior, which depends on the individual's perception of the risks faced. Moreover, the literature suggests that a self-reported measure sufficiently predicts actual levels of enforcement (Burby and Paterson, Reference Burby and Paterson1993).
Our main estimation relates bags use to the level of the perceived sanction as follows:

For consumers, the threat of the expected fine should be large enough to cause a shift from single-use plastic bags to reusable bags. If the expected fine is too low, consumers may rationally choose to continue using single-use plastic bags. This situation is similar to the late pick-up behavior of parents at childcare centers analyzed by Gneezy and Rustichini (Reference Gneezy and Rustichini2000), where parents were systematically late in picking up their children because the penalties sanctioning this behavior were too small. Given the low cost of using a reusable bag, however, the expected fine need not be very large, and a low fine can be compensated by a large enough probability of detection (Taylor and Villas-Boas, Reference Taylor and Villas-Boas2016).Footnote 9
The response of the retailers may differ since they are typically involved in the decision-making at the municipality level. The ban may also be less costly to them as they could save on the cost of single-use plastic bags, which they provide free to the consumers, while selling reusable bags. For instance, some large-scale retailers in Nepal, such as Bhatbhateni and Big Mart, have stopped providing plastic bags, requiring consumers either to buy reusable bags or bring bags from home.
The estimation based on the OLS method, however, faces a potential endogeneity problem as the enforcement of the ban is not random (Gray and Shadbegian, Reference Gray and Shadbegian2005). For example, municipalities may be choosing areas for concentrated enforcement where the problem is severe and compliance is low. More generally, we expect the perceived sanction to be correlated with various unobserved municipal characteristics related to the use of plastic bags and law enforcement as well as retailer characteristics (for instance, whether retailers rationalize their overuse of plastic bags by downplaying the penalties they may face). We partially address this problem by instrumenting the expected fine by the size of the city police per capita in the municipality m, CP m, which is defined at the municipality level (the measure is the number of city police per 1,000 inhabitants). We therefore estimate our model (equation (4)) through two-stage least squares (2SLS):

This approach relies on the following exclusion restriction. The presence of the city police does not affect the use of plastic bags directly but indirectly – through the expected fine that consumers or retailers expect to pay in the case of violation. In this respect, it is worth noting that none of the municipalities surveyed reported recruiting additional city police consequent to the ban or because of too much plastic waste. One could still argue that the instrument is correlated with the error term. Thus, it is entirely possible that police per capita is correlated with a ‘law and order’ social norm which is not observable but directly affects the use of plastic bags. As a result, we will take these estimates as an indicator which helps to complement the results obtained by simple OLS.
Finally, in the last set of results, we follow an estimation strategy that does not depend on the ‘perceived sanction’ but instead decomposes the latter into its two components, the perceived probability of detection and the actual fine imposed by the municipality, as follows:

In this particular specification, p im and F m are introduced linearly and separately. This specification allows us to investigate whether the use of plastic bags is more sensitive to the actual fine announced by the municipality or to its level of enforcement, as captured by the perceived probability of being caught. We also estimated equation (5) where the probability of being caught is instrumented by the number of city policy per capita, while controlling for the level of the fine.
4. The empirical results
4.1 Descriptive statistics on bags use and expected fines
In table 1, we provide some basic information on the use of different types of bags by both retailers and consumers. On average, a retail shop uses 88 g of plastic bags and 23 g of reusable bags per day. The amounts used vary drastically across municipalities; in partial ban municipalities, the average amount of plastic bags used by retailers amounts to 164 g a day, a larger amount than in either no ban municipalities or in complete ban municipalities where it is approximately 91 and 47 g per day, respectively. As can be expected, the use of reusable bags shows a corresponding variation in the other direction, from 6 g per day in no ban municipalities to 46 g per day in complete ban municipalities. The daily cost of bags to the retailers shows a similar picture.
Table 1. Summary statistics of bags use in three different types of ban municipalities

Source: Field survey, 2014.
The weekly use of plastic bags by consumers reveals a similar pattern. It is lowest in complete ban municipalities and highest in partial ban municipalities. A household uses, on average, 10 plastic bags and 1.5 reusable bags per week. The use of plastic bags is significantly lower in complete ban municipalities, at 6.9 plastic bags per week, in comparison with an average of 16.4 bags used weekly in partial ban municipalities. Conversely, reusable bags tend to be in use more in complete ban municipalities.
Table 2 presents descriptive statistics on the expected fine faced by both consumers and retailers. Since both the amount of the fine and the probability of being caught are equal to zero in no ban municipalities, they are not reported in the table. On average, the perceived probability of being caught while using a plastic bag and the corresponding perceived sanction are equal to 0.24 (24 per cent) and NPR23.04, respectively, for a consumer. But both vary substantially across municipalities. The probability of detection is much larger in complete ban municipalities than in partial ban municipalities (0.30 as compared to 0.10) while the amount of the fine fixed by the municipality is slightly larger under partial bans than under complete bans (NPR120 as compared to NPR92.4). The average perceived sanction across all consumers is equal to NPR30.6 in complete ban municipalities, which is much larger than in partial ban municipalities, where it is on average equal to NPR7.4. Finally, it must be noted that, even among municipalities that apply a similar ban, the level of the perceived sanction varies a lot. For instance, in the two complete ban municipalities of Ilam and Mechinagar, it is equal to NPR73 in the former but only NPR23 in the latter.
Table 2. Summary statistics of the perceived sanction among retailers and consumers

Notes: Significance: ***p < 0.01.
For retailers, the average perceived probability of being caught is equal to 0.46 and the average perceived sanction is equal to NPR139. Although the probability of detection is slightly larger in partial ban municipalities (0.58 versus 0.41 in complete ban municipalities), the nominal fines are lower. Consequently, the average perceived sanction for retailers is NPR149 under a complete ban while it is NPR121 under a partial ban. (See table A1 for descriptive statistics of other variables.)
4.2 Comparing different types of bans
In tables 3 and 4, we compare the use of plastic bags across municipalities as a function of the type of ban they implement. Table 3 presents the results obtained for both single-use and reusable bags at the retailer level. The weight of bags used by the retailer is regressed on the type of ban implemented in the municipality as well as two measures of the activity level of the retailer (the average number of transactions per day and the daily sales income). We also control for the number of retailers as well as for shop and municipality characteristics (not reported in the table 3).
Table 3. Retailer bags use behavior by type of municipality (grams per day per retailer)

Notes: Robust standard errors in parentheses. Significance: ***p < 0.01, **p < 0.05, *p < 0.1.
Other controls include two sets of variables: retailer characteristics and municipality characteristics. Retailer characteristics are age, gender, house ownership, registered retailer, member of FNCCI, type of shop, type of good sold, etc. Municipality characteristics include the average number of trips to the market by a consumer, population density, literacy rate, index of administrative performance, total grant received, and percentage of urban area.
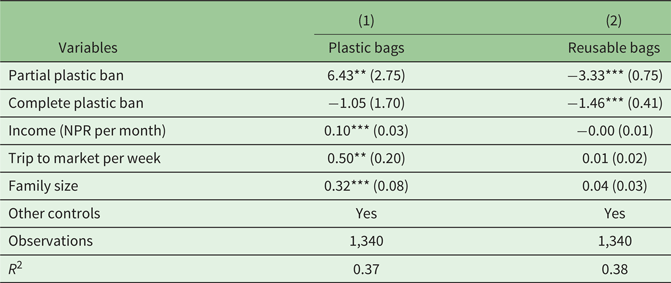
Table 4. Consumer bags use behavior by type of bags (number of bags used per week per household)

Notes: Robust standard errors in parentheses. Significance: ***p < 0.01, **p < 0.05.
Two sets of variables are controlled – individual characteristics and municipality characteristics. Individual characteristics include gender, education, age, marital status, time spent watching TV, household composition, house ownership, and labor force participation. Municipality characteristics include the average number of trips to the market by a consumer, population density, literacy rate, index of administrative performance, total grant received, and percentage of urban area.
The estimated coefficient on the partial ban dummy is 28.22 (which is not significant) for plastic bags and −29.06 (significant at 5 per cent) for reusable bags, suggesting that, on average, the partial ban policy is not very effective in deterring the use of plastic bags or promoting the use of reusable bags.Footnote 10 In municipalities following a complete ban policy, on the other hand, the use of plastic bags decreases by a large amount (i.e., plastic bag use drops to 43.76 g a day per retailer in complete ban municipalities as compared to an average use of 88 g per day across all municipalities) while the use of reusable bags increases by 34.1 g per day per retailer.
In table 4, we present a similar estimation for consumers where the dependent variable is the average number of bags used by consumers with controls for the characteristics of consumers and municipalities. The results again suggest that partial ban municipalities exhibit a larger use of plastic bags by consumers (at 6.43 more bags per week) and a fall in the use of reusable bags. In complete ban municipalities, the effect of the plastic bags ban is imprecisely estimated, with a fall in the use of reusable bags by about 1.46 bags per week.
As discussed before, a simple comparison of the three groups of municipalities could hide large differences among them and, as shown in table 4, yields imprecise or counterintuitive estimates. The effect of a ban critically depends on the degree of ban enforcement carried out by the municipality. Considering the type of ban without taking into account the varying degrees of enforcement does not provide a true picture of the effectiveness of the ban. In the following, we analyze the large variations we observed across municipalities in the perceived probability of being caught and in the amount of the fine.
4.3 The effects of the perceived sanction
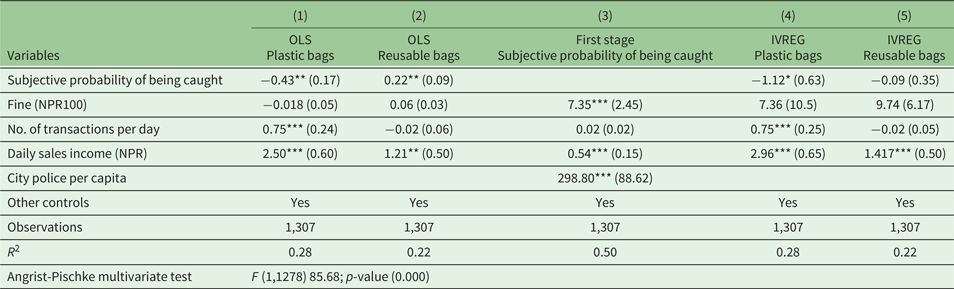
We now turn to one particular measure of enforcement, the perceived sanction at the municipality level, which is the expected amount of the fine that violators would pay in case of detection. In table 5, we estimate equations (3) and (4) with respect to the use of plastic bags by retailers. Column (1) presents OLS estimates of the effect of the expected fine on plastic bags use (in g per day). In the next three columns, we report the 2SLS results, where column (2) reports the results of the first stage estimation, in which the perceived sanction is instrumented by the number of city police per 1,000 inhabitants in the municipality. Column (3) reports the second stage estimates for the effect of the perceived sanction while the last columns report estimates for municipalities with a partial or complete ban, separately. Table 6 presents a parallel set of estimates for the use of reusable bags by retailers.
Table 5. Effect of the perceived sanction on plastic bags use by retailers (grams per day per retailer)

Notes: Robust standard errors in parentheses. Significance: ***p < 0.01, **p < 0.05.
Other controls are similar to those in table 3.
Table 6. Effect of the perceived sanction on reusable bag use by retailers (grams per day per retailer)
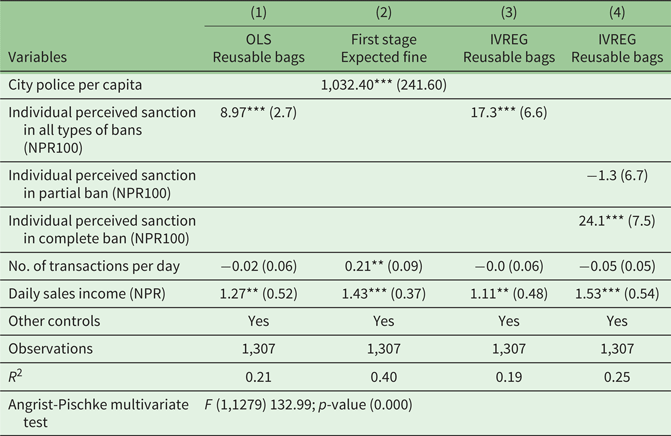
Notes: Robust standard errors in parentheses. Significance: ***p < 0.01, **p < 0.05.
Other controls are similar to those in table 3.
The first column of tables 5 and 6 suggests that the perceived sanction by a retailer discourages the use of plastic bags and promotes the use of reusable bags. The use of plastic bags declines by 8.8 g and that of reusable bags increases by 9.0 g per retailer per day when the perceived sanction increases by NPR100. As column (2) indicates, the size of the city police per capita is strongly correlated with the perceived sanction, with a highly significant first stage estimate (and an F value of 132.99 on the Angrist-Pischke multivariate test). The second stage estimates presented in column (3) of tables 5 and 6 are larger than the OLS results, suggesting that the latter are possibly biased downwards due to endogeneity. An increase in the perceived sanction of NPR100 reduces the retailers’ use of plastic bags by 34.6 g per day and increases the use of reusable bags by 17.1 g per day. These effects are potentially large, given an average use of 88 g of plastic bags and 23 g of reusable bags across municipalities. Column (4) of tables 5 and 6 presents the estimated coefficient separately for partial ban and complete ban municipalities.Footnote 11 The effects of the perceived sanction are significant only in the complete ban municipalities and are of the same order of magnitude as those in column (3).
In tables 7 and 8, we report the estimates by relating the perceived sanction to the use of plastic and reusable bags by consumers. These models parallel the ones presented in tables 5 and 6. The OLS estimates suggest that an increase in the perceived sanction by NPR100 reduces the number of plastic bags used by 5.67 per week per household. As in the case of the retailers, the 2SLS estimates are larger than the OLS as a similar increase in the perceived sanction reduces the number of bags used by 15.93 per week per household. This estimate is significant only in complete ban municipalities. The use of reusable bags, on the other hand increases in the complete ban municipalities. According to the 2SLS estimate, with an increase in the perceived sanction by NPR100, 4.9 additional reusable bags are used per household weekly.
Table 7. Effect of the perceived sanction on the use of plastic bags by consumers (number of bags used per week per household)

Notes: Robust standard errors in parentheses. Significance: ***p < 0.01, **p < 0.05.
Other controls are similar to those in table 4.
Table 8. Effect of the perceived sanction on the use of reusable bags by consumers (number of bags used per week per household)

Notes: Robust standard errors in parentheses. Significance: ***p < 0.01, **p < 0.05.
Other controls are similar to those in table 4.
4.4 Separate treatment of fine and probability of detection
In the last two tables 9 and 10, we present results where we estimate equation (5) by introducing separately the perceived probability of detection and the amount of the fine imposed by the municipality. Table 9 presents the estimations at the level of the retailer, where the first two columns show OLS results for single-use and reusable bags, respectively, while the last three columns present the 2SLS results where the city police per capita is used as an instrument for the perceived probability of being caught. Table 10 presents similar estimations at the consumer level. Interestingly, these two sets of results suggest that it is not so much the amount of the fine that matters but the probability of detection. The coefficients associated with the fine are typically low in magnitude and very imprecisely estimated while the coefficients associated with the probability of detection are much more consistent and precisely estimated. According to the simple linear estimations in column (1), an increase in the probability of detection by 10 percentage points reduces the use of single-use bags by retailers by 4.3 g per day and the number of bags used by consumers by 0.5 bags per week. The use of reusable bags increases accordingly. These estimates suggest that it is not so much the amount of the fine announced by the municipality that matters but the degree of monitoring and enforcement of the ban as measured by the probability of detection perceived by the user. Hence, the presence of city police and the effective monitoring of the ban seem to play a much more critical role in plastic bags use than the nominal amount of the fine announced by the municipality.
Table 9. Estimated effect of probability of detection and fine on bags use by retailers (grams per day per retailer)

Notes: Robust standard errors in parentheses. Significance: ***p < 0.01, **p < 0.05, *p < 0.1.
Other controls are similar to those in table 3.
Table 10. Estimated effect of probability of detection and fine on bags use by consumers (number of bags used per week per household)
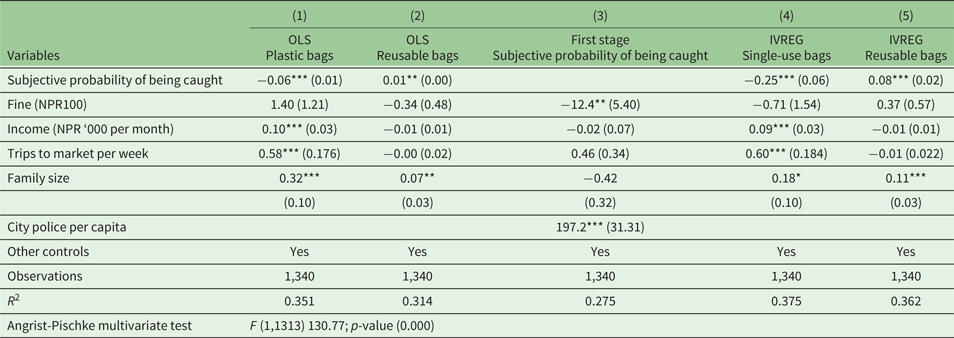
Notes: Robust standard errors in parentheses. Significance: ***p < 0.01, **p < 0.05, *p < 0.1.
Other controls are similar to those in table 4.
5. Discussion and concluding comments
The results of our study indicate that a higher level of the perceived sanction can play the role of a deterrent in the use of plastic bags and in promoting the use of reusable bags. In Ilam municipality, which is one of the most successful municipalities in Nepal in reducing the use of plastic bags, the perceived sanction for retailers is NPR226 with a perceived probability of being caught around 0.45 and an average fine of NPR500 per violation. As a result, single-use plastic bags have almost disappeared in Ilam.
In our sample, the average perceived sanction amounts to NPR149 for the retailers and NPR30.6 for the consumers in complete ban municipalities. In these municipalities, the average daily use of plastic bags is about 88 g per day per retailer and about 10 bags per week per consumer. According to our 2SLS results – column (3) of table 5 – a doubling of the perceived sanction (+NPR49) could induce retailers to reduce their use of plastic bags by about 52 g per day. Similarly, a doubling of the probability of detection (i.e., an increase up to 29 percentage points) could lead to a drop of comparable magnitude at 33 g per day (column (4), table 9). At the consumer level, a doubling of the perceived sanction (+NPR32.9) reduces the number of plastic bags used per week by about 5.6 bags (column (3), table 7) while a doubling in the probability of detection (+18.47) leads to a decline in plastic bags use by 4.5 bags (column (4), table 10). Overall, according to these estimates, a doubling in the perceived sanctions leads the use of plastic bags to drop by about one-half for all users. We also find systematic evidence of strong substitution effects in favor of reusable bags for both retailers and consumers.
The OLS estimates are systematically smaller, by an order of three, implying that much larger fines or monitoring is needed to achieve the same effects. As discussed above, our instrumentation strategy, which relies on the police force in the municipality, is not without weakness. Hence, these estimated effects should be taken as indicative, as our objective is not to claim a causal relationship. They are however, in most estimates, sizeable and highly significant. By contrast, the level of the fine set by the municipality does not seem to play a systematic role. One possible reason for this is that the announced fine by the municipality can only be credible if actually enforced, which is exactly what our estimations based on the perceived sanction are capturing.
The overall results suggest that a partial or selective ban of single-use plastic bags is not sufficient to change behavior. Rather, a successful plastic bags reduction program would hinge on a significant penalty, the effectiveness of which, in turn, would critically depend on the retailers’ and consumers’ perception of the probability of being caught in case of violation. The latter, the probability of being caught, depends on the means deployed to communicate to the general public that the ban has been put in place, as well as monitoring with the assistance of city police, and strict enforcement of fines when violations are detected (see also Laurian, Reference Laurian2003).
Our results also suggest that the Nepal Plastic Bags Control and Regulation Directive 2011 is not particularly effective and has to be more carefully designed and enforced at the municipality level. Since plastic is used not only in markets but also for packaging, an alternative instrument such as higher taxes on single-use plastics may also help to reduce their use and encourage substitutes. A possible policy, in this regard, would be to impose a tax on plastic bag use at retail points as is the case in the City of London (Smithers, 2016). However, the characteristics of the retail sector in Nepal, largely informal and under-regulated, present unique and special challenges such as non-cooperation or legal resistance. Alternatively, municipalities can, as suggested in the present study, develop stricter monitoring strategies for enforcing the ban. Finally, retailers are a key stakeholder in reducing the use of plastic bags, and understanding the determinants of their cooperation would contribute in a significant way towards a better designed policy.
Supplementary material
The supplementary material for this article can be found at https://doi.org/10.1017/S1355770X19000329
Acknowledgements
The authors gratefully acknowledge the financial support of the South Asian Network for Development and Environmental Economics (SANDEE) at the International Center for Integrated Mountain Development (ICIMOD) for conducting this research. Our special thanks go to SANDEE's advisers and associates for their guidance and valuable suggestions during several SANDEE bi-annual Research and Training Workshops. We would like to thank Celine Nauges, Priya Shyamsundar and E. Somanathan for their valuable suggestions and critical readings of the manuscript at earlier stages, and Mukti N. Subedi, Ravi Kiran Adhikari and Sailaza Basistha for their help in data collection. The views and interpretations of the results presented in this research are, however, those of the authors and should not be attributed to SANDEE-ICIMOD or their sponsors and affiliated organizations.
Appendix
Table A1. Summary statistics