


INTRODUCTION
Loess-paleosol sequences (LPS) reflect complex geo-ecological responses to climatic shifts across millennial and longer timescales, and provide quasi-continuous information relating to paleoenvironmental conditions during the Quaternary (e.g., Bronger, Reference Bronger1976; Dodonov and Baiguzina, Reference Dodonov and Baiguzina1995; Antoine et al., Reference Antoine, Rousseau, Moine, Kunesch, Hatté, Lang, Tissoux and Zöller2009; Sun et al., Reference Sun, An, Clemens, Bloemendal and Vandenberghe2010; Fitzsimmons et al., Reference Fitzsimmons, Marković and Hambach2012; Buggle et al., Reference Buggle, Hambach, Kehl, Marković, Zöller and Glaser2013; Zech et al., Reference Zech, Zech, Marković, Hambach and Huang2013; Marković et al., Reference Marković, Stevens, Kukla, Hambach, Fitzsimmons, Gibbard and Buggle2015; Sprafke, Reference Sprafke2016). LPS are widespread across the mid-latitudes and usually involve investigation of vertical exposures, which are assumed to be representative of the wider region.
Regional climate and geomorphic factors, as well as local topography, influence the development of LPS (Ruhe et al., Reference Ruhe, Daniels and Cady1967; Lehmkuhl et al., Reference Lehmkuhl, Zens, Krauss, Schulte and Kels2016). The presence of discontinuities and polygenetic units within LPS requires a reliable chronological framework combined with thorough genetic reconstructions of the interplay between aeolian deposition, pedogenesis, erosion, and colluviation (Sprafke et al., Reference Sprafke, Thiel and Terhorst2014; Sprafke, Reference Sprafke2016). Recent advances in luminescence dating have improved our ability to unravel complex terrestrial paleoclimatic archives such as LPS (Stevens et al., Reference Stevens, Thomas, Armitage, Lunn and Lu2007; Roberts, Reference Roberts2008; Thiel et al., Reference Thiel, Buylaert, Murray, Terhorst, Hofer, Tsukamoto and Frechen2011; Buylaert et al., Reference Buylaert, Jain, Murray, Thomsen, Thiel and Sohbati2012b; Jain et al., Reference Jain, Buylaert, Thomsen and Murray2015; Ankjærgaard et al., Reference Ankjærgaard, Guralnik, Buylaert, Reimann, Yi and Wallinga2016) by facilitating reliable correlations among units. The increasing application of luminescence-based chronostratigraphies highlights the pitfalls of the simplistic correlation of paleosols or parameter variations in LPS and their correlation with global to hemispheric paleoclimate records (Vandenberghe et al., Reference Vandenberghe, Renssen, van Huissteden, Nugteren, Konert, Lu, Dodonov and Buylaert2006; Rousseau et al., Reference Rousseau, Antoine, Kunesch, Hatté, Rossignol, Packman, Lang and Gauthier2007; Schirmer, Reference Schirmer2012; Li et al., Reference Li, Song, Lai, Han and An2016b). Most reliable correlations appear possible at loess plateaus with largely horizontal units (Kukla et al., Reference Kukla, An, Melice, Gavin and Xiao1990; Ding et al., Reference Ding, Derbyshire, Yang, Yu, Xiong and Liu2002a; Marković et al., Reference Marković, Stevens, Kukla, Hambach, Fitzsimmons, Gibbard and Buggle2015), or at records created by large amounts of windblown dust (Antoine et al., Reference Antoine, Rousseau, Moine, Kunesch, Hatté, Lang, Tissoux and Zöller2009). However, even in these exceptional settings this approach needs to be applied with caution (Stevens et al., Reference Stevens, Thomas, Armitage, Lunn and Lu2007). The rule to these exceptional settings are complex LPS, with their distribution and completeness largely depending on the topographical position.
To date, continental scale correlations of LPS across Eurasia that involve Central Asian records have mainly relied on pedostratigraphy (Bronger, Reference Bronger2003). Further large-scale approaches have been limited to regions with an established array of published records, such as in the Chinese Loess Plateau (CLP) or southeast Europe (Marković et al., Reference Marković, Stevens, Kukla, Hambach, Fitzsimmons, Gibbard and Buggle2015, Reference Marković, Fitzsimmons, Sprafke, Gavrilovic, Smalley, Jovic, Svircev, Gavrilov and Beslin2016). The lack of long, investigated records from the intervening locations in Central Asia (Fig. 1A) is noteworthy. This lack of correlative data exists despite the widespread presence of loess deposits along the margins of the high mountain systems extending from Iran to Mongolia, with some deposits exceeding 100 m in thickness (Dodonov, Reference Dodonov1991; Dodonov and Baiguzina, Reference Dodonov and Baiguzina1995; Bronger et al., Reference Bronger, Winter and Sedov1998b; Ding et al., Reference Ding, Ranov, Yang, Finaev, Han and Wang2002b; Dodonov et al., Reference Dodonov, Sadchikova, Sedov, Simakova and Zhou2006; Li et al., Reference Li, Song, Yan, Chen and An2015). The limited amount of scientific studies in the region, and a distinct spatiotemporal pattern of aeolian dynamics (Smalley et al., Reference Smalley, Mavlyanova, Rakhmatullaev, Shermatov, Machalett, Dhand and Jefferson2006), has resulted in a lack of consensus about the spatial pattern of climatic and geomorphic changes across the region (Machalett et al., Reference Machalett, Oches, Frechen, Zöller, Hambach, Mavlyanova, Marković and Endlicher2008; Song et al., Reference Song, Chen, Qian, Li, Li, Li, Chang and An2014; Kang et al., Reference Kang, Wang, Lu, Liu, Song and Wang2015; Li et al., Reference Li, Song, Yan, Chen and An2015, Reference Li, Rao, Duan, Xia, Wang, Madsen and Jia2016a; Vlaminck et al., Reference Vlaminck, Kehl, Lauer, Shahriari, Sharifi, Eckmeier, Lehndorff, Khormali and Frechen2016; Lauer et al., Reference Lauer, Vlaminck, Frechen, Rolf, Kehl, Sharifi, Lehndorff and Khormali2017; Fitzsimmons et al., Reference Fitzsimmons, Sprafke, Zielhofer, Günter, Deom, Sala and Iovitain press). The growing number of publications related to the terrestrial paleoclimatic records of the Tian Shan piedmont (Fig. 1B) indicates an increasing scientific attention to this region located at the intersection of major climate drivers (i.e., westerlies, Asian monsoon systems, polar northerlies; Fig. 1A).
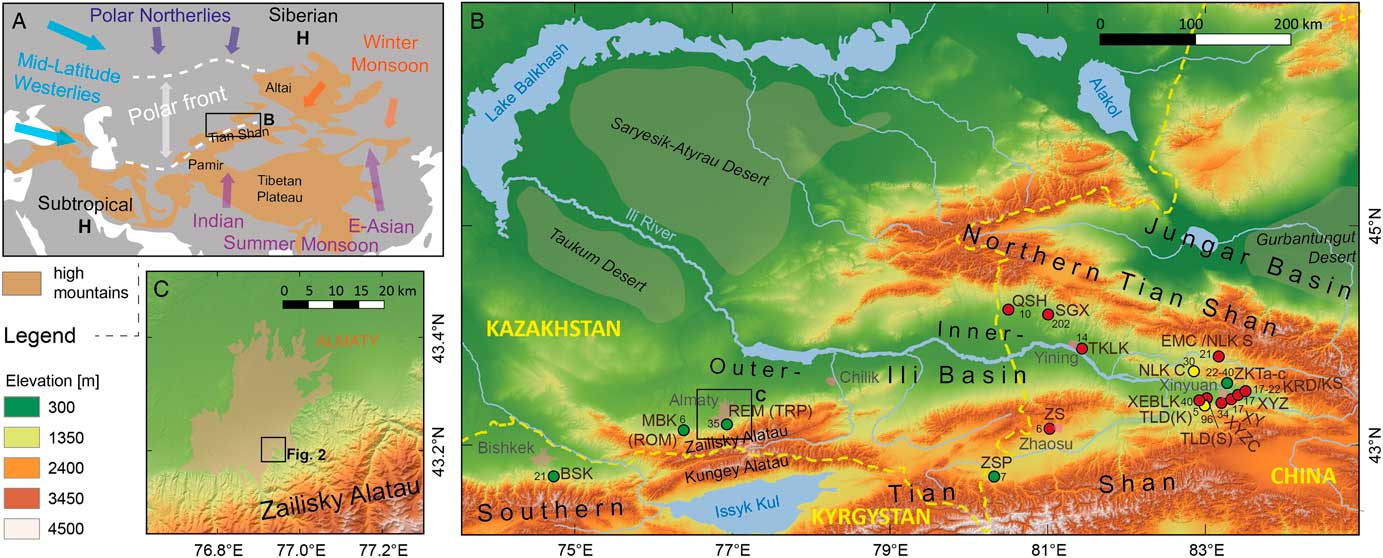
Figure 1 Geographic context of the LPS Remizovka. (A) Simplified map of Central Asia and surrounding regions illustrating the location of the Tian Shan piedmont LPS, at the intersection of important climate subsystems (cf. Machalett et al., Reference Machalett, Oches, Frechen, Zöller, Hambach, Mavlyanova, Marković and Endlicher2008; Kang et al., Reference Kang, Wang, Lu, Liu, Song and Wang2015). (B) Locations and depths of LPS within the Ili-Balkhash catchment. Compiled from our own data and various references (Chen et al., Reference Chen, Liu, Heller, Hirt, Lu, Guo and Mao2012; E et al., Reference E, Lai, Sun, Hou, Yu and Wu2012; Song et al., Reference Song, Li, Zhao, Cheng and Zeng2012, Reference Song, Chen, Qian, Li, Li, Li, Chang and An2014; Youn et al., Reference Youn, Seong, Choi, Abdrakhmatov and Ormukov2014; Kang et al., Reference Kang, Wang, Lu, Liu, Song and Wang2015; Song et al., Reference Song, Lai, Li, Chen and Wang2015; Li et al., Reference Li, Rao, Duan, Xia, Wang, Madsen and Jia2016a,Reference Li, Song, Lai, Han and An2016b). Due to missing or imprecise coordinates for several sites, three precision confidence classes are shown (red,= low; yellow=intermediate; green=high). Red signatures indicate information from sketch maps. For more information, refer to the .kmz-file provided in the supplementary information. (C) Topographic context of the Remizovka loess hill within the city of Almaty in the Zailisky Alatau (Southern Tian Shan) piedmont hills. (For interpretation of the references to color in this figure legend, the reader is referred to the web version of this article.)
The classic model of loess formation for the region involves glaciofluvial transport of mountain sediments into the desert basins to the north, and the aeolian entrainment and transport of silt particles back to the foothills (Smalley and Krinsley, Reference Smalley and Krinsley1978; Dodonov, Reference Dodonov1991). Comparisons with other regional paleoclimatic records suggest that the landscape change in the region is strongly driven by moisture availability. This includes glacial advance during wetter conditions, which facilitated loess generation (Koppes et al., Reference Koppes, Gillespie, Burke, Thompson and Stone2008; Owen and Dortch, Reference Owen and Dortch2014). This response diverges from the mid-latitude model of loess deposition being mainly related to cold temperatures. Consequently, the utility of loess deposits as unambiguous responses to global paleoclimate shifts, and the scarcity of other, unambiguous paleoclimatic records in the region, highlights the need for detailed studies on local LPS.
Large-scale loess maps in the literature that cover Central Asia (Machalett et al., Reference Machalett, Frechen, Hambach, Oches, Zöller and Marković2006; Song et al., Reference Song, Li, Zhao, Cheng and Zeng2012) indicate the approximate regional extent of these deposits. The variability in distribution and thickness of loess deposits along the piedmont, and the influence of pre-existing topography on loess accumulation, is unclear. Piedmont loess deposits may be (1) blankets covering the preexisting topography, i.e., fluvial dissected foothills; (2) small loess plateaus dissected by high gradient streams and alluvial fans; and/or (3) in very rare cases positive landforms created by preferential dust deposition or erosion. Studies of vertical profiles must verify firsthand the internal structure of the deposits. Only then can paleoclimatic conditions and regional aeolian dust mass accumulation rates reliably be calculated.
In this paper, we present data from a loess section at Remizovka in southeastern Kazakhstan. This site is a >100 m wide section cut through a piedmont loess hill in the southern suburbs of Almaty (Fig. 1C) and our work represents a case study for the importance of understanding the landscape context of terrestrial paleoclimatic archives. Published studies of the site (Machalett et al., Reference Machalett, Frechen, Hambach, Oches, Zöller and Marković2006, Reference Machalett, Oches, Frechen, Zöller, Hambach, Mavlyanova, Marković and Endlicher2008; Fitzsimmons et al., Reference Fitzsimmons, Sprafke, Zielhofer, Günter, Deom, Sala and Iovitain press), also known as Tramplin (Feng et al., Reference Feng, Ran, Yang, Zhai, Wang, Zhang and Huang2011; Ran and Feng, Reference Ran and Feng2014), have yielded contradictory results relating to its chronology, stratigraphy, and paleoenvironmental implications (see section The LPS Remizovka). In order to reconcile these disparate datasets, we undertook a detailed study of two prominent paleosols at the site. Their distinct paleotopography and a detailed investigation of the present site topography provides the missing link to integrate previous results. Our interpretations provide further paleoenvironmental conclusions and form the basis for future investigations on this potential key paleoclimatic archive for the wider region. Finally, we discuss the implications of our study with respect to the influence of local topography on the formation of LPS.
REGIONAL SETTING
Loess records along the Tian Shan range front
Relatively few terrestrial paleoclimatic records have been studied in Central Asia, as compared to Europe or China. Substantial areas of this region are marked by large temperate (semi-) deserts that are still not easy accessible, for both geographical and political reasons. In their study of the LPS Remizovka, Machalett et al. (Reference Machalett, Oches, Frechen, Zöller, Hambach, Mavlyanova, Marković and Endlicher2008) highlighted the importance of paleoclimatic studies within this region, because it lies at the intersection of major climatic subsystems (Fig. 1A).
Grain size variations from continuously sampled LPS in the wider region have been interpreted to reflect the dominant influence of the Westerlies in the Pamir (Vandenberghe et al., Reference Vandenberghe, Renssen, van Huissteden, Nugteren, Konert, Lu, Dodonov and Buylaert2006) and Tian Shan loess deposits (Li et al., Reference Li, Song, Lai, Han and An2016b). Furthermore, the extreme continental climate with hot summers and cold winters results in large annual north-south shifts of the polar front (Fig. 1A). Machalett et al. (Reference Machalett, Oches, Frechen, Zöller, Hambach, Mavlyanova, Marković and Endlicher2008) reconstructed variations in the extent of polar front oscillations during the Late Pleistocene from the LPS Remizovka in the Zailisky Alatau foothills of the northern Tian Shan. To date, studies on Central Asian LPS exist largely independent of each other and only recently have attempts been made to investigate the timing and mechanisms responsible for silt production and deposition along the Tian Shan range front as a whole (Li et al., Reference Li, Song, Yan, Chen and An2015, Reference Li, Rao, Duan, Xia, Wang, Madsen and Jia2016a; Fitzsimmons et al., Reference Fitzsimmons, Sprafke, Zielhofer, Günter, Deom, Sala and Iovitain press).
Several recent studies published from LPS in the eastern (Chinese) part of the Ili Basin (Fig. 1B) provide evidence for variable peak dust accumulation rates during marine isotope stage (MIS) 4 to early MIS 3 (Li et al., Reference Li, Rao, Duan, Xia, Wang, Madsen and Jia2016a), middle MIS 3 (Song et al., Reference Song, Lai, Li, Chen and Wang2015), and especially during MIS 2 (Li et al., Reference Li, Song, Lai, Han and An2016b). This variability strongly suggests a need to reconsider the spatiotemporal variations of dust deposition in higher detail before general paleoclimatic conclusions can be drawn. Crossing the border westwards into Kazakhstan, there is only a handful of international publications available from the Tian Shan piedmont loess (Machalett et al., Reference Machalett, Frechen, Hambach, Oches, Zöller and Marković2006; Machalett et al., Reference Machalett, Oches, Frechen, Zöller, Hambach, Mavlyanova, Marković and Endlicher2008; Feng et al., Reference Feng, Ran, Yang, Zhai, Wang, Zhang and Huang2011; Ran and Feng, Reference Ran and Feng2014; Fitzsimmons et al., Reference Fitzsimmons, Sprafke, Zielhofer, Günter, Deom, Sala and Iovitain press). These studies likewise contain contradictory information. In most of these publications, not only the regional geomorphic context (Fig. 1B), but also the local scale (paleo)topography remained overlooked in the interpretation of continental scale paleoclimatic records present in the LPS.
Although no detailed maps of loess distribution and thickness exist for the Zailisky Alatau range front, our own field observations indicate that loess is not distributed continually along its length. Instead, loess deposits are partly interlayered by mountain debris. Only rarely do pure aeolian silt deposits in this area reach sufficient thickness for meaningful paleoclimatic studies (Sprafke and Obreht, Reference Sprafke and Obreht2016). As reported for the Ili basin (Song et al., Reference Song, Chen, Qian, Li, Li, Li, Chang and An2014), thick loess deposits along the Zailisky Alatau are located in various morphological positions, including sediment drapes on the foothills (e.g., Remizovka), in areas infilling mountain valleys (e.g., Maibulak), and as blankets of variable thickness on the plains in front of the range (e.g., along the highway westward from Almaty).
The active seismic setting of the Zailisky Alatau further complicates the pattern of loess distribution. The Zailisky Alatau is bound by a range front fault to the north, along which the mountains have overridden the foreland sediments. The fault’s slip rate is not well established. In the easternmost part of the range front near Chilik, Selander et al. (Reference Selander, Oskin, Ormukov and Abdrakhmatov2012) estimated a slip rate of 0.8±0.5 mm/yr and 0.43±0.3 mm/yr for two parallel faults, respectively. Apart from this main fault, several smaller faults of unknown activity are reported from Almaty and adjacent areas (e.g., Atrushkevitch et al., Reference Atrushkevitch, Kalabaev, Kartashov, Lototsky and Ostropico1988; Delvaux et al., Reference Delvaux, Abdrakhmatov, Lemzin and Strom2001), but no surface rupturing earthquakes are known for areas close to the study area. Severe earthquakes affecting the city of Almaty in the 19th and 20th century resulted from more distant epicenters or did not leave surface ruptures (Tatevossian, Reference Tatevossian2007; Abdrakhmatov et al., Reference Abdrakhmatov, Walker, Campbell, Carr, Elliott, Hillemann and Hollingsworth2016; Landgraf et al., Reference Landgraf, Dzhumabaeva, Abdrakhmatov, Strecker, Macaulay, Arrowsmith, Sudhaus, Preusser, Rugel and Merchel2016).
The LPS Remizovka
In this paper, we address problems relating to the study of complex terrestrial paleoclimatic archives preserved in the Tian Shan piedmont loess, using the case study of Remizovka, the thickest known LPS of the Kazakh Tian Shan piedmont. This site has already been studied in detail (Machalett et al., Reference Machalett, Frechen, Hambach, Oches, Zöller and Marković2006; Machalett et al., Reference Machalett, Oches, Frechen, Zöller, Hambach, Mavlyanova, Marković and Endlicher2008; Feng et al., Reference Feng, Ran, Yang, Zhai, Wang, Zhang and Huang2011; Fitzsimmons et al., Reference Fitzsimmons, Sprafke, Zielhofer, Günter, Deom, Sala and Iovitain press). It is located at ca. 1040 m above sea level (asl) on a north-northwest striking spur within piedmont hills along the southern margins of Almaty (Fig. 1C and 2). The hill is widely known for the modern ski jump facilities (Russian: tramplin) at the northern slope.

Figure 2 (color online) Topography of the Remizovka loess hill. (A) Digital elevation model (DEM) based on the Pléiades dataset, locations of cross sections (Fig. 2D and E), and characteristic features visible in Fig. 2B. (B) Corona declassified satellite image from 1969. (C) Three-dimensional visualization of the loess hill based on the DEM and location of the profiles from previous works and this study. (D and E) Cross sections along the transects marked in Fig. 2A and B, including specific features and reconstruction of the topography before quarrying.
The present climate of Almaty is strongly continental. Mean annual precipitation and temperature are 580–680 mm and 8.5–10.0°C, respectively, depending on data source (Machalett et al., Reference Machalett, Frechen, Hambach, Oches, Zöller and Marković2006; Weather and Climate, 2017), observation period, and altitude. Very cold winters and hot summers, and a precipitation maximum in spring and a secondary peak in autumn are typical. There is an altitudinal gradient from the semi-desert (< 600 m asl) to steppe and shrub-steppe within the piedmont hills to the forest zone above ca. 1200 m asl.
Urban development along the southern margins of the city over the last few decades has resulted in substantial anthropogenic transformations at the Remizovka site (Fig. 2 and 3). Quarrying and the construction of ski jump facilities led to an exposure of several outcrops on different levels (Fig. 3 and 4A), including a ca. 30 m high loess exposure at the hilltop (Fig. 4B) and several outcrops at a lower level (Fig. 4A and 4C). Since 2015, the additional construction of a racing track below the main cliff and around the hill has removed the outcrops at the lower levels (Fig. 4D) and left only the main outcrop accessible for study (Fig. 4E and F, Fig. 5).
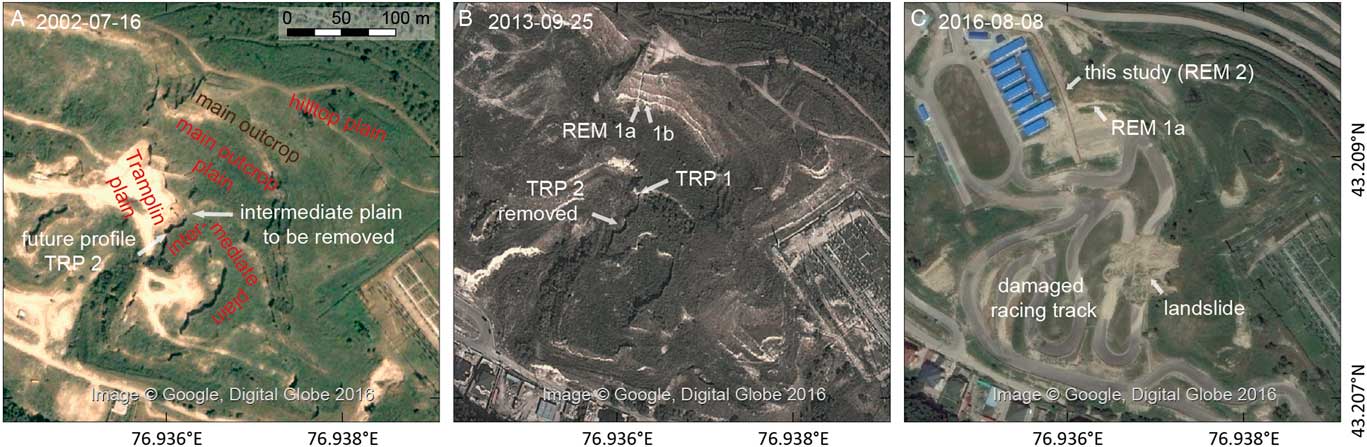
Figure 3 (color online) Human-induced changes to the Remizovka loess hill, as documented by pictures available on Google Earth. (A) Situation of the loam quarry in 2002, before the start of investigations. (B) Situation in 2013, with the profiles in the main section (REM 1a and b) and TRP 1. TRP 2 has already been removed by loam quarrying between 2010–2012. (C) Situation in 2016, with the location of the profile studied herein (REM 2). Note the loss of most sections below the main outcrop wall due to the construction of a racetrack and destruction caused by the collapse of disturbed loess material during heavy rains in spring 2016. For the full documentation refer to the complete set of images available on Google Earth.

Figure 4 (color online) Photos from the past (A-C) and present (D-F) outcrops at Remizovka. (A) Panorama photo from the Tramplin plain (ca. 2004) created from archival photography (S. Nigmatova). Note that the main outcrop plain and the majority of the main outcrop are not visible due to the perspective. The location of the two TRP profiles (1, 10.5 m thick; 2, 6.4 m thick) is marked. Note the dipping of a well-developed paleosol along the outcrop, most likely the MIS 5e paleosol. (B) Photo of the main outcrop in 2004 (S. Nigmatova) studied by Machalett et al. (Reference Machalett, Frechen, Hambach, Oches, Zöller and Marković2006). The long REM 1a profile is complemented by profile REM 1b a few meters to the right. (C) TRP 1 section (studied as Tramplin profile by Nigmatova, Reference Nigmatova2009; Feng et al., Reference Feng, Ran, Yang, Zhai, Wang, Zhang and Huang2011; Ran and Feng, Reference Ran and Feng2014; most likely the middle part of synthetic profile by Machalett et al., Reference Machalett, Frechen, Hambach, Oches, Zöller and Marković2006). (D) Overview in June 2016 (cf. Fig. 3C). The studied sections are located behind the blue roof on the left hand side of the photo. (E) Detail of D, showing the dipping of the two well-developed paleosols to the west. (F) Studied section including the two well-developed paleosols and the complementary profiles REM 2a–c (Fig. 5).
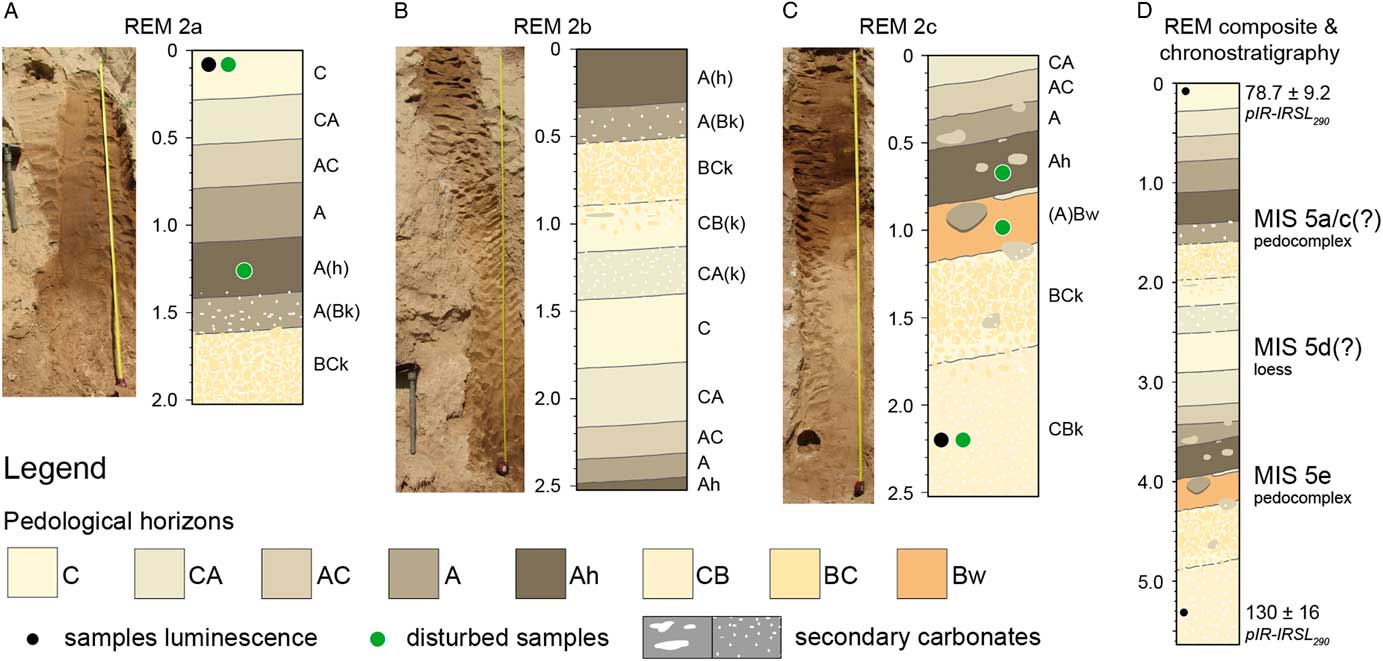
Figure 5 (color online) Field interpretations of the studied profiles and sampling positions: (A) REM2a, (B) REM2b, (C) REM 2c, and (D) composite sequence. Classification and legend based on FAO (2006) and Sprafke (Reference Sprafke2016).
Machalett et al. (Reference Machalett, Frechen, Hambach, Oches, Zöller and Marković2006) estimated the thickness of the Remizovka section at 70–80 m, based on the composite stratigraphy (cf. Fig. 6A and 7) of three outcrops exposed at different altitudes down the loess hill, which overlies gravels. A photograph by Machalett et al. (Reference Machalett, Oches, Frechen, Zöller, Hambach, Mavlyanova, Marković and Endlicher2008) documents the upper part of this composite LPS, a 28.5 m thick profile dug into the main outcrop (Fig. 4B), and analyzed in 10 cm resolution for granulometric variations and ratios; these data were then interpreted as paleoclimatic proxies (Fig. 6A). According to Machalett et al. (Reference Machalett, Frechen, Hambach, Oches, Zöller and Marković2006), the entire LPS Remizovka covers more than seven glacial-interglacial cycles, correlating with long records in western Central Asia and China. However, non-fading-corrected feldspar infrared stimulated luminescence (IRSL) ages from the composite section never exceeded 100 ka.

Figure 6 (color online) Compilation of profiles with simplified stratigraphies following a standardized legend, together with published and new data and their possible correlations. (A) Synthetic profile (redrawn from Machalett et al. Reference Machalett, Frechen, Hambach, Oches, Zöller and Marković2006) with grain size data and correlation to marine isotope stages (redrawn from Machalett et al. Reference Machalett, Oches, Frechen, Zöller, Hambach, Mavlyanova, Marković and Endlicher2008). (B) TRP 1 section with multiproxy dataset redrawn from Feng et al. (Reference Feng, Ran, Yang, Zhai, Wang, Zhang and Huang2011) and Ran and Feng (Reference Ran and Feng2014). Note the more detailed revised stratigraphy based on reinterpretation of the published data. (C) Upper part of REM 1a with color, magnetic susceptibility, and luminescence ages modified from Fitzsimmons et al. (in press). (D) New composite profile REM 2 (cf. Fig. 5) with luminescence ages. (E) Correlation of TRP 1 with composite profile REM 2.
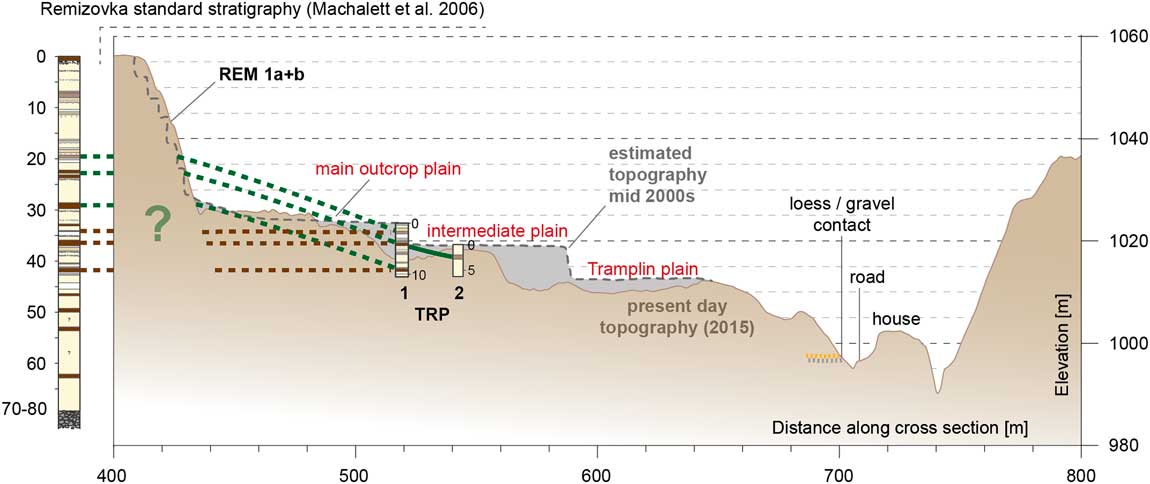
Figure 7 (color online) Detail of transect B-B’ (cf. Fig. 2) and relation between previously studied profiles. The conceptual model of plateau-like dust deposition at Remizovka (with later fluvial incision) leads to the assumption that TRP 1 represents the second part of the composite profile Remizovka (Machalett et al. Reference Machalett, Frechen, Hambach, Oches, Zöller and Marković2006; red dashed lines). Our scenario (green dashed lines) involves a hilly paleotopography, with TRP 1 correlating to the lower part of REM 1 (and with its upper half to REM 2, studied by us). (For interpretation of the references to color in this figure legend, the reader is referred to the web version of this article.)
Feng et al. (Reference Feng, Ran, Yang, Zhai, Wang, Zhang and Huang2011) worked on the 10.5 m thick Tramplin subsection on the mid-slope of the hill (Fig. 4A and C). Together with the study by Ran and Feng (Reference Ran and Feng2014), a multiproxy dataset (Fig. 6B) and radiocarbon dates on snails and organic matter, ranging between ~32–46 cal ka BP, were published. In a palynological study of the same profile, Nigmatova (Reference Nigmatova2009) detected numerous steppe species related to well-developed buried soils.
Fitzsimmons et al. (Reference Fitzsimmons, Sprafke, Zielhofer, Günter, Deom, Sala and Iovitain press) worked on the upper 8 m of the trench dug into the main outcrop (Machalett et al., Reference Machalett, Oches, Frechen, Zöller, Hambach, Mavlyanova, Marković and Endlicher2008; Fig. 4B). Their stratigraphic data, based on color variations, correlates well to the features described previously, and their luminescence ages indicate an age of <35 ka for the upper 8 m of the profile (Fig. 6C). The new dataset supersedes the older, non-fading-corrected IRSL chronology of Machalett et al. (Reference Machalett, Frechen, Hambach, Oches, Zöller and Marković2006) but lies well within error of two radiocarbon dates from this section (Machalett et al., Reference Machalett, Oches, Frechen, Zöller, Hambach, Mavlyanova, Marković and Endlicher2008).
After 10 years of research on the Remizovka loess hill, human activities seriously threaten the unique outcrop (Fig. 3C and 4D), demanding detailed studies and, in the best case, preservation as a geologic heritage (Vasiljević et al., Reference Vasiljević, Marković, Hose, Ding, Guo, Liu, Smalley, Lukić and Vujičić2014). Our field evidence indicates that two well-developed paleosols in the lower part of the main wall studied by us are not horizontal, but rather follow a distinct paleotopography (Fig. 4). In this paper, we aim to reconcile the previous works at this site by examining it in three-dimensional space, so as to better understand the role of local topography in the formation of this LPS.
METHODS
Field investigation and sampling
Access to the Remizovka loess hill in June 2016 enabled field observations and initial sampling. We traced two prominent pedocomplexes along the main outcrop (Fig. 4E and F). These are located between 22–24 m depth below the hilltop according to the profile of Machalett et al. (Reference Machalett, Oches, Frechen, Zöller, Hambach, Mavlyanova, Marković and Endlicher2008). Due to the short time of access allowed by the authorities, we could only dig three shallow profiles to expose the two paleosols and parts of the overlying and underlying sediments (Fig. 4F and 5).
Soil descriptions followed pedological designations (FAO, 2006) after Sprafke (Reference Sprafke2016), and previously applied to the upper 8 m of the LPS Remizovka (Fitzsimmons et al., Reference Fitzsimmons, Sprafke, Zielhofer, Günter, Deom, Sala and Iovitain press). All sampling locations are shown in Figure 5. Two luminescence samples, taken to bracket the two paleosols, were collected in duplicate within lightproof tubes driven horizontally into the loess section. Additional material from the in situ sediment surrounding the tube samples was collected in sealed plastic bags for dose rate and moisture content determination and further analyses. In addition, three samples were taken from the most developed paleosol horizons.
Grain size and color analyses
Representative parts of the five disturbed samples were air-dried and sieved to fine earth (<2 mm). A ColorLite sph850 spectrophotometer (3.5 mm measuring field, D65 light source, 10° observation angle) determined the diffuse reflection spectrum (3.5 nm resolution, 400–700 nm), which is converted to variables of the CIELAB color space and visualized as RGB colors (Sprafke, Reference Sprafke2016; Fitzsimmons et al., Reference Fitzsimmons, Sprafke, Zielhofer, Günter, Deom, Sala and Iovitain press).
A Malvern Mastersizer 2000 Hydro S (refraction index 1.52, stirring speed of 2100 rpm, average of three 12 s measurements) was used to determine the grain size distribution (104 classes, size range of 0.2–2000 μm). Before measuring, each sample (1.5 g) was mechanically split, using a rotary sample divider, until required obscuration was achieved.
Luminescence dating
Luminescence samples were processed at the Max Planck Institute for Evolutionary Anthropology, Leipzig (MPI-EVA), under filtered red light conditions and using the same approach as applied to samples from the upper parts of this section by Fitzsimmons et al. (Reference Fitzsimmons, Sprafke, Zielhofer, Günter, Deom, Sala and Iovitain press). Published protocols were used to extract the fine-grained polymineral fraction of the samples for dating (Frechen et al., Reference Frechen, Schweitzer and Zander1996). From each sample, 18 aliquots were delivered by pipette onto stainless steel discs. Aliquots were measured for equivalent dose (De) on a Risø TL-DA-20 reader with D410 filters to detect the feldspar signal, using the post-infrared-infrared (pIR-IR290) protocol (Buylaert et al., Reference Buylaert, Jain, Murray, Thomsen, Thiel and Sohbati2012a) to access the stable feldspar signal. Resulting De values were interpolated from exponential and linear fitting of the dose-response curves.
The luminescence samples appeared to respond well to the measurement protocols. No aliquots had reached saturation; for all aliquots, pIR290 signals were bright; recycling ratios were within 5% of unity; sensitivity change lay within 30% of unity; residual dose was <1%. The Central Age Model (Galbraith et al., Reference Galbraith, Roberts, Laslett, Yoshida and Olley1999) was used to calculate the De for each sample, since dose distributions were Gaussian in both cases (Supplementary Figure 1). Fading measurements following published guidelines (Auclair et al., Reference Auclair, Lamothe and Huot2003; Thiel et al., Reference Thiel, Horváth and Frechen2014) yielded fading rates (g2days) below 1.5%/decade and comparable with published investigations into the pIR290 signal (Buylaert et al., Reference Buylaert, Jain, Murray, Thomsen, Thiel and Sohbati2012a; Thiel et al., Reference Thiel, Horváth and Frechen2014), which indicate minimal fading. We did not correct the ages reported in Table 1.
Table 1 Color and granulometric data of selected horizons within the studied sequence. For the full data set, please refer to the supplementary information.
Environmental radiation dose rates for beta and gamma components were derived from beta counting at the MPI-EVA, and high-resolution germanium gamma spectrometry undertaken at the Felsenkeller, VKTA Dresden, respectively. Published attenuation factors (Adamiec and Aitken, Reference Adamiec and Aitken1998), modelled moisture contents, and alpha-values of 0.12±0.02 (Rees-Jones and Tite, Reference Rees-Jones and Tite1997), were used to correct the beta and gamma components of the dose rate. Long-term moisture contents were modelled by taking into account in situ and saturation water content of those samples, as well as the in situ water content of the loess samples from the upper part of the profile (Fitzsimmons et al., Reference Fitzsimmons, Sprafke, Zielhofer, Günter, Deom, Sala and Iovitain press), with respect to the likely periods of time over which different degrees of saturation were likely to prevail. A large uncertainty was incorporated to account for variability in moisture content through time. Cosmic ray contributions to the total dose rate were calculated based on published formulae (Prescott and Hutton, Reference Prescott and Hutton1994).
GIS analyses of DEMs
We used stereo Pléiades satellite imagery (November 2014) with a spatial resolution of 0.5 m to produce a high-resolution digital elevation model (DEM) of the study area. Stereo panchromatic photographs from the Pléiades platform capture the same area on the ground from two different angles which allows to reconstruct the three-dimensional geometry of the terrain (de Lussy et al., Reference de Lussy, Kubik, Greslou, Pascal, Gigord and Cantou2005). Data processing was undertaken with commercial software (ERDAS Imagine). The resulting DEM has a resolution of 1.5 m and was processed with standard GIS techniques to compute slope and hillshade. As reference for absolute altitudes and for the overview maps (Fig. 1B and C) we used NASA SRTM1 data (2000) with a horizontal ground resolution of 30×30 m.
Archival photos and historic satellite images of Google Earth® and Corona
To reconstruct the approximate positions of the previously studied profiles below the main outcrop, we referred to archival photos of co-author S. Nigmatova (summer 2004) and R. Iovita (summer 2013). In addition, using the Google Earth software, 33 satellite images from between 2002 and 2016 are available for comparison. Due to the steep slopes and different angles of observation, the georeferencing of Google Earth images is only approximate. Using ERDAS Imagine, we georeferenced several images in the best way available to document the history of loam quarrying, construction, and thus the conditions for previous scientific investigations. For comparison, a declassified monochromatic Corona KH-4B surveillance satellite photograph (ca. 1.8 m resolution) from 1969 is added to the time series (cf. Narama et al., Reference Narama, Kaab, Duishonakunov and Abdrakhmatov2010), to show the degree of least disturbance documented from the site.
RESULTS AND DISCUSSION
Investigations undertaken for this study address the contradictory results of previous studies. As our data link disparate chronostratigraphies, we discuss both our data and the reconstruction of past work together by (1) reconstructing the precise location of the previous studies, and how these specific sites may have been altered or removed from the exposure through construction activities; (2) investigating in detail the two pedocomplexes that serve as marker horizons along the main exposure face; (3) correlating the previously published stratigraphies to one another and to our data, so as to create a unified dataset; and (4) reconstructing the local topographic and environmental development of the Remizovka loess hill to understand how local paleotopographic conditions and processes may influence a loess paleoenvironmental archive. We will also reflect on the regional and methodological implications of this study.
Local topography and LPS exposure through time
Despite the relatively poor image quality, the Corona KH-4B image from 1969 (Fig. 2B) serves its purpose to evaluate the original topography before the period of significant quarrying activities (Fig. 2D and E). The Remizovka loess hill in 1969 had a topography comparable to the hill immediately to the south. Both formed spurs striking SE to NW, dissected by a valley. The slopes of the separated hills are asymmetric, with steeper north-facing slopes and gentler south-facing slopes dissected by small valleys (Fig. 2A and B).
Over 30 Google Earth images provide detailed information relating to human-induced changes on the Remizovka loess hill over the last 16 years (cf. Fig. 3). The satellite image from 2002 (Fig. 3A) shows the topography resulting from loess quarrying, prior to any known scientific investigation (e.g., Machalett et al., Reference Machalett, Frechen, Hambach, Oches, Zöller and Marković2006; Feng et al., Reference Feng, Ran, Yang, Zhai, Wang, Zhang and Huang2011). One main outcrop wall and a few lower terraces are visible. In the following, we refer to these sites by the names given in Figure 3 (cf. Fig. 4). For all profiles, we use the names introduced in Figure 2 (cf. Fig. 4).
Archival photos by S. Nigmatova (Fig. 4A–C) document a field campaign during 2004, including the profiles dug into the Tramplin outcrop (TRP 1 and 2) and the main outcrop (REM 1). Machalett et al. (Reference Machalett, Oches, Frechen, Zöller, Hambach, Mavlyanova, Marković and Endlicher2008) produced a photo of the main outcrop (their Fig. 4b, cf. Fig. 4B herein), with a 28.5 m thick profile (REM 1a) extending from the hilltop. An additional small profile (REM 1b) is exposed a few meters to the right.
Google Earth imagery shows that quarrying between 2010–2012 removed a >6 m thick loess profile. This profile was not studied in detail (TRP 2; cf. Supplementary Fig. S2). The >10 m high TRP 1 trench, ca. 35 m to the north and studied by Feng et al. (Reference Feng, Ran, Yang, Zhai, Wang, Zhang and Huang2011) together with S. Nigmatova, and most likely by Machalett et al. (Reference Machalett, Frechen, Hambach, Oches, Zöller and Marković2006), is still visible on the satellite image from 2013 (Fig. 3B) and an archival photo from the same year (Supplementary Figure 3). One year later, the construction of the racing track had removed most profiles below the main outcrop. Landslides during heavy rains in spring 2016 mainly removed loess sediments disturbed or relocated by human activities, causing severe damage to the racing track (Fig. 3C and 4D).
The Pléjades DEM (Fig. 2) provides unprecedented topographic detail and precision, albeit only for the date of measurement (November 2014). The DEM does not show the prominent terraces below the main wall, which were still visible on Google Earth imagery from early summer 2014, but absent by early summer 2015. This indicates that the substantial modification of the topography for the construction of the racing track had already started in summer/autumn 2014.
Figures 2 and 7 show topographic features and reconstructed topographies from 1969 and the mid-2000s, respectively, combining the data from the DEM derived cross sections and visual interpretation of aerial imagery. The hilltop plain is leveled, but the almost completely preserved steppe soil in the top of REM 1a (Machalett et al., Reference Machalett, Frechen, Hambach, Oches, Zöller and Marković2006) indicates that minimal material was removed overall. The contact between loess and underlying gravels could be observed at different altitudes along the road in the valley south of the Remizovka loess hill (Fig. 2C–E). The precise altitudes of the profiles below the main wall remain unclear and are approximated in the best way possible from the available images (Fig. 2–4, 7).
Properties and age of the two pedocomplexes in REM 2
Two highly visible paleosols from the lower part of the main outcrop (ca. 22–24 m below the hilltop in profile REM 1a) dip westwards. We investigated these at an outcrop (REM 2) where they are exposed at eye level from the main outcrop plain (Fig. 4E and F). Due to the steep dip angle, the outcrop was studied in three short subsections (REM 2a–c) that encompass the two paleosols.
Figure 5 shows profile photos, a pedological description, and a composite profile. The loess sediments below the lower pedocomplex are slightly darker and more structured (subpolyhedral) than typical primary loess and are visibly enriched in secondary carbonates (primarily pseudomycelia; BCk/CBk-horizons). The lower paleosol has a dark brown Ah-horizon and a brown Bw-horizon with a sharp lower boundary. The Ah-horizon grades into a 1 m thick package of partly humic loess with a gradual transition to well-structured (subpolyhedral) and more clayey loess, often with light-colored silty substrate between aggregates (CBk/BCk). This horizon is directly below the upper humic paleosol (A[h] horizon), which is lighter in color than the Ah-horizon of the lower pedocomplex. The transition to the overlying loess is gradual. As both of the well-structured BCk horizons are found below well-developed paleosols, we interpret both packages to be pedocomplexes.
Color data support the pedologic classifications made above (Table 1). Soil horizons yield low L* (lightness) values, and the brown horizon the highest a* (redness) and b* (yellowness) values. The quantitative color data from the underlying and overlying loess horizons appear comparable to the primary loess sediments at the top of REM 1a (Fitzsimmons et al., Reference Fitzsimmons, Sprafke, Zielhofer, Günter, Deom, Sala and Iovitain press). Although these were measured with a different spectrophotometer, it was from the same manufacturer; experience suggests that color values measured with different devices cannot necessarily be compared in absolute terms despite appropriate calibration.
Granulometric measurements indicate that clay content (<2 µm) is highest in the basal CBk-horizon (Table 1). This may be the result of post-depositional clay formation or fine carbonate impregnation. Taking into account that laser diffraction methods have difficulties in determining clay contents, some researchers suggest alternative upper boundaries for the clay fraction of 4.6 µm (Antoine et al., Reference Antoine, Rousseau, Moine, Kunesch, Hatté, Lang, Tissoux and Zöller2009) or even up to 8 µm (Konert and Vandenberghe, Reference Konert and Vandenberghe1997). These would effectively reduce the relative dominance of clay in the lowermost horizon. Both the mean grain size and mode exceed 20 µm in the uppermost and lowermost horizons and are therefore clearly coarser than the paleosol horizons.
As our analyses do not reveal the twin peak in grain size distribution observed by Machalett et al. (Reference Machalett, Oches, Frechen, Zöller, Hambach, Mavlyanova, Marković and Endlicher2008), we use the ratio of 9–28 µm/32–63 µm as an approximation. The ratio of grains within these classes, rather than the gap in between, appears more likely to reflect paleoenvironmental changes recorded by granulometric variations. The general tendency of higher values within the pedocomplexes is similar. However, it is difficult to compare our results to the data of Machalett et al. (Reference Machalett, Oches, Frechen, Zöller, Hambach, Mavlyanova, Marković and Endlicher2008), which were obtained by a Beckmann Coulter LS 13320 PIDS laser instrument, due to the unclear precise stratigraphic relation and differences in specifications of the two laser diffraction devices used (Schulte et al., in press).
Age estimates for the two luminescence samples and relevant additional dating information are provided in Table 2. The ages are consistent with depth and stratigraphy, and constrain the timing of significant pedogenesis to between 78.7±9.2 ka and 130±16 ka. This interval most likely corresponds to MIS 5.
Table 2 Equivalent dose (De), dose rate data and luminescence age estimates for the Remizovka marker paleosol. De values, total dose rates (incorporating α-values of 0.12±0.02 after (Rees-Jones and Tite, Reference Rees-Jones and Tite1997)) and age estimates are based on polymineral pIR-IRSL290. Dose rates are already attenuated for moisture content which for both samples was measured as 12±4%.
Chronostratigraphy of the main outcrop (profiles REM 1 and 2)
Fitzsimmons et al. (Reference Fitzsimmons, Sprafke, Zielhofer, Günter, Deom, Sala and Iovitain press) investigated the upper 8 m of the REM 1a profile (Machalett et al., Reference Machalett, Oches, Frechen, Zöller, Hambach, Mavlyanova, Marković and Endlicher2008); it is clear that this section does not directly correlate their profile to REM 2. The two pedocomplexes studied here at REM 2 are visible along the lower third of the main outcrop, and can be followed with confidence along the outcrop. They correspond to the double paleosol (SR2) described by (Machalett et al., Reference Machalett, Frechen, Hambach, Oches, Zöller and Marković2006). Their SR2 consists of two Bt horizons separated by a 35 cm thick loess unit. The different topographic position provides a reason for the increased thickness of loess between the studied pedocomplexes in REM 2, but not for the difference in our pedological interpretations. Machalett et al. (Reference Machalett, Frechen, Hambach, Oches, Zöller and Marković2006) do not mention humic/cambic horizons. Their Bt horizons most likely correspond to the well-structured BCk horizons in REM 2. However, these horizons lack clay coatings and other characteristics of Bt horizons developed in loess, namely (dark) brown color, (sub)polyhedral structure or often an underlying Ck horizon (Bronger, Reference Bronger1976; Sedov et al., Reference Sedov, Sycheva, Pi and Díaz2013). The paleosols of SR2 at REM 1 are unlikely to be Bt horizons, since fundamental changes in soil forming factors could not have occurred across such short distances.
The ages we report for the two pedocomplexes at REM 2 (constrained to between 78.7±8.2 ka and 130±16 ka) agree with the general stratigraphic assumptions of Machalett et al. (Reference Machalett, Oches, Frechen, Zöller, Hambach, Mavlyanova, Marković and Endlicher2008), who assumed formation of their SR2 during MIS 5 based on amino acid racemization (AAR) dates. However, this leaves insufficient time for the formation of the SR1 complex during MIS 5, and requires parts of it to have formed during MIS 4. It would be an overinterpretation to correlate the two studied pedocomplexes (SR2) to the three “warm” marine isotope stages during MIS 5. It is unclear if the LPS Remizovka records a distinct paleoenvironmental response to global climatic changes, which differs from LPS at the Chinese loess plateau (Kukla, Reference Kukla1987; Ding et al., Reference Ding, Derbyshire, Yang, Yu, Xiong and Liu2002a; Porter, Reference Porter2013) and Europe (Marković et al., Reference Marković, Hambach, Stevens, Kukla, Heller, Mccoy, Oches, Buggle and Zöller2011).
It remains to be established if the primary loess deposition phase between the two pedocomplexes occurred during MIS 5d or 5b, or if it corresponds to any relative peaks in the global ice volume. A detailed geochronological study is as yet only available for the upper 7 m of REM 1a. Taking the revised numerical ages by Fitzsimmons et al. (Reference Fitzsimmons, Sprafke, Zielhofer, Günter, Deom, Sala and Iovitain press) into account, a substantial part of this 28.5 m thick profile (ca. 6–20 m depth) corresponds to MIS 4 and MIS 3. The D/L ratio of glutamic acid determined through AAR by Machalett et al. (Reference Machalett, Oches, Frechen, Zöller, Hambach, Mavlyanova, Marković and Endlicher2008) shows a distinct plateau from 10–20 m depth. The peak of dust accumulation at Remizovka would therefore most likely correspond to MIS 4-early MIS 3, which differs from most records in Europe and the Chinese Loess Plateau.
The Tramplin profiles (TRP 1 and 2) and their relation of the main outcrop (REM 1 and 2)
According to archival photography from the Tramplin outcrop, Machalett et al. (Reference Machalett, Frechen, Hambach, Oches, Zöller and Marković2006) did fieldwork on the TRP 1 section (Fig. 4C), which was studied in detail by Feng et al. (Reference Feng, Ran, Yang, Zhai, Wang, Zhang and Huang2011) and Nigmatova (Reference Nigmatova2009). The relationship of this profile to their synthesized standard stratigraphy is not clarified in their publication.
The high-resolution multiproxy study by Feng et al. (Reference Feng, Ran, Yang, Zhai, Wang, Zhang and Huang2011) focused on chronostratigraphy, and therefore lacks discussion of their detailed dataset on magnetic susceptibility, granulometry, carbonate content, and organic carbon. We interpret these parameter variations (also Ran and Feng, Reference Ran and Feng2014) as valuable indicators of changes in the balance between aeolian sedimentation and pedogenesis. High magnetic susceptibilities, high clay contents, high organic matter contents, together with low amounts of carbonate, all indicate intensive pedogenesis (oxidation, humification, hydrolysis, and carbonate leaching, respectively). Horizons below the paleosols are commonly enriched in leached carbonates, which is also consistent with well-developed soil profiles. Our reinterpretation of the data suggests a subdivision of the profile studied by Feng et al. (Reference Feng, Ran, Yang, Zhai, Wang, Zhang and Huang2011) into three moderately to well-developed paleosols (Fig. 6B). Based on this reinterpretation, the stratigraphic succession at the TRP 1 profile closely matches the succession occurring between 33–42 m in the synthesized stratigraphy of Machalett et al. (Reference Machalett, Frechen, Hambach, Oches, Zöller and Marković2006). We therefore assume that Machalett used the same profile for his publication as Feng (TRP 1, Fig. 6A and B).
The archival photos in Figures 4A and C show a well-developed paleosol in the upper part of the TRP 1 profile, which probably represents the paleosol identified at 4 m depth from the data of Feng et al. (Reference Feng, Ran, Yang, Zhai, Wang, Zhang and Huang2011). Surprisingly, the stratigraphy of the TRP 1 profile also matches the succession exposed at REM 2, with only slight deviations in the thickness of the loess packages (Fig. 6D and E). On this basis we can conclude that the TRP 1 profile correlates either to the succession in REM 2 (MIS 5) or to an even older part of the LPS Remizovka, but not to the last full glacial cycle. The chronological framework for the TRP 1 section (Feng et al., Reference Feng, Ran, Yang, Zhai, Wang, Zhang and Huang2011) was based on radiocarbon dating of snails and organic matter and suggests an age range of ca. 32–46 ka. Given the two possibilities for correlation with the REM 1 and REM 2 sections, this chronology is likely to be unreliable, for two reasons. Firstly, the degree of pedogenesis of the three paleosols is significant and unlikely to have occurred during such a short period during MIS 3. Secondly, apparent plateauing of radiocarbon dates based on bulk organics, yielding apparently younger chronologies than should be the case compared with independent methods, is known to occur. In particular, Song et al. (Reference Song, Lai, Li, Chen and Wang2015) observed a plateau in radiocarbon dates beyond a certain depth within Ili basin loess profiles, compared with an independent chronology using luminescence ages that continued to increase with depth. The authors explain this phenomenon by modern carbon contamination. The controversy related to the dating of the Paudorf soil (Lower Austria) is one example outside the study region, where radiocarbon dating produced numerical values from charcoal far beyond the dating range of this method (Vogel and Zagwijn, Reference Vogel and Zagwijn1967; Fink, Reference Fink1976; Sprafke, Reference Sprafke2016).
Nigmatova (Reference Nigmatova2009) analyzed the pollen assemblage of 67 samples covering the whole TRP 1 profile. Peaks in pollen abundance at 1.0–2.0 and 3.5–5.0 m depth correspond well to the two paleosols in the upper part of TRP 1. The primary loess sediments do not contain significant amounts of pollen. The pollen spectra indicate the dominance of steppe species during MIS 5. Organic material is well preserved within the rather old humic paleosols in this otherwise semi-arid, strongly continental environment, and bodes well for future work based on organic proxies.
Fieldwork at the adjacent TRP 2 section did not lead to a further publication, but the photographic documentation is useful to resolve uncertainties related to the paleotopography recorded at Tramplin. The paleosol at 4 m depth in TRP 1 is clearly visible along the uncleaned outcrop in the photograph provided (Fig. 4A and C) and leads into profile TRP 2 (with the top ca. 4 m lower than TRP 1) at a depth of 2 m. This indicates an overall inclination of ca. 6 m over a lateral distance of ca. 35 m.
Based on published data, including archival photography, and our own work, we infer that all studied sections— REM 1 and 2 and TRP 1 and 2— encompass the same SR2 pedocomplex corresponding to MIS 5. REM 1a covers a well-resolved LPS from MIS 1 through to the primary loess of MIS 6. The TRP 1 profile (Feng et al., Reference Feng, Ran, Yang, Zhai, Wang, Zhang and Huang2011) most likely exposes most of the MIS 5 record in the upper half of the profile (SR2), and includes an older paleosol at the base, which was probably exposed at REM 1b and likely corresponds to the SR3 of Machalett et al. (Reference Machalett, Frechen, Hambach, Oches, Zöller and Marković2006). The sequence investigated by Machalett et al. (Reference Machalett, Frechen, Hambach, Oches, Zöller and Marković2006) therefore comprises a synthesized composite of three sections, each successively lower in the landscape (Fig. 7). The assumption made during their study, not substantiated by more extensive field survey or drilling, was that the stratigraphy recorded in each section naturally overlies, and does not overlap with, the underlying exposure (dark red dashed lines in Fig. 7). The authors appear to have assumed a plateau-like context for loess accumulation at Remizovka, with the profile at the lower outcrop (TRP 1) complementing the upper profiles (REM 1a and b). Based on the close correlation of physical characteristics and the likely location of the second stage of the synthesized profile (Machalett et al., Reference Machalett, Frechen, Hambach, Oches, Zöller and Marković2006), we suggest that the second, middle profile (TRP 1) replicates the lower part of the main REM 1 profile. In addition to the lack of fading correction, this may explain why the numerical ages reported by Machalett et al. (Reference Machalett, Frechen, Hambach, Oches, Zöller and Marković2006) never exceed 100 ka.
Local paleotopography and –environmental development at Remizovka
According to our reinterpretation of the stratigraphy, the SR2 paleosol of Machalett et al. (Reference Machalett, Frechen, Hambach, Oches, Zöller and Marković2006) marks the surface of a paleo-hill present during MIS 5. The dip in stratigraphy from REM 1a westwards to REM 2 is clearly visible in the exposed outcrop (Fig. 4E). Consequently, we may also assume a southward dip in paleotopography from REM 1 towards the TRP profiles (green dashed line on Fig. 7), consistent with the dipping visible in the Tramplin outcrop on the photo from 2004 (Fig. 4A). Despite recent alteration and removal of the Tramplin outcrop at Remizovka, and the distinct paleotopographic development, it is nevertheless possible to reconstruct the general stratigraphy of the locality and reconstruct local paleoenvironments and topographies in three dimensions, back through time.
The paleotopography preceding and during the very first phases of loess accumulation at Remizovka is not clear. Due to the as yet undefined paleotopography below the sections investigated here, we cannot estimate the total thickness of the loess deposit at Remizovka simply based on the elevation of the contact of loess and the underlying gravels (Fig. 2). Estimates exceeding 70–80 m (Machalett et al., Reference Machalett, Frechen, Hambach, Oches, Zöller and Marković2006) are likely exaggerated. Given the uncertainties in correlating paleosols at Remizovka with marine isotope stages, it is unclear if the well-developed paleosol in the lower part of the TRP 1 profile (Feng et al., Reference Feng, Ran, Yang, Zhai, Wang, Zhang and Huang2011), the SR3 of Machalett et al. (Reference Machalett, Frechen, Hambach, Oches, Zöller and Marković2006), corresponds to MIS 7. The comparable thickness of loess between SR3 and SR2 both at REM 1 and TRP 1 indicates that loess accumulation during MIS 6 appears to have occurred as a drape over hilly paleotopography. The most visible paleotopography is marked by the SR2 (MIS 5) paleosols. Due to the active seismicity of the region, we cannot exclude abrupt variations related to changes in paleotopography or postgenetic offsets of stratigraphic markers outside the investigated sections.
Our paleopedological data, together with the palynological record, allow the first robust interpretations to be made for MIS 5 paleoenvironments at Remizovka. The Bw horizon in SR2S2 (MIS 5e) resembles the lower part of interglacial pedocomplexes found in the Danube loess east of the Bohemian Massif, for example the Stillfried A pedocomplex near Vienna; there, the loamy brown horizon without signs of clay illuviation is interpreted as representing a soil formed under a temperate to Mediterranean climate (Fink, Reference Fink1956, Reference Fink1962). At Remizovka, the Bw horizon is less intensively developed and appears as a decalcified subsoil horizon of a degraded fossil Chernozem. Dark humic soils with numerous krotovina are typical in steppe ecosystems (Bronger, Reference Bronger1976). Indications of steppe conditions are consistent with the palynological data from Nigmatova (Reference Nigmatova2009). Nevertheless, the paleoecological conditions for the genesis of the well-structured BCk horizons remain to be established. From the present study, we exclude the formation of Bt horizons at Remizovka, which would have indicated strongly weathered forest soils, although such soils do occur in the LPS of Tadjikistan (Bronger et al., Reference Bronger, Winter and Heinkele1998a) and northern Iran (Vlaminck et al., Reference Vlaminck, Kehl, Lauer, Shahriari, Sharifi, Eckmeier, Lehndorff, Khormali and Frechen2016).
The luminescence ages from this study and those of Fitzsimmons et al. (Reference Fitzsimmons, Sprafke, Zielhofer, Günter, Deom, Sala and Iovitain press) indicate high dust accumulation rates during MIS 4 and 3, although the precise timing of the peak phases remains to be established. The granulometric data of Machalett et al. (Reference Machalett, Oches, Frechen, Zöller, Hambach, Mavlyanova, Marković and Endlicher2008) indicate undisturbed, semi-continuous aeolian dust sedimentation after MIS 5. It is unclear to what extent the slope and paleotopography changed across the hill after MIS 5 and during the high loess flux phase of MIS 4, and to what degree this changed during MIS 3 and MIS 2. No visible stratigraphic markers can be traced in the LPS above this complex but, based on increased loess accumulation rates relative to the limited lateral space between the different profiles, we infer the formation of a positive loess landform comparable with “gredas” such as those visible at LPS Nussloch in Germany (Antoine et al., Reference Antoine, Rousseau, Zöller, Lang, Munaut, Hatté and Fontugne2001).
Loess deposition may have experienced a similar peak in the region during MIS 2, accumulating elsewhere along the piedmont and simply not at Remizovka. Such a complex pattern of spatiotemporal variation in loess distribution is also reported from the lower Danube basin of Romania (Fitzsimmons, Reference Fitzsimmons2017). Studies from the Chinese part of the Ili basin indicate that loess accumulation peaks are not coeval between sites (Li et al., Reference Li, Rao, Duan, Xia, Wang, Madsen and Jia2016a). Localized paleoclimatic and geomorphological influences must be invoked to explain these discrepancies.
Regional implications of this study
Thick loess deposits occur in various geomorphic contexts along the Zailisky Alatau piedmont. They often appear to drape pre-existing topography rather than occurring as a loess plateau. Previous estimations of thicknesses exceeding 100 m need to be ground-truthed by boreholes and geophysical prospection. From the one LPS studied in detail, Remizovka, we cannot determine mass accumulation rates for the entire Tian Shan piedmont with any accuracy. The timing of peaks in dust accumulation rates from the Ili basin loess clearly varies from site to site (Li et al., Reference Li, Song, Yan, Chen and An2015, Reference Li, Rao, Duan, Xia, Wang, Madsen and Jia2016a, Reference Li, Song, Lai, Han and An2016b; Song et al., Reference Song, Lai, Li, Chen and Wang2015). This variability may be related to both differences in local geomorphic setting and (paleo)topographic variations. Regional mass accumulation rates must be interpreted carefully and require detailed surveys and high resolution geochronological data (Li et al., Reference Li, Rao, Duan, Xia, Wang, Madsen and Jia2016a).
Deposits of thick loess in the Central Asian high mountain piedmont appear to be related to specific topographic positions. Although little data are available, the thickest loess in Central Asia appears to occur in the Vakhsh valley of the southern Tajik depression, where it appears to form a plateau-loess-like deposit (Dodonov, Reference Dodonov1991; Bronger et al., Reference Bronger, Winter and Heinkele1998a, Reference Bronger, Winter and Sedov1998b; Ding et al., Reference Ding, Ranov, Yang, Finaev, Han and Wang2002b). Substantial accumulation in this region may be related to its sheltered position, creating a dead-end for dust-bearing westerly winds (Vandenberghe et al., Reference Vandenberghe, Renssen, van Huissteden, Nugteren, Konert, Lu, Dodonov and Buylaert2006). By comparison, the Ili basin of southeast Kazakhstan and far western China is relatively enclosed. Other than two localities of high loess accumulation in the northern (up to 200 m) and eastern (up to 100 m) Ili Basin (Fig. 1B; Song et al., Reference Song, Chen, Qian, Li, Li, Li, Chang and An2014), there is as yet little evidence for the occurrence of plateau-like deposition in this area (Li et al., Reference Li, Song, Yan, Chen and An2015).
However, even in the case of loess plateaus, paleotopography is likely to have been an influence and needs to be considered more carefully (Stevens et al., Reference Stevens, Thomas, Armitage, Lunn and Lu2007; Fitzsimmons et al., Reference Fitzsimmons, Hambach, Veres and Iovita2013; Vandenberghe et al., Reference Vandenberghe, Markovič, Jovanovič and Hambach2014; Fitzsimmons, Reference Fitzsimmons2017). Loess plateaus experiencing high accumulation rates, such as in China (Liu, Reference Liu1988; An et al., Reference An, Liu, Porter, Kukla, Wu and Hua1990; Ding et al., Reference Ding, Derbyshire, Yang, Yu, Xiong and Liu2002a; Porter, Reference Porter2013) or the Middle and Lower Danube Basin (Marković et al., Reference Marković, Hambach, Stevens, Kukla, Heller, Mccoy, Oches, Buggle and Zöller2011; Fitzsimmons et al., Reference Fitzsimmons, Marković and Hambach2012; Buggle et al., Reference Buggle, Hambach, Müller, Zöller, Marković and Glaser2014; Marković et al., Reference Marković, Stevens, Kukla, Hambach, Fitzsimmons, Gibbard and Buggle2015), are the exception to the rule. There are several loess regions worldwide, such as the Great Plains of the USA (Ruhe et al., Reference Ruhe, Daniels and Cady1967; Mason et al., Reference Mason, Joeckel and Bettis2007) or the Russian Plain (Velichko, Reference Velichko1990; Makeev, Reference Makeev2009), where horizontal drapes intersect with areas experiencing greater influence of (paleo)topography.
Landscapes with discontinuous loess cover of varying thickness due to variable topography are widespread in the temperate zone, such as in the patchy loess belt of Central Europe (Bertran et al., Reference Bertran, Liard, Sitzia and Tissoux2016), close to last glacial inland ice margins (Schaetzl et al., Reference Schaetzl, Larson, Faulkner, Running, Jol and Rittenourin press) or in parts of the Central Asian piedmont, e.g., the Ili Basin. Polygenetic loess profiles influenced by slope processes are abundant records of the complex landscape response to climatic changes (Sprafke, Reference Sprafke2016). Consideration of paleotopography in loess research is not new (Ruhe et al., Reference Ruhe, Daniels and Cady1967), but has become somewhat overlooked in the search for thick, presumed complete, or representative sections.
Nevertheless, the LPS Remizovka appears to be exceptional, at least for the Kazakh part of the Ili Basin. This exposure, one of the northern Tian Shan’s thickest loess deposits, provides a unique opportunity to investigate loess systems over three dimensions in time, combining the potential of vertical drilling with detailed field descriptions of paleotopography in exposure.
In general, proper usage of terrestrial archives requires adequate documentation of the field context of the studied profile and a justification as to why the location was chosen. Complex terrestrial archives like LPS are not simply sampling sites for potential proxy data, but provide important field evidence by themselves. Pedology, sedimentology, geomorphology, and paleotopography all need to be considered as fundamental bases of understanding the loess archive before sampling for proxies of past climate reconstruction can begin (cf. Sprafke, Reference Sprafke2016). Crucial elements of field documentation include precise coordinates and consistent stratigraphic description using standardized codes, all of which need to be unified and further developed within the loess community. Based on the fundamental paleopedological work of Bronger (Reference Bronger1976, Reference Bronger2003; Bronger et al., Reference Bronger, Winter and Heinkele1998a), Sprafke (Reference Sprafke2016) applied a refined classification scheme based on color measurements and pedological designations of all units within a LPS, which has already been applied at Remizovka (Fitzsimmons et al., Reference Fitzsimmons, Sprafke, Zielhofer, Günter, Deom, Sala and Iovitain press). Next to detailed descriptions, photos need to include various spatial scales from the landscape, to the outcrop, profile, feature, and its detail. Such information, together with laboratory data, must be made available in online supplements of the publication or in independent databases.
CONCLUSIONS
Current urban development at the LPS Remizovka highlights the importance of documenting this key regional archive of Pleistocene paleoclimatic evolution. This involves the review of previous work undertaken at outcrops that were destroyed during construction of the racing track. Despite limited documentation, we can rely on the few archival photos available, as well as Google Earth and Corona satellite imagery, to reconstruct the location of previously studied loess profiles. Using the published data and our own investigations on the MIS 5 pedocomplex, we were able to correlate these previously studied profiles, thereby resolving previous complications and furthering our understanding of the local and regional (paleo)topographic context.
Preliminary paleoenvironmental reconstructions point to hilly topography and a steppe ecosystem during MIS 5, interrupted by a phase of increased loess deposition. Future studies must address the paleopedological record of the LPS Remizovka, especially the paleoenvironmental significance of the well-structured BCk horizons in the lower part of the two pedocomplexes. From the chronological data in this study, we infer that sedimentation and pedogenesis may be not have been in phase with even and odd marine isotope stages, respectively, as is the case for loess records in Europe and China. High dust accumulation rates are evident during MIS 4 and 3, and may have led to landform growth. Future studies should address this unique paleoclimatic archive with a focused approach to reconstruct its fomation and provide a consistent chronological framework. Drilling in front of the main profile can complement the exposed outcrop. In sum, our study stresses the general need to adequately consider (paleo)topography in the interpretations of LPS, and to provide comprehensive documentation and datasets.
ACKNOWLEDGMENTS
We thank Robert Peticzka (University of Vienna) for providing the spectrophotometer and Leonor Rodrigues (University of Bern, CNRS Montpellier) for the grain size measurements. Radu Iovita (New York University) is thanked for providing photos from 2013. Corona and SRTM data are distributed by the Land Processes Distributed Active Archive Center (LP DAAC), located at USGS/EROS, Sioux Falls, SD http://lpdaac.usgs.gov. Pléiades stereo imagery was acquired with a grant from the NERC/ESRC Earthquake without Frontiers Project (EwF; grant code: EwF_NE/J02001X/1_1). We gratefully acknowledge the thoughtful review comments of an anonymous reviewer and Joe Mason. Thanks also to guest editor Randy Schaetzl and Nicholas Lancaster for providing valuable suggestions that improved the final version of this manuscript.
SUPPLEMENTARY MATERIALS
To view supplementary material for this article, please visit https://doi.org/10.1017/qua.2017.103


