


1. Introduction
The accurate evaluation of the unsteady aerodynamic loads around aerodynamic lifting bodies is of paramount importance in the determination of dynamic structural loads and aeroelastic stability in fixed- and rotary-wing aircraft, turbo-machinery and wind turbines. An accurate prediction of unsteady loads is also essential to evaluate the propulsive efficiency of flapping motion (see Garrick Reference Garrick1936; Freymuth Reference Freymuth1988; Anderson et al. Reference Anderson, Streitlien, Barrett and Triantafyllou1998) and to design load-alleviation devices (e.g. Kinzel, Maughmer & Duque Reference Kinzel, Maughmer and Duque2010). To understand all the implications of unsteadiness in the design process, it is necessary to achieve a deep knowledge of the theoretical fundamentals of unsteady flows and in particular of periodic motions.
A large number of studies have been carried out to investigate the complex aerodynamics of airfoils in unsteady motion in different flow regimes. Kurosaka (Reference Kurosaka1974) applied the linearized theory to the prediction of unsteady loads around airfoils oscillating at high reduced frequencies in supersonic flows. The dynamic loading over airfoils at low Reynolds number (up to 40 000) and in the incompressible limit was studied by e.g. Anderson et al. (Reference Anderson, Streitlien, Barrett and Triantafyllou1998), who observed particular flow field features, including so-called leading-edge vortices and large-scale vortical structure in the wake. Baik et al. (Reference Baik, Bernal, Granlund and Ol2012) successfully compared experimental results to linear theory predictions in these conditions, which are relevant to the understanding of the propulsion of fish and cetaceans and of insect flight. In particular, Uldrick & Siekmann (Reference Uldrick and Siekmann1964) investigated the effect of the airfoil thickness in swimming motion. At a larger angle of attack, so-called dynamic stall is possibly observed, see for example Panda & Zaman (Reference Panda and Zaman1994). More recently, boundary layer transition and separation was studied experimentally by Lee & Gerontakos (Reference Lee and Gerontakos2004) at
 $\mathit{Re}=135\,000$
for an oscillating NACA 0012 airfoil. High reduced frequency effects were measured for the NACA 0012 airfoil at
$\mathit{Re}=135\,000$
for an oscillating NACA 0012 airfoil. High reduced frequency effects were measured for the NACA 0012 airfoil at
 $\mathit{Re}=12\,600$
by Bohl & Koochesfahani (Reference Bohl and Koochesfahani2009). The reader is referred to the review of McCroskey (Reference McCroskey1982) for further details.
$\mathit{Re}=12\,600$
by Bohl & Koochesfahani (Reference Bohl and Koochesfahani2009). The reader is referred to the review of McCroskey (Reference McCroskey1982) for further details.
Physical models of different complexity have been proposed and validated through experiments and, more recently, by numerical simulations. The cornerstone models for unsteady aerodynamics were developed by Wagner (Reference Wagner1925) in the time domain, and by Theodorsen (Reference Theodorsen1935) for unsteady aerodynamic forces in the frequency domain. Relevant contributions to the field were given by e.g. Cicala (Reference Cicala1936) and Küssner (Reference Küssner1936). Garrick (Reference Garrick1938) demonstrated the equivalence between Theodorsen’s frequency domain function and the indicial response function developed by Wagner for the transient response of an impulsively started airfoil.
Most mathematical models derive from the small-perturbation hypothesis, which is justified by the fact that the surface of aerodynamic lifting bodies can be approximated by the corresponding lifting flat plate with zero thickness (see Bisplinghoff, Ashley & Halfman Reference Bisplinghoff, Ashley and Halfman1955, chapter 5). In accordance with the small-perturbation hypothesis, the aerodynamic solution was obtained by Wagner (Reference Wagner1925) and Theodorsen (Reference Theodorsen1935) as a linear combination of elementary solutions corresponding to the separate contributions of the body angle of attack, camber and thickness distribution, under the further assumption that the coupling among these terms is negligible. In particular, by using conformal mapping techniques, Theodorsen derived an analytical expression for the unsteady lift of a two-dimensional flat plate moving in an inviscid incompressible flow, written in terms of three contributions: quasi-steady aerodynamics, the so-called added mass, and the wake unsteady contribution. Küssner & Schwarz (Reference Küssner and Schwarz1941) were able to obtain the pressure distribution along the chord for an arbitrary spatial and temporal distribution of the velocity boundary condition on the airfoil, thus opening the way for the possibility of studying variable-shape airfoils (see e.g. Gennaretti, Testa & Bernardini Reference Gennaretti, Testa and Bernardini2013). Starting from these seminal works several authors developed more complex models to account for e.g. the fluid compressibility (see Bisplinghoff et al. Reference Bisplinghoff, Ashley and Halfman1955; Fung Reference Fung1955, for extensive reviews). These models, with slight modifications, are currently being successfully applied to fixed-wing (see Bisplinghoff et al. Reference Bisplinghoff, Ashley and Halfman1955; Fung Reference Fung1955) and rotary-wing (see Johnson Reference Johnson1980; Leishman Reference Leishman2006) aircraft design.
Extensions of Theodorsen’s theory were proposed to take into account the effect of airfoil thickness of interest in the present work. These research activities were motivated by the limits of the linearity assumption and by the fact that the thin-airfoil theory exploited by Theodorsen is clearly unreliable in the airfoil nose region (see Barger Reference Barger1975). Küssner (Reference Küssner and Jones1960) developed a very elegant mathematical theory to account for the effect of the finite airfoil thickness. By resorting to conformal mapping techniques, Küssner computed a set of modified Theodorsen’s functions for Joukowsky airfoils. McCroskey (Reference McCroskey1973) developed a formulation for airfoils in unsteady motion, starting from the thin-airfoil theory, but keeping into account also the thickness and the camber, to evaluate the pressure distribution. The boundary velocity was expressed as the sum of three contributions. The camber and the thickness contributions are coincident with those obtained from the steady-flow theory (see e.g. Abbott & von Doenhoff Reference Abbott and von Doenhoff1949). The third term, which is a function of the angle of attack, accounts for the flow unsteadiness. The unsteady term depends on the ratio between the unsteady and the quasi-steady solution for a flat plate. While being an extension of Theodorsen’s approach, in McCroskey (Reference McCroskey1973) the effects of unsteadiness are still restricted to the contribution of the angle of attack only.
Goldstein & Atassi (Reference Goldstein and Atassi1976) showed that the effects of thickness, camber and angle of attack cannot simply be superimposed for the computation of the response of an airfoil to an incident gust. They developed a second-order approximation taking into account the effect of the distortion of the incident disturbance that lead to a complex analytical expression for the unsteady lift, but in their analysis the effect of thickness on the unsteady lift was neglected because, according to the authors themselves, the ‘airfoil thickness probably has only an unimportant influence on the unsteady lift’. A second-order expansion was developed by Van Dyke (Reference Van Dyke1953) for an oscillating airfoil in a supersonic flow. Glegg & Devenport (Reference Glegg and Devenport2009) developed a theory based on conformal mapping and the Blasius theorem to evaluate the unsteady loading of an arbitrary-thickness airfoil determined by an airfoil–vortex interaction showing significant effects due to thickness.
The availability of computational fluid dynamics (CFD) tools ousted almost completely the analytical formulations, also due to the high degree of complexity reached by the latter (see Goldstein & Atassi Reference Goldstein and Atassi1976). Several panel methods to compute numerically the unsteady incompressible potential flow around a moving airfoil are presented in the textbook by Katz & Plotkin (Reference Katz and Plotkin1991). A more refined approach capable of also taking into account compressibility effects was proposed by Morino (Reference Morino1974) and Morino, Chen & Suciu (Reference Morino, Chen and Suciu1975). As the computational power increased, numerical simulations, based on e.g. the finite volume or finite-element discretization of the Euler or Reynolds-averaged Navier–Stokes (RANS) equations, were used to study unsteady aerodynamic phenomena. Notwithstanding the advantages related to the use of a more complete physical model, several aspects may affect the reliability of numerical results, including the influence of the grid resolution or of the time integration scheme.
The understanding of the influence of airfoil thickness on the unsteady aerodynamic loads is still unsatisfactory, though the capability of predicting the aerodynamic loads in these conditions is of paramount importance in e.g. fixed- and rotary-wing design. The goal of the present paper is to provide a comprehensive description, from both a qualitative and a quantitative point of view, of the aerodynamic load’s dependence on the airfoil thickness for small-amplitude oscillations and in the low Mach number limit. In these conditions, a linear and incompressible behaviour can be expected. A CFD solver for the RANS/Euler equations is used to compute the aerodynamic flow field to avoid the derivation of a complex analytical or semi-analytical solution of the potential problem.
In § 2, the well-known linear theory results for oscillating airfoils are recalled, to underline the interplay between the airfoil thickness and the boundary conditions of the potential problem at the body interface. In § 3 a brief overview of the considered computational model is given and its suitability for the problem under study is assessed. In § 4, the results of the numerical simulation for symmetrical four-digit NACA airfoils are presented and an explanation of the dependence of aerodynamic loads on the airfoil thickness is provided. In § 5 a modification to the flat-plate Theodorsen model is proposed, which accounts for the thickness effects in the computation of the unsteady aerodynamic loads. Significant improvements with respect to the classical Theodorsen formulation in computing the hysteresis cycles of finite thickness and slightly cambered airfoils are pointed out. In § 6, final remarks and comments are given.
2. Review of linear theory for oscillating airfoils
The classical Theodorsen linear theory for plunging and pitching airfoils derives from the hypothesis of irrotational and incompressible flow. Under these assumptions, the point-wise value of the velocity vector
 $\boldsymbol{V}(\boldsymbol{x},t)$
is written as the sum of the constant free-stream velocity
$\boldsymbol{V}(\boldsymbol{x},t)$
is written as the sum of the constant free-stream velocity
 $U_{\infty }$
(the
$U_{\infty }$
(the
 $x$
-axis is parallel to the free-stream velocity) and the perturbation velocity
$x$
-axis is parallel to the free-stream velocity) and the perturbation velocity
 $\boldsymbol{v}(\boldsymbol{x},t)$
, i.e.
$\boldsymbol{v}(\boldsymbol{x},t)$
, i.e.
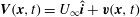 $\boldsymbol{V}(\boldsymbol{x},t)=U_{\infty }\hat{\boldsymbol{i}}+\boldsymbol{v}(\boldsymbol{x},t)$
, where
$\boldsymbol{V}(\boldsymbol{x},t)=U_{\infty }\hat{\boldsymbol{i}}+\boldsymbol{v}(\boldsymbol{x},t)$
, where
 $\hat{\boldsymbol{i}}$
is the
$\hat{\boldsymbol{i}}$
is the
 $x$
-axis unit vector. The perturbation velocity is the gradient of a scalar function
$x$
-axis unit vector. The perturbation velocity is the gradient of a scalar function
 ${\it\varphi}(\boldsymbol{x},t)$
termed the perturbation potential, i.e.
${\it\varphi}(\boldsymbol{x},t)$
termed the perturbation potential, i.e.
 $\boldsymbol{v}(\boldsymbol{x},t)=\boldsymbol{{\rm\nabla}}\!{\it\varphi}(\boldsymbol{x},t)$
. In the linear theory, the perturbation velocity is assumed to be small with respect to the free-stream velocity, namely
$\boldsymbol{v}(\boldsymbol{x},t)=\boldsymbol{{\rm\nabla}}\!{\it\varphi}(\boldsymbol{x},t)$
. In the linear theory, the perturbation velocity is assumed to be small with respect to the free-stream velocity, namely
 $|\boldsymbol{v}|/U_{\infty }\ll 1$
. By combining the velocity potential definition and the continuity equation for incompressible flows, the well-known Laplace equation is obtained as
$|\boldsymbol{v}|/U_{\infty }\ll 1$
. By combining the velocity potential definition and the continuity equation for incompressible flows, the well-known Laplace equation is obtained as
 $$\begin{eqnarray}{\rm\nabla}^{2}{\it\varphi}=0,\end{eqnarray}$$
which is to be made complete by suitable initial and boundary conditions.
At the body surface, the boundary condition is the well-known impermeability or slip condition, namely,
 $\boldsymbol{V}\boldsymbol{\cdot }\boldsymbol{n}=\boldsymbol{v}_{B}\boldsymbol{\cdot }\boldsymbol{n}$
, with
$\boldsymbol{V}\boldsymbol{\cdot }\boldsymbol{n}=\boldsymbol{v}_{B}\boldsymbol{\cdot }\boldsymbol{n}$
, with
 $\boldsymbol{v}_{B}$
local velocity of the solid surface. In terms of velocity potentials, the boundary condition is written as a Neumann condition as follows (see Katz & Plotkin Reference Katz and Plotkin1991, chapter 2):
$\boldsymbol{v}_{B}$
local velocity of the solid surface. In terms of velocity potentials, the boundary condition is written as a Neumann condition as follows (see Katz & Plotkin Reference Katz and Plotkin1991, chapter 2):
 $$\begin{eqnarray}\frac{\partial {\it\varphi}}{\partial n}=(\boldsymbol{v}_{B}-U_{\infty }\hat{\boldsymbol{i}})\boldsymbol{\cdot }\boldsymbol{n},\end{eqnarray}$$
where
 $\boldsymbol{n}$
is the normal unit vector from the body surface and
$\boldsymbol{n}$
is the normal unit vector from the body surface and
 $\partial /\partial n=\boldsymbol{n}\boldsymbol{\cdot }\boldsymbol{{\rm\nabla}}\!$
.
$\partial /\partial n=\boldsymbol{n}\boldsymbol{\cdot }\boldsymbol{{\rm\nabla}}\!$
.
Sufficiently far from the airfoil, the so-called boundary condition at infinity is enforced,
 $$\begin{eqnarray}\lim _{r\rightarrow \infty }\boldsymbol{v}(r)=o(r^{-1}),\end{eqnarray}$$
with
 $r$
the distance from the airfoil.
$r$
the distance from the airfoil.
The boundary conditions along the wake are obtained by imposing the conservation of mass and momentum across the surface of discontinuity as
 $$\begin{eqnarray}\displaystyle & \displaystyle {\rm\Delta}\left(\frac{\partial {\it\varphi}}{\partial n}\right)=0 & \displaystyle\end{eqnarray}$$
 $$\begin{eqnarray}\displaystyle & {\rm\Delta}{\it\varphi}(\boldsymbol{x}_{W},t)={\rm\Delta}{\it\varphi}(\boldsymbol{x}_{TE},t-t_{c}), & \displaystyle\end{eqnarray}$$
 ${\rm\Delta}$
indicates the difference between the two sides of the wake,
${\rm\Delta}$
indicates the difference between the two sides of the wake,
 $\boldsymbol{x}_{TE}$
is the coordinate vector of the trailing edge,
$\boldsymbol{x}_{TE}$
is the coordinate vector of the trailing edge,
 $t_{c}$
is the convection time and the wake is described by the function
$t_{c}$
is the convection time and the wake is described by the function
 $\boldsymbol{x}=\boldsymbol{x}_{W}(s,t)$
, with
$\boldsymbol{x}=\boldsymbol{x}_{W}(s,t)$
, with
 $s$
the curvilinear coordinate along the wake. At the trailing edge, one also has to explicitly impose the well-known Kutta condition (see Morino Reference Morino2003, pp. 1213–1214). It is not obvious that the Kutta condition for steady flows could be extended to unsteady flows as well. Experimental studies indicated that, in fact, the streamlines do not leave parallel to the trailing edge at reduced frequencies above 0.6 (see Archibald Reference Archibald1975). However, for small-amplitude oscillations the pressure distribution and the lift are not affected significantly, so for practical purposes the unsteady Kutta condition is equivalent to the steady one, fixing the rear stagnation line to start at the trailing edge (see Katz & Plotkin Reference Katz and Plotkin1991, chapter 13, pp. 476–479).
$s$
the curvilinear coordinate along the wake. At the trailing edge, one also has to explicitly impose the well-known Kutta condition (see Morino Reference Morino2003, pp. 1213–1214). It is not obvious that the Kutta condition for steady flows could be extended to unsteady flows as well. Experimental studies indicated that, in fact, the streamlines do not leave parallel to the trailing edge at reduced frequencies above 0.6 (see Archibald Reference Archibald1975). However, for small-amplitude oscillations the pressure distribution and the lift are not affected significantly, so for practical purposes the unsteady Kutta condition is equivalent to the steady one, fixing the rear stagnation line to start at the trailing edge (see Katz & Plotkin Reference Katz and Plotkin1991, chapter 13, pp. 476–479).
From the potential equation (2.1), it is apparent that at larger times, when the transitory regime from initial conditions can be assumed to have terminated, the flow unsteadiness and possible nonlinear terms can be introduced only by the displacement of the solid boundary, as detailed in the next section.
2.1. Boundary conditions at the airfoil surface
In the present section, the boundary condition at the body surface (2.2) is discussed. For simplicity, we start by considering the airfoil upper surface. The coordinate vector of each point along the upper surface is given by
 $$\begin{eqnarray}{\bf\sigma}(s,t)={\bf\sigma}_{ca}(s)+{\bf\sigma}_{th}(s)+{\bf\sigma}_{ds}(s,t)={\bf\sigma}_{st}(s)+{\bf\sigma}_{ds}(s,t),\end{eqnarray}$$
where the flow direction is aligned with the
 $x$
coordinate axis. The initial shape of the airfoil
$x$
coordinate axis. The initial shape of the airfoil
 ${\bf\sigma}_{st}$
at
${\bf\sigma}_{st}$
at
 $t=0$
is expressed as the sum of two terms: the mean line camber
$t=0$
is expressed as the sum of two terms: the mean line camber
 ${\bf\sigma}_{ca}$
and the thickness
${\bf\sigma}_{ca}$
and the thickness
 ${\bf\sigma}_{th}$
. The quantity
${\bf\sigma}_{th}$
. The quantity
 ${\bf\sigma}_{ds}$
is the local surface displacement due to the airfoil motion.
${\bf\sigma}_{ds}$
is the local surface displacement due to the airfoil motion.
The normal outward vector along the airfoil surface is given by
 $$\begin{eqnarray}\boldsymbol{n}(s,t)=-\frac{\partial {\bf\sigma}(s,t)}{\partial s}\times \hat{\boldsymbol{k}}=\boldsymbol{n}_{st}(s)+\boldsymbol{n}_{ds}(s,t),\end{eqnarray}$$
where
 $\hat{\boldsymbol{k}}$
is the unit vector of the
$\hat{\boldsymbol{k}}$
is the unit vector of the
 $z$
-axis normal to the airfoil plane. The normal unit vector
$z$
-axis normal to the airfoil plane. The normal unit vector
 $\hat{\boldsymbol{n}}$
therefore is
$\hat{\boldsymbol{n}}$
therefore is
 $$\begin{eqnarray}\hat{\boldsymbol{n}}(s,t)=\frac{\boldsymbol{n}}{|\boldsymbol{n}|}=\frac{\boldsymbol{n}_{st}+\boldsymbol{n}_{ds}}{|\boldsymbol{n}_{st}+\boldsymbol{n}_{ds}|}.\end{eqnarray}$$
The modulus of the normal vector
 $\boldsymbol{n}$
is
$\boldsymbol{n}$
is
 $$\begin{eqnarray}\displaystyle |\boldsymbol{n}_{st}+\boldsymbol{n}_{ds}| & = & \displaystyle \sqrt{|\boldsymbol{n}_{st}|^{2}+|\boldsymbol{n}_{ds}|^{2}+2\,\boldsymbol{n}_{st}\boldsymbol{\cdot }\boldsymbol{n}_{ds}}\nonumber\\ \displaystyle & = & \displaystyle |\boldsymbol{n}_{st}|\sqrt{1+2\,\frac{\boldsymbol{n}_{st}\boldsymbol{\cdot }\boldsymbol{ n}_{ds}}{|\boldsymbol{n}_{st}|^{2}}+\frac{|\boldsymbol{n}_{ds}|^{2}}{|\boldsymbol{n}_{st}|^{2}}}\nonumber\\ \displaystyle & \simeq & \displaystyle |\boldsymbol{n}_{st}|\left[1-\frac{\boldsymbol{n}_{st}\boldsymbol{\cdot }\boldsymbol{n}_{ds}}{|\boldsymbol{n}_{st}|^{2}}-\frac{1}{2}\frac{|\boldsymbol{n}_{ds}|^{2}}{|\boldsymbol{n}_{st}|^{2}}\right]^{-1},\end{eqnarray}$$
where in the last relation, the expansion
 $(1+{\it\epsilon})^{1/2}\simeq (1-{\it\epsilon}/2)^{-1}$
, valid for
$(1+{\it\epsilon})^{1/2}\simeq (1-{\it\epsilon}/2)^{-1}$
, valid for
 ${\it\epsilon}\ll 1$
, is used. Namely,
${\it\epsilon}\ll 1$
, is used. Namely,
 ${\it\epsilon}$
is defined as
${\it\epsilon}$
is defined as
 $$\begin{eqnarray}{\it\epsilon}=2\,\frac{\boldsymbol{n}_{st}\boldsymbol{\cdot }\boldsymbol{n}_{ds}}{|\boldsymbol{n}_{st}|^{2}}+\frac{|\boldsymbol{n}_{ds}|^{2}}{|\boldsymbol{n}_{st}|^{2}}.\end{eqnarray}$$
By considering only the first-order displacement terms in (2.8), the linearized form of the normal unit vector can be written
 $$\begin{eqnarray}\hat{\boldsymbol{n}}\simeq \frac{\boldsymbol{n}_{st}+\boldsymbol{n}_{ds}}{|\boldsymbol{n}_{st}|}\left(1-\frac{\boldsymbol{n}_{st}\boldsymbol{\cdot }\boldsymbol{n}_{ds}}{|\boldsymbol{n}_{st}|^{2}}\right)\simeq \frac{\boldsymbol{n}_{ds}}{|\boldsymbol{n}_{st}|}+\left(1-\frac{\boldsymbol{n}_{ds}\boldsymbol{\cdot }\boldsymbol{n}_{st}}{|\boldsymbol{n}_{st}|^{2}}\right)\hat{\boldsymbol{n}}_{st},\end{eqnarray}$$
where in the last expression the second-order term
 $\boldsymbol{n}_{ds}(\boldsymbol{n}_{ds}\boldsymbol{\cdot }\boldsymbol{n}_{ds})$
is neglected.
$\boldsymbol{n}_{ds}(\boldsymbol{n}_{ds}\boldsymbol{\cdot }\boldsymbol{n}_{ds})$
is neglected.
The expression (2.11) of the normal unit vector is now used to compute the normal component of the body displacement velocity as
 $$\begin{eqnarray}\boldsymbol{v}_{B}\boldsymbol{\cdot }\hat{\boldsymbol{n}}=-\frac{\partial {\bf\sigma}}{\partial t}\boldsymbol{\cdot }\left(\frac{\partial {\bf\sigma}}{\partial s}\times \hat{\boldsymbol{k}}\right)\simeq -\frac{\partial {\bf\sigma}_{ds}}{\partial t}\boldsymbol{\cdot }\hat{\boldsymbol{n}},\end{eqnarray}$$
where the velocity of the body is expressed in terms of the body displacement as
 $\boldsymbol{v}_{B}=\partial {\bf\sigma}/\partial t=\partial {\bf\sigma}_{ds}/\partial t$
. By substituting (2.12) and the fluid velocity
$\boldsymbol{v}_{B}=\partial {\bf\sigma}/\partial t=\partial {\bf\sigma}_{ds}/\partial t$
. By substituting (2.12) and the fluid velocity
 $\boldsymbol{V}=U_{\infty }\;\hat{\boldsymbol{i}}+\boldsymbol{{\rm\nabla}}\!{\it\varphi}$
into the boundary condition (2.2) one obtains
$\boldsymbol{V}=U_{\infty }\;\hat{\boldsymbol{i}}+\boldsymbol{{\rm\nabla}}\!{\it\varphi}$
into the boundary condition (2.2) one obtains
 $$\begin{eqnarray}\displaystyle \frac{1}{U_{\infty }}\frac{\partial {\it\varphi}}{\partial n} & = & \displaystyle -\hat{\boldsymbol{n}}\boldsymbol{\cdot }\hat{\boldsymbol{i}}+\frac{1}{U_{\infty }}\frac{\partial {\bf\sigma}_{ds}}{\partial t}\boldsymbol{\cdot }\hat{\boldsymbol{n}}\nonumber\\ \displaystyle & = & \displaystyle -\!\left[\frac{\boldsymbol{n}_{ds}}{|\boldsymbol{n}_{st}|}+\left(1-\frac{\boldsymbol{n}_{ds}\boldsymbol{\cdot }\boldsymbol{n}_{st}}{|\boldsymbol{n}_{st}|^{2}}\right)\hat{\boldsymbol{n}}_{st}\right]\boldsymbol{\cdot }\hat{\boldsymbol{i}}+\frac{1}{U_{\infty }}\frac{\partial {\bf\sigma}_{ds}}{\partial t}\boldsymbol{\cdot }\hat{\boldsymbol{n}}_{st}\nonumber\\ \displaystyle & = & \displaystyle {\it\theta}_{st}(s)+{\it\theta}_{ge}(s,t)+{\it\theta}_{ki}(s,t),\end{eqnarray}$$
where the following definitions were introduced:
 $$\begin{eqnarray}\displaystyle {\it\theta}_{st}(s) & = & \displaystyle -\hat{\boldsymbol{n}}_{st}\boldsymbol{\cdot }\hat{\boldsymbol{i}},\end{eqnarray}$$
 $$\begin{eqnarray}\displaystyle \displaystyle {\it\theta}_{ge}(s,t) & = & \displaystyle -\!\left[\frac{\boldsymbol{n}_{ds}}{|\boldsymbol{n}_{st}|}-\frac{\boldsymbol{n}_{ds}\boldsymbol{\cdot }\boldsymbol{n}_{st}}{|\boldsymbol{n}_{st}|^{2}}\hat{\boldsymbol{n}}_{st}\right]\boldsymbol{\cdot }\hat{\boldsymbol{i}},\end{eqnarray}$$
 $$\begin{eqnarray}\displaystyle \displaystyle {\it\theta}_{ki}(s,t) & = & \displaystyle \frac{1}{U_{\infty }}\frac{\partial \boldsymbol{n}_{ds}}{\partial t}\boldsymbol{\cdot }\hat{\boldsymbol{n}}_{st}.\end{eqnarray}$$
 ${\it\theta}_{st}$
is the local angle of attack at
${\it\theta}_{st}$
is the local angle of attack at
 $t=0$
,
$t=0$
,
 ${\it\theta}_{ge}$
is the geometric angle of attack due to the airfoil displacement, and
${\it\theta}_{ge}$
is the geometric angle of attack due to the airfoil displacement, and
 ${\it\theta}_{ki}$
is the kinematic angle of attack, resulting from the body velocity. Notice that
${\it\theta}_{ki}$
is the kinematic angle of attack, resulting from the body velocity. Notice that
 ${\it\theta}_{st}$
is constant, whereas
${\it\theta}_{st}$
is constant, whereas
 ${\it\theta}_{ge}$
and
${\it\theta}_{ge}$
and
 ${\it\theta}_{ki}$
depend on time.
${\it\theta}_{ki}$
depend on time.
If only plunge and pitch movements around the point
 $(x_{0},0)$
are considered, for small angles of rotation the displacement vector
$(x_{0},0)$
are considered, for small angles of rotation the displacement vector
 ${\bf\sigma}_{ds}$
is
${\bf\sigma}_{ds}$
is
 $$\begin{eqnarray}{\bf\sigma}_{ds}=\left\{\begin{array}{@{}c@{}}0\\ 1\end{array}\right\}h(t)+\left\{\begin{array}{@{}c@{}}-{\it\sigma}_{st}^{(y)}\\ x-x_{0}\end{array}\right\}{\it\alpha}(t),\end{eqnarray}$$
where the superscript
 $(y)$
indicates the
$(y)$
indicates the
 $y$
-component of a vector,
$y$
-component of a vector,
 $h=h(t)$
is the
$h=h(t)$
is the
 $y$
displacement due to the plunge motion, and
$y$
displacement due to the plunge motion, and
 ${\it\alpha}={\it\alpha}(t)$
is the angle of attack. For small airfoil displacements,
${\it\alpha}={\it\alpha}(t)$
is the angle of attack. For small airfoil displacements,
 $s\sim x$
and one has
$s\sim x$
and one has
 $$\begin{eqnarray}\frac{\partial {\bf\sigma}_{st}}{\partial s}=\frac{\partial {\bf\sigma}_{st}}{\partial x}\frac{\partial x}{\partial s}+\frac{\partial {\bf\sigma}_{st}}{\partial y}\frac{\partial y}{\partial s}\simeq \frac{\partial {\bf\sigma}_{st}}{\partial x}.\end{eqnarray}$$
Moreover, according to the hypothesis of small perturbations that is usually valid for standard airfoils outside the nose area, one also has
 $$\begin{eqnarray}\frac{\partial {\it\sigma}_{ca}^{(y)}}{\partial s}\ll 1,\quad \frac{\partial {\it\sigma}_{th}^{(y)}}{\partial s}\ll 1\Rightarrow \frac{\partial {\it\sigma}_{st}^{(x)}}{\partial x}\simeq 1,\quad \frac{\partial {\it\sigma}_{st}^{(y)}}{\partial x}\ll 1.\end{eqnarray}$$
Therefore, from definition (2.7), one immediately obtains
 $$\begin{eqnarray}\boldsymbol{n}_{st}(s)=\left\{\begin{array}{@{}c@{}}-\displaystyle \frac{\partial {\it\sigma}_{st}^{(y)}}{\partial x}\\ 1\end{array}\right\},\quad |\boldsymbol{n}_{st}|\simeq 1,\quad \boldsymbol{n}_{ds}(s,t)=\left\{\begin{array}{@{}c@{}}1\\ -\displaystyle \frac{\partial {\it\sigma}_{st}^{(y)}}{\partial x}\end{array}\right\}{\it\alpha}(t),\quad |\boldsymbol{n}_{ds}|\simeq {\it\alpha}(t).\end{eqnarray}$$
By substituting the above expressions into (2.14) and (2.15), the sum of the initial and geometric angle of attack is
 $$\begin{eqnarray}{\it\theta}_{st}+{\it\theta}_{ge}=\frac{\partial {\it\sigma}_{st}^{(y)}}{\partial x}+\left[1+\left(\frac{\partial {\it\sigma}_{st}^{(y)}}{\partial x}\right)^{\!\!2}\,\right]{\it\alpha}(t)\simeq \frac{\partial {\it\sigma}_{st}^{(y)}}{\partial x}+{\it\alpha}(t),\end{eqnarray}$$
where only first-order terms have been retained. It is remarkable that, according to the small-perturbation theory, the unsteady contribution to the sum of the initial and geometric angle of attack does not depend on the airfoil thickness. The linearized body velocity vector is
 $$\begin{eqnarray}\frac{\partial {\bf\sigma}_{ds}}{\partial t}=\left\{\begin{array}{@{}c@{}}0\\ 1\end{array}\right\}\frac{\text{d}\,h(t)}{\text{d}\,t}+\left\{\begin{array}{@{}c@{}}-{\it\sigma}_{st}^{(y)}\\ x-x_{0}\end{array}\right\}\frac{\text{d}\,{\it\alpha}(t)}{\text{d}\,t},\end{eqnarray}$$
and therefore the kinematic angle of attack is
 $$\begin{eqnarray}{\it\theta}_{ki}=\frac{1}{U_{\infty }}\left[\frac{\text{d}\,h(t)}{\text{d}\,t}-(x-x_{0})\frac{\text{d}\,{\it\alpha}(t)}{\text{d}\,t}+{\it\sigma}_{st}^{(y)}\frac{\partial {\it\sigma}_{st}^{(y)}}{\partial x}\frac{\text{d}\,{\it\alpha}(t)}{\text{d}\,t}\right].\end{eqnarray}$$
Therefore, under the small-perturbation hypothesis, the boundary condition (2.2) can be written as
 $$\begin{eqnarray}\frac{\partial {\it\varphi}}{\partial n}=U_{\infty }\frac{\partial {\it\sigma}_{st}^{(y)}}{\partial x}+U_{\infty }{\it\alpha}(t)+\frac{\text{d}\,h(t)}{\text{d}\,t}-(x-x_{0})\frac{\text{d}\,{\it\alpha}(t)}{\text{d}\,t}+{\it\sigma}_{st}^{(y)}\frac{\partial {\it\sigma}_{st}^{(y)}}{\partial x}\frac{\text{d}\,{\it\alpha}(t)}{\text{d}\,t}.\end{eqnarray}$$
The difference in the normal derivative of the potential between the upper and lower surface of the airfoil, namely
 $$\begin{eqnarray}{\rm\Delta}\left(\frac{\partial {\it\varphi}}{\partial n}\right)=U_{\infty }\,{\rm\Delta}[{\it\theta}_{st}(s)+{\it\theta}_{ge}(s,t)+{\it\theta}_{ki}(s,t)]\end{eqnarray}$$
is now computed. By recalling that on the lower surface of the airfoil the boundary coordinates are given by
 ${\bf\sigma}^{-}={\bf\sigma}_{ca}-{\bf\sigma}_{th}+{\bf\sigma}_{ds}$
, one immediately obtains
${\bf\sigma}^{-}={\bf\sigma}_{ca}-{\bf\sigma}_{th}+{\bf\sigma}_{ds}$
, one immediately obtains
 $$\begin{eqnarray}\frac{1}{2}{\rm\Delta}[{\it\theta}_{st}(s)+{\it\theta}_{ge}(s,t)]=\frac{\partial {\it\sigma}_{ca}^{(y)}}{\partial x}+{\it\alpha}(t),\end{eqnarray}$$
and the difference in the kinematic angle of attack is
 $$\begin{eqnarray}\frac{1}{2}U_{\infty }{\rm\Delta}{\it\theta}_{ds}(s,t)=\frac{\text{d}\,h(t)}{\text{d}\,t}-(x-x_{0})\frac{\text{d}\,{\it\alpha}(t)}{\text{d}\,t}+{\it\sigma}_{th}^{(y)}\left[\frac{\partial {\it\sigma}_{ca}^{(y)}}{\partial x}+\frac{\partial {\it\sigma}_{th}^{(y)}}{\partial x}\right]\frac{\text{d}\,{\it\alpha}(t)}{\text{d}\,t}.\end{eqnarray}$$
In a standard-shape airfoil, one can usually assume
 $$\begin{eqnarray}\frac{\partial {\it\sigma}_{ca}^{(y)}}{\partial x}\ll \frac{\partial {\it\sigma}_{th}^{(y)}}{\partial x}\end{eqnarray}$$
and, therefore, relation (2.25) simplifies to
 $$\begin{eqnarray}\frac{1}{2}{\rm\Delta}\left(\frac{\partial {\it\varphi}}{\partial n}\right)=U_{\infty }\frac{\partial {\it\sigma}_{th}^{(y)}}{\partial x}+U_{\infty }{\it\alpha}(t)+\frac{\text{d}\,h(t)}{\text{d}\,t}-(x-x_{0})\frac{\text{d}\,{\it\alpha}(t)}{\text{d}\,t}+{\it\sigma}_{th}^{(y)}\frac{\partial {\it\sigma}_{th}^{(y)}}{\partial x}\frac{\text{d}\,{\it\alpha}(t)}{\text{d}\,t}.\end{eqnarray}$$
By neglecting the thickness effects, namely by assuming
 ${\bf\sigma}_{th}\equiv \mathbf{0}$
, Theodorsen (Reference Theodorsen1931) derived the well-known model for an oscillating flat plate reported in § 2.2, see also Katz & Plotkin (Reference Katz and Plotkin1991). In deriving his model for unsteady aerodynamic loads, McCroskey (Reference McCroskey1973) computed the camber and thickness velocity contributions using the steady theory. Moreover, he took into account the steady nonlinear velocity contributions close to the airfoil leading edge and neglected the unsteady contribution from the thickness. To the authors’ knowledge, the last unsteady term in (2.24), which is identically zero for a flat plate, was neglected in all analytical and semi-analytical solutions of the potential flow equations, though its presence is fully justified within the small-perturbation theory.
${\bf\sigma}_{th}\equiv \mathbf{0}$
, Theodorsen (Reference Theodorsen1931) derived the well-known model for an oscillating flat plate reported in § 2.2, see also Katz & Plotkin (Reference Katz and Plotkin1991). In deriving his model for unsteady aerodynamic loads, McCroskey (Reference McCroskey1973) computed the camber and thickness velocity contributions using the steady theory. Moreover, he took into account the steady nonlinear velocity contributions close to the airfoil leading edge and neglected the unsteady contribution from the thickness. To the authors’ knowledge, the last unsteady term in (2.24), which is identically zero for a flat plate, was neglected in all analytical and semi-analytical solutions of the potential flow equations, though its presence is fully justified within the small-perturbation theory.
We conclude that, under the assumption (2.28), the potential difference across the airfoil contains an unsteady term that is proportional to the airfoil thickness and its first-order spatial derivative, thus indicating that the airfoil thickness may produce a non-negligible contribution to the aerodynamic load within the small-perturbation theory. While within the thin-airfoil hypothesis, i.e.
 ${\it\sigma}_{th}^{(y)}\rightarrow 0$
, the last term of (2.29) can be neglected, for airfoils with finite thickness it may be possible that somewhere along the chord the term
${\it\sigma}_{th}^{(y)}\rightarrow 0$
, the last term of (2.29) can be neglected, for airfoils with finite thickness it may be possible that somewhere along the chord the term
 ${\it\sigma}_{th}^{(y)}\partial {\it\sigma}_{th}^{(y)}/\partial x$
may be comparable to or even larger than
${\it\sigma}_{th}^{(y)}\partial {\it\sigma}_{th}^{(y)}/\partial x$
may be comparable to or even larger than
 $(x-x_{0})$
. This contribution was neglected in previous studies and it is the focus of the present analysis. It is remarkable that if the rotation centre
$(x-x_{0})$
. This contribution was neglected in previous studies and it is the focus of the present analysis. It is remarkable that if the rotation centre
 $x_{0}$
is close to the point of maximum airfoil thickness – as is the case in most aerodynamic applications – the sign of
$x_{0}$
is close to the point of maximum airfoil thickness – as is the case in most aerodynamic applications – the sign of
 $-(x-x_{0})$
is equal to that of
$-(x-x_{0})$
is equal to that of
 ${\it\sigma}_{th}^{(y)}\partial {\it\sigma}_{th}^{(y)}/\partial x$
and therefore the inclusion of the last term in (2.25) results in an increase of the modulus of the flat-plate contribution to the potential difference across the airfoil.
${\it\sigma}_{th}^{(y)}\partial {\it\sigma}_{th}^{(y)}/\partial x$
and therefore the inclusion of the last term in (2.25) results in an increase of the modulus of the flat-plate contribution to the potential difference across the airfoil.
2.2. Theodorsen’s model for oscillating airfoils
For later convenience, the main results of the Theodorsen (Reference Theodorsen1935) solution for a flat plate (
 ${\bf\sigma}_{ca}\equiv {\bf\sigma}_{th}\equiv \mathbf{0}$
) subject to harmonic motions composed of airfoil plunge and pitch is briefly recalled. In the model, both the airfoil and the wake are represented by a vortex sheet, with the shed wake extending as a planar surface from the trailing edge downstream to infinity, i.e.
${\bf\sigma}_{ca}\equiv {\bf\sigma}_{th}\equiv \mathbf{0}$
) subject to harmonic motions composed of airfoil plunge and pitch is briefly recalled. In the model, both the airfoil and the wake are represented by a vortex sheet, with the shed wake extending as a planar surface from the trailing edge downstream to infinity, i.e.
 $\boldsymbol{x}_{W}=(s,\boldsymbol{x}_{TE}^{(y)}),\forall s>\boldsymbol{x}_{TE}^{(x)},t>0$
.
$\boldsymbol{x}_{W}=(s,\boldsymbol{x}_{TE}^{(y)}),\forall s>\boldsymbol{x}_{TE}^{(x)},t>0$
.
The solution is given by Theodorsen in terms of the transfer function between the forcing movements (plunge
 $h$
and pitch
$h$
and pitch
 ${\it\alpha}$
) and the aerodynamic response (lift and pitching moment) at a given reduced frequency
${\it\alpha}$
) and the aerodynamic response (lift and pitching moment) at a given reduced frequency
 $k={\it\omega}b/U$
, with
$k={\it\omega}b/U$
, with
 ${\it\omega}$
the oscillation frequency, as
${\it\omega}$
the oscillation frequency, as
 $$\begin{eqnarray}C_{L}(k)=2{\rm\pi}{\it\alpha}_{0}+{\rm\pi}b\left[\frac{\ddot{h}}{U_{\infty }^{2}}+\frac{\dot{{\it\alpha}}}{U_{\infty }}-\frac{ba}{U_{\infty }^{2}}\ddot{{\it\alpha}}\right]+2{\rm\pi}C(k)\left[\frac{{\dot{h}}}{U_{\infty }}+{\it\alpha}-{\it\alpha}_{0}+\frac{b}{U_{\infty }}\left(\frac{1}{2}-a\right)\dot{{\it\alpha}}\right]\end{eqnarray}$$
for the lift coefficient
 $C_{L}$
, and
$C_{L}$
, and
 $$\begin{eqnarray}C_{m}(k)=-\frac{1}{2}{\rm\pi}b\left[\frac{1}{2U_{\infty }^{2}}\ddot{h}+\frac{1}{U_{\infty }}\dot{{\it\alpha}}+\frac{b}{2U_{\infty }^{2}}\left(\frac{1}{4}-a\right)\ddot{{\it\alpha}}\right]\end{eqnarray}$$
for the moment coefficient
 $C_{m}$
with respect to the
$C_{m}$
with respect to the
 $c/4$
point, where
$c/4$
point, where
 ${\it\alpha}_{0}$
is the static angle of attack. The parameter
${\it\alpha}_{0}$
is the static angle of attack. The parameter
 $a$
is the position of the rotation centre with respect to the mid-chord, made dimensionless with the semi-chord
$a$
is the position of the rotation centre with respect to the mid-chord, made dimensionless with the semi-chord
 $b$
.
$b$
.

Figure 1. Lift coefficient curve due to a pitch oscillation for the steady case (continuous line), and the unsteady case at three different reduced frequencies:
 $k=0.1$
, dashed line, counter-clockwise;
$k=0.1$
, dashed line, counter-clockwise;
 $k=0.3$
, dot-dashed line clockwise;
$k=0.3$
, dot-dashed line clockwise;
 $k=0.5$
, dotted line clockwise.
$k=0.5$
, dotted line clockwise.
The lift coefficient (2.30) is written as the sum of two terms. The first is the so-called non-circulatory part and corresponds to the added mass. It accounts for the pressure forces required to accelerate the fluid near the airfoil. The second term is called the circulatory part and it is multiplied by the complex Theodorsen function
 $C(k)\in \mathbb{C}$
. This term is in fact the sum of the quasi-steady lift
$C(k)\in \mathbb{C}$
. This term is in fact the sum of the quasi-steady lift
 $$\begin{eqnarray}C_{L_{qs}}=2{\rm\pi}\left[\frac{{\dot{h}}}{U_{\infty }}+{\it\alpha}+\frac{b}{U_{\infty }}\left(\frac{1}{2}-a\right)\dot{{\it\alpha}}\right]\end{eqnarray}$$
and the lift attenuation due to the shedding of vorticity into the wake that is equal to
 $(1-C(k))C_{L_{qs}}$
. It is interesting to note that the moment coefficient with respect to
$(1-C(k))C_{L_{qs}}$
. It is interesting to note that the moment coefficient with respect to
 $c/4$
does not depend on the circulatory part but only on the added mass effect. The complex function
$c/4$
does not depend on the circulatory part but only on the added mass effect. The complex function
 $C(k)$
is defined as
$C(k)$
is defined as
 $$\begin{eqnarray}C(k)=\frac{H_{1}^{(2)}(k)}{H_{1}^{(2)}(k)+\text{j}H_{0}^{(2)}(k)},\end{eqnarray}$$
where
 $H_{1}^{(2)}$
and
$H_{1}^{(2)}$
and
 $H_{0}^{(2)}$
are Hankel functions that involve Bessel’s functions of the first and second kind (see Theodorsen Reference Theodorsen1935).
$H_{0}^{(2)}$
are Hankel functions that involve Bessel’s functions of the first and second kind (see Theodorsen Reference Theodorsen1935).
The
 $C_{L}$
curve (2.30) as a function of the angle of attack
$C_{L}$
curve (2.30) as a function of the angle of attack
 ${\it\alpha}$
is shown in figure 1 for three values of the reduced frequency
${\it\alpha}$
is shown in figure 1 for three values of the reduced frequency
 $k$
, namely, 0.1, 0.3 and 0.5, against their steady-state counterpart (
$k$
, namely, 0.1, 0.3 and 0.5, against their steady-state counterpart (
 $C(k)=1$
,
$C(k)=1$
,
 $k={\it\omega}=0$
). The curve in figure 1 is drawn by recalling that the real part of
$k={\it\omega}=0$
). The curve in figure 1 is drawn by recalling that the real part of
 $C_{L}(k)$
represents the portion of the harmonic load that oscillates in phase with the input, while the imaginary part represents the one that is in quadrature (i.e.
$C_{L}(k)$
represents the portion of the harmonic load that oscillates in phase with the input, while the imaginary part represents the one that is in quadrature (i.e.
 $90^{\circ }$
delay). As is well known, a hysteresis cycle is observed, together with a reduction of the maximum value of the lift coefficient with increasing reduced frequencies. Figure 1 also shows that, for low reduced frequency values, the orientation of the cycle is counter-clockwise, while for higher frequencies it is clockwise. This effect can be noticed more clearly by considering the diagrams of the magnitude and the phase of the lift coefficient in (2.30), shown in figure 2(a,b). Note that the lift coefficient magnitude depicted in figure 2(a) is normalized with respect to the amplitude of the input motion. Therefore, at
$90^{\circ }$
delay). As is well known, a hysteresis cycle is observed, together with a reduction of the maximum value of the lift coefficient with increasing reduced frequencies. Figure 1 also shows that, for low reduced frequency values, the orientation of the cycle is counter-clockwise, while for higher frequencies it is clockwise. This effect can be noticed more clearly by considering the diagrams of the magnitude and the phase of the lift coefficient in (2.30), shown in figure 2(a,b). Note that the lift coefficient magnitude depicted in figure 2(a) is normalized with respect to the amplitude of the input motion. Therefore, at
 $k=0$
, the modulus of the lift coefficient is expected to be equal to the slope of the
$k=0$
, the modulus of the lift coefficient is expected to be equal to the slope of the
 $C_{L}{-}{\it\alpha}$
curve which, for a steady flat plate, is
$C_{L}{-}{\it\alpha}$
curve which, for a steady flat plate, is
 $2{\rm\pi}$
. Figure 2(a) clearly shows that
$2{\rm\pi}$
. Figure 2(a) clearly shows that
 $2{\rm\pi}$
is indeed the value of the lift magnitude at
$2{\rm\pi}$
is indeed the value of the lift magnitude at
 $k=0$
. At low reduced frequency the lift is rotating counter-clockwise (phase negative) due to the dominant action of the circulatory contribution. Instead, for higher reduced frequencies, the dominant apparent mass contribution, proportional to the airfoil acceleration, causes the advance (phase positive) of the lift. In particular, the phase curve, figure 2(b), shows a change of slope followed by a point where the phase curve crosses the zero value at
$k=0$
. At low reduced frequency the lift is rotating counter-clockwise (phase negative) due to the dominant action of the circulatory contribution. Instead, for higher reduced frequencies, the dominant apparent mass contribution, proportional to the airfoil acceleration, causes the advance (phase positive) of the lift. In particular, the phase curve, figure 2(b), shows a change of slope followed by a point where the phase curve crosses the zero value at
 $k=0.144$
, which is referred to in the following as the phase inversion point. In this situation the amplitude of the hysteresis cycle is null. For larger values of
$k=0.144$
, which is referred to in the following as the phase inversion point. In this situation the amplitude of the hysteresis cycle is null. For larger values of
 $k$
, the cycle orientation is clockwise.
$k$
, the cycle orientation is clockwise.

Figure 2. Lift coefficient at various reduced frequencies for a unitary pitch oscillation: (a) magnitude, (b) phase.
By taking the above Theodorsen result as the baseline, the effects of a non-zero airfoil thickness on the aerodynamic loads are assessed in the following sections for pitching movement only. To avoid the analytical or semi-analytical solution of the potential (2.1) with the boundary conditions (2.24), a finite-volume CFD solver based on RANS/Euler equation models is used to compute the aerodynamic loads, without introducing any undue simplification when compared to a wind tunnel test campaign. In § 3, the solver capabilities in reproducing the flow of interest are assessed. In § 4, numerical results are presented and discussed.
3. Numerical simulation of pitching airfoils
The numerical simulations of the unsteady oscillation of a pitching airfoil were carried out using the ROSITA flow solver (see Biava Reference Biava2007), a finite-volume Euler/RANS solver for moving, overset, multi-block grids. The equations of motion are discretized in space by means of a cell-centred finite-volume implementation of either the scheme of Roe (Reference Roe1981) or the one proposed by Jameson, Schmidt & Turkel (Reference Jameson, Schmidt and Turkel1981). Second-order accuracy in space in smooth flow regions is obtained by MUSCL extrapolation using the modified version of the Van Albada limiter introduced by Venkatakrishnan (see Venkatakrishnan & Mavriplis Reference Venkatakrishnan and Mavriplis1996). The viscous terms are computed by applying the Gauss theorem and using a centred approximation scheme. Time integration is carried out with a dual-time formulation, employing a second-order backward differentiation formula (BDF) to approximate the time derivative and a fully unfactored implicit scheme in the pseudo-time. The generalized conjugate gradient (GCG), in conjunction with a block incomplete lower–upper preconditioner, is used to solve the resulting linear system. Details of the implementation can be found in Biava (Reference Biava2007), Drikakis et al. (Reference Drikakis, Zhong, Barakos, Steijl, Biava, Vigevano, Brocklehurst, Boelens, Dietz, Embacher, Khier and Antoniadis2012) and Khier, Vigevano & Biava (Reference Khier, Vigevano and Biava2012).

Figure 3. Lift coefficient history for the NACA 0012 airfoil with
 $k=0.4$
,
$k=0.4$
,
 $\mathit{Ma}=0.1$
,
$\mathit{Ma}=0.1$
,
 $\mathit{Re}=10^{6}$
,
$\mathit{Re}=10^{6}$
,
 ${\it\alpha}_{0}=0^{\circ }$
and
${\it\alpha}_{0}=0^{\circ }$
and
 ${\it\alpha}_{m}=6.7^{\circ }$
. (a) Comparison with experiments of Halfman (Reference Halfman1952) and numerical computations of Lin et al. (Reference Lin, Baker, Martinelli and Jameson2006). (b) Comparison with the analytical models of Theodorsen (Reference Theodorsen1931) and McCroskey (Reference McCroskey1973).
${\it\alpha}_{m}=6.7^{\circ }$
. (a) Comparison with experiments of Halfman (Reference Halfman1952) and numerical computations of Lin et al. (Reference Lin, Baker, Martinelli and Jameson2006). (b) Comparison with the analytical models of Theodorsen (Reference Theodorsen1931) and McCroskey (Reference McCroskey1973).
Unsteady computations were performed to simulate the behaviour of a symmetrical airfoil pitching around its
 $c/4$
point (approximately the aerodynamic centre of the airfoil). The general form of the harmonic law used in this case is
$c/4$
point (approximately the aerodynamic centre of the airfoil). The general form of the harmonic law used in this case is
 $$\begin{eqnarray}{\it\alpha}={\it\alpha}_{0}+{\it\alpha}_{m}\sin ({\it\omega}t),\end{eqnarray}$$
where
 ${\it\alpha}_{0}$
is the mean angle,
${\it\alpha}_{0}$
is the mean angle,
 ${\it\alpha}_{m}$
is the maximum magnitude of the oscillation and
${\it\alpha}_{m}$
is the maximum magnitude of the oscillation and
 ${\it\omega}$
is the frequency. To assess the reliability of ROSITA unsteady solutions, a comparison of Theodorsen’s model, numerical and experimental data was performed.
${\it\omega}$
is the frequency. To assess the reliability of ROSITA unsteady solutions, a comparison of Theodorsen’s model, numerical and experimental data was performed.
Figure 3(a) reports the lift hysteresis curves obtained for the NACA 0012 with
 $k=0.4$
,
$k=0.4$
,
 $\mathit{Ma}=0.1$
,
$\mathit{Ma}=0.1$
,
 $\mathit{Re}=10^{6}$
,
$\mathit{Re}=10^{6}$
,
 ${\it\alpha}_{0}=0$
and
${\it\alpha}_{0}=0$
and
 ${\it\alpha}_{m}=6.7^{\circ }$
. The experimental results for this case are reported by Halfman (Reference Halfman1952), and were used as a benchmark for numerical computation by Lin et al. (Reference Lin, Baker, Martinelli and Jameson2006). Viscous and inviscid fluid simulations were carried out with the ROSITA solver for comparison. The viscous fluid simulation required a finer grid (
${\it\alpha}_{m}=6.7^{\circ }$
. The experimental results for this case are reported by Halfman (Reference Halfman1952), and were used as a benchmark for numerical computation by Lin et al. (Reference Lin, Baker, Martinelli and Jameson2006). Viscous and inviscid fluid simulations were carried out with the ROSITA solver for comparison. The viscous fluid simulation required a finer grid (
 $[400+80]\times 70$
C-type structured mesh, with 400 elements over the airfoil, 80 elements along the wake and 70 elements in the normal directions), accounting for the boundary layer. In this case the Spalart & Allmaras (Reference Spalart and Allmaras1994) turbulence model was used to represent the Reynolds stress tensor of the RANS. In the inviscid case it was possible to use a coarser grid (
$[400+80]\times 70$
C-type structured mesh, with 400 elements over the airfoil, 80 elements along the wake and 70 elements in the normal directions), accounting for the boundary layer. In this case the Spalart & Allmaras (Reference Spalart and Allmaras1994) turbulence model was used to represent the Reynolds stress tensor of the RANS. In the inviscid case it was possible to use a coarser grid (
 $[300+60]\times 40$
C-type structured mesh), hence reducing significantly the computational burden. The viscous results show a somewhat higher error, probably due to the still insufficient grid refinement. Since we are interested in investigating a phenomenon where viscosity is expected to have a limited impact, the inviscid set of equations was chosen to reduce the computational burden. Figure 3(b) shows how Theodorsen’s model does not match exactly the experimental hysteresis amplitude. The model of McCroskey (Reference McCroskey1973), including a steady-state correction for thickness effects, does not show significant improvements over Theodorsen’s model in reproducing the experimental results in this condition.
$[300+60]\times 40$
C-type structured mesh), hence reducing significantly the computational burden. The viscous results show a somewhat higher error, probably due to the still insufficient grid refinement. Since we are interested in investigating a phenomenon where viscosity is expected to have a limited impact, the inviscid set of equations was chosen to reduce the computational burden. Figure 3(b) shows how Theodorsen’s model does not match exactly the experimental hysteresis amplitude. The model of McCroskey (Reference McCroskey1973), including a steady-state correction for thickness effects, does not show significant improvements over Theodorsen’s model in reproducing the experimental results in this condition.
The difference in the pressure coefficient between the upper and lower side of the airfoil was computed for the same case. Figure 4 compares the results obtained by means of ROSITA with those obtained by using the formulation of Küssner & Schwarz (Reference Küssner and Schwarz1941), which is based on the same approach used by Theodorsen but provides local pressure distributions, and the formulation presented by McCroskey (Reference McCroskey1973), which includes the effects of thickness in the reference flow. Some differences in the thin-airfoil solutions with respect to the CFD are visible not only in the nose area, where these are expected due to the flat-plate approximation, but also in the central part of the airfoil.

Figure 4. Difference in pressure coefficient between the upper and lower side of the airfoil for the NACA 0012 airfoil with
 $k=0.4$
,
$k=0.4$
,
 $\mathit{Ma}=0.1$
,
$\mathit{Ma}=0.1$
,
 $\mathit{Re}=10^{6}$
,
$\mathit{Re}=10^{6}$
,
 ${\it\alpha}_{0}=0^{\circ }$
and
${\it\alpha}_{0}=0^{\circ }$
and
 ${\it\alpha}_{m}=6.7^{\circ }$
. Distributions at (a)
${\it\alpha}_{m}=6.7^{\circ }$
. Distributions at (a)
 ${\it\alpha}=0$
(upstroke phase), (b)
${\it\alpha}=0$
(upstroke phase), (b)
 ${\it\alpha}=0$
(downstroke phase), and (c)
${\it\alpha}=0$
(downstroke phase), and (c)
 ${\it\alpha}=6.7$
(maximum angle of attack).
${\it\alpha}=6.7$
(maximum angle of attack).
Results in figures 3 and 4 highlight that the Theodorsen and McCroskey models show some errors in the prediction the aerodynamic loads for airfoils of finite thickness, both in terms of local distributions and integral coefficients. As a consequence, only the CFD code ROSITA is used in the following to quantify the thickness contribution.
A second numerical test at a higher Mach number was considered. The conditions were:
 $k=0.0814$
,
$k=0.0814$
,
 $\mathit{Ma}=0.755$
,
$\mathit{Ma}=0.755$
,
 ${\it\alpha}_{0}=0.016^{\circ }~{\it\alpha}_{m}=2.51^{\circ }$
. This test condition was taken as benchmark in the work by Venkatakrishnan & Mavriplis (Reference Venkatakrishnan and Mavriplis1996) and are extracted from the report VV. AA. (1982). Figure 5 shows a good overlapping between the ROSITA and Venkatakrishnan & Mavriplis (Reference Venkatakrishnan and Mavriplis1996) computations. However, the accuracy with respect to the experimental data is poor in both cases, probably due to an offset in the mean angle of attack. Additionally, the hysteresis cycle resulting from the Theodorsen formulation is shown. As expected, this incompressible flat-plate formulation fails in predicting the unsteady airloads, when not negligible compressibility effects are encountered.
${\it\alpha}_{0}=0.016^{\circ }~{\it\alpha}_{m}=2.51^{\circ }$
. This test condition was taken as benchmark in the work by Venkatakrishnan & Mavriplis (Reference Venkatakrishnan and Mavriplis1996) and are extracted from the report VV. AA. (1982). Figure 5 shows a good overlapping between the ROSITA and Venkatakrishnan & Mavriplis (Reference Venkatakrishnan and Mavriplis1996) computations. However, the accuracy with respect to the experimental data is poor in both cases, probably due to an offset in the mean angle of attack. Additionally, the hysteresis cycle resulting from the Theodorsen formulation is shown. As expected, this incompressible flat-plate formulation fails in predicting the unsteady airloads, when not negligible compressibility effects are encountered.

Figure 5. Lift coefficient history for the NACA 0012 airfoil with
 $k=0.0814$
,
$k=0.0814$
,
 $\mathit{Ma}=0.755$
,
$\mathit{Ma}=0.755$
,
 ${\it\alpha}_{0}=0.016^{\circ }$
,
${\it\alpha}_{0}=0.016^{\circ }$
,
 ${\it\alpha}_{m}=2.51^{\circ }$
. Comparison between the present numerical results, the CFD results of Venkatakrishnan & Mavriplis (Reference Venkatakrishnan and Mavriplis1996) and the experimental data of VV. AA. (1982). The hysteresis curve computed with the flat-plate incompressible Theodorsen model is also represented.
${\it\alpha}_{m}=2.51^{\circ }$
. Comparison between the present numerical results, the CFD results of Venkatakrishnan & Mavriplis (Reference Venkatakrishnan and Mavriplis1996) and the experimental data of VV. AA. (1982). The hysteresis curve computed with the flat-plate incompressible Theodorsen model is also represented.
Table 1. Test matrix used to study the numerical convergence of the solution. All 27 combinations of the parameters were considered in the simulations in figure 6.
The dependence of the numerical results on both the grid spacing
 ${\rm\Delta}x$
and the time step
${\rm\Delta}x$
and the time step
 ${\rm\Delta}t$
is assessed for different reduced frequencies. Simulations were performed for all possible combinations of parameters reported in table 1. Figure 6 shows the
${\rm\Delta}t$
is assessed for different reduced frequencies. Simulations were performed for all possible combinations of parameters reported in table 1. Figure 6 shows the
 $C_{L}$
amplitude and phase for the points listed in the test matrix computed for the NACA 0004 airfoil together with the Theodorsen model curves. The continuous line is the baseline solution computed for a
$C_{L}$
amplitude and phase for the points listed in the test matrix computed for the NACA 0004 airfoil together with the Theodorsen model curves. The continuous line is the baseline solution computed for a
 $[300+60]\times 40$
C-type structured mesh with 200 time steps for each period. The NACA 0004 was chosen due to its very low thickness (4 %), which resembles Theodorsen’s flat-plate model. Each symbol in figure 6 represents a simulation point. At low reduced frequency values, simulation results are more scattered, thus indicating a strong grid/time step dependence that is not observed at higher reduced frequencies. This is not surprising since, for
$[300+60]\times 40$
C-type structured mesh with 200 time steps for each period. The NACA 0004 was chosen due to its very low thickness (4 %), which resembles Theodorsen’s flat-plate model. Each symbol in figure 6 represents a simulation point. At low reduced frequency values, simulation results are more scattered, thus indicating a strong grid/time step dependence that is not observed at higher reduced frequencies. This is not surprising since, for
 $k\rightarrow 0$
,
$k\rightarrow 0$
,
 ${\rm\Delta}t$
grows if the number of time samples per cycle is kept fixed, and consequently the integration error becomes larger at low reduced frequency. Numerical results are deemed to be satisfactory for the purposes of the present investigation, since they accurately reproduce the flat-plate results at the frequencies of interest. The accuracy of the numerical simulations is confirmed by the
${\rm\Delta}t$
grows if the number of time samples per cycle is kept fixed, and consequently the integration error becomes larger at low reduced frequency. Numerical results are deemed to be satisfactory for the purposes of the present investigation, since they accurately reproduce the flat-plate results at the frequencies of interest. The accuracy of the numerical simulations is confirmed by the
 $C_{L}$
hysteresis curve shown in figure 7, which is practically independent of the grid spacing and the time step.
$C_{L}$
hysteresis curve shown in figure 7, which is practically independent of the grid spacing and the time step.

Figure 6. (a) Amplitude and (b) phase of the
 $C_{L}$
function for the NACA 0004 airfoil (——) compared to the prediction of the Theodorsen model (- - -). The open symbols correspond to results obtained for different grid resolutions and time steps per period (listed in table 1). The filled circles indicate the reduced frequency computed using CFD.
$C_{L}$
function for the NACA 0004 airfoil (——) compared to the prediction of the Theodorsen model (- - -). The open symbols correspond to results obtained for different grid resolutions and time steps per period (listed in table 1). The filled circles indicate the reduced frequency computed using CFD.

Figure 7. Numerical convergence for the NACA 0004 airfoil,
 $k=0.1$
: (a) time convergence, (b) space convergence.
$k=0.1$
: (a) time convergence, (b) space convergence.
4. Results and discussion
To investigate numerically the effect of the airfoil thickness on the loads, unsteady inviscid simulations were carried out for four symmetrical airfoils: NACA 0004, NACA 0012, NACA 0018 and NACA 0024, at different reduced frequencies. Therefore, the maximum thickness ranges from 4 % to 24 % of the airfoil chord. For each airfoil, a value of
 $k$
between 0.01 and 0.75 was considered. The Mach number is
$k$
between 0.01 and 0.75 was considered. The Mach number is
 $\mathit{Ma}=0.117$
, which corresponds to an almost incompressible flow. The mean angle of attack is
$\mathit{Ma}=0.117$
, which corresponds to an almost incompressible flow. The mean angle of attack is
 ${\it\alpha}_{0}=0^{\circ }$
and the oscillation amplitude is
${\it\alpha}_{0}=0^{\circ }$
and the oscillation amplitude is
 ${\it\alpha}_{m}=1.0^{\circ }$
. In the following the results of a few tests are discussed to expose the modification to unsteady loads induced by the airfoil thickness.
${\it\alpha}_{m}=1.0^{\circ }$
. In the following the results of a few tests are discussed to expose the modification to unsteady loads induced by the airfoil thickness.
The results obtained at a reduced frequency below the phase inversion point (
 $k=0.1$
) are shown in figure 8. The hysteresis curves of the NACA 0004 are almost indistinguishable from those computed using Theodorsen’s method. By increasing the airfoil thickness, the amplitude of the hysteresis cycle is increased. The opposite behaviour is experienced for reduced frequencies above the phase inversion point, as shown in figure 9. In this case the increase of thickness causes a reduction of the amplitude of the counter-clockwise hysteresis cycles. Several analyses have been performed by doubling the amplitude of the pitch motion from
$k=0.1$
) are shown in figure 8. The hysteresis curves of the NACA 0004 are almost indistinguishable from those computed using Theodorsen’s method. By increasing the airfoil thickness, the amplitude of the hysteresis cycle is increased. The opposite behaviour is experienced for reduced frequencies above the phase inversion point, as shown in figure 9. In this case the increase of thickness causes a reduction of the amplitude of the counter-clockwise hysteresis cycles. Several analyses have been performed by doubling the amplitude of the pitch motion from
 $1^{\circ }$
to
$1^{\circ }$
to
 $2^{\circ }$
. In particular numerical computations were performed on a NACA 0004 and a NACA 0024 airfoil to check the linearity of the problem. It was found that both the NACA 0004 and the NACA 0024 airfoils exhibit a linear behaviour (see Motta Reference Motta2015). This empirically confirms that the problem can be considered linear for small-amplitude oscillations, at least for maximum thickness up to 24 % of the chord.
$2^{\circ }$
. In particular numerical computations were performed on a NACA 0004 and a NACA 0024 airfoil to check the linearity of the problem. It was found that both the NACA 0004 and the NACA 0024 airfoils exhibit a linear behaviour (see Motta Reference Motta2015). This empirically confirms that the problem can be considered linear for small-amplitude oscillations, at least for maximum thickness up to 24 % of the chord.

Figure 8. Lift coefficient hysteresis curve below the phase inversion point,
 $k=0.1$
.
$k=0.1$
.

Figure 9. Lift coefficient hysteresis curve above the phase inversion point,
 $k=0.5$
.
$k=0.5$
.

Figure 10. Lift coefficient hysteresis curve near (a) the minimum and (b) the maximum angle of attack,
 $k=0.5$
.
$k=0.5$
.

Figure 11. Percentage difference in lift between thick airfoils and the flat plate, evaluated at (a)
 ${\it\alpha}=0$
during the downstroke and (b) the maximum amplitude. The abscissa is the maximum thickness of the airfoil;
${\it\alpha}=0$
during the downstroke and (b) the maximum amplitude. The abscissa is the maximum thickness of the airfoil;
 $k=0.5$
.
$k=0.5$
.
The aerodynamic behavior of thick airfoils can be explained by recalling (2.29), where the airfoil thickness is found to modify the unsteady contribution of the flat-plate model to the boundary conditions. During the downstroke phase
 $\text{d}{\it\alpha}/\text{d}t>0$
, i.e. in the airfoil reference system there is an increment of the angle of attack. The last two terms of (2.29), featuring the same sign, are positive and therefore increase the potential difference between the upper and the lower surface. As the last term of (2.29) is proportional to the airfoil thickness, it results that, for thicker sections, there is a larger increase of the difference in potential and, in turn, in the developed lift. This is consistent with the behaviour exhibited by the hysteresis loops in figures 8 and 9.
$\text{d}{\it\alpha}/\text{d}t>0$
, i.e. in the airfoil reference system there is an increment of the angle of attack. The last two terms of (2.29), featuring the same sign, are positive and therefore increase the potential difference between the upper and the lower surface. As the last term of (2.29) is proportional to the airfoil thickness, it results that, for thicker sections, there is a larger increase of the difference in potential and, in turn, in the developed lift. This is consistent with the behaviour exhibited by the hysteresis loops in figures 8 and 9.
At the maximum and minimum angle of attack (
 ${\it\alpha}=\pm 1^{\circ }$
), where
${\it\alpha}=\pm 1^{\circ }$
), where
 $\text{d}{\it\alpha}/\text{d}t=0$
and the thickness-related term in (2.24) is zero, the overall effect of thickness is null as shown in figure 10 where flat-plate and thick airfoil results are almost coincident. This indicates that the main effect of thickness is due to the kinematic angle of attack rather than to the geometric angle of attack. Figure 11 shows the difference in per cent between the lift coefficient of finite-thickness airfoils and that of the flat plate. This difference is evaluated both at the extremes of the oscillation cycle and at zero angle of attack, in the upstroke and in the downstroke phase. It is clearly visible that, at
$\text{d}{\it\alpha}/\text{d}t=0$
and the thickness-related term in (2.24) is zero, the overall effect of thickness is null as shown in figure 10 where flat-plate and thick airfoil results are almost coincident. This indicates that the main effect of thickness is due to the kinematic angle of attack rather than to the geometric angle of attack. Figure 11 shows the difference in per cent between the lift coefficient of finite-thickness airfoils and that of the flat plate. This difference is evaluated both at the extremes of the oscillation cycle and at zero angle of attack, in the upstroke and in the downstroke phase. It is clearly visible that, at
 ${\it\alpha}=-1^{\circ }$
, the difference in lift between thick airfoils and the flat plate is at least one order of magnitude lower than that visible at zero angle of attack. Additionally, this finding indicates that the main effect induced by the thickness is related to the circulatory part of the lift and not to the added mass, which is proportional to the airfoil acceleration.
${\it\alpha}=-1^{\circ }$
, the difference in lift between thick airfoils and the flat plate is at least one order of magnitude lower than that visible at zero angle of attack. Additionally, this finding indicates that the main effect induced by the thickness is related to the circulatory part of the lift and not to the added mass, which is proportional to the airfoil acceleration.
For the upstroke, namely in the reference frame of the airfoil
 $\text{d}{\it\alpha}/\text{d}t<0$
, the situation is reversed. As a result the last two terms of (2.29) are negative and therefore decrease the difference in potential between the upper and lower side. So, it results that, for thicker sections, a larger decrease in the potential difference is obtained. As a consequence, during the upstroke, the lift developed by thick airfoils is lower than that generated by a flat plate. This is again consistent with the behaviour exhibited by the curves in figures 8 and 9.
$\text{d}{\it\alpha}/\text{d}t<0$
, the situation is reversed. As a result the last two terms of (2.29) are negative and therefore decrease the difference in potential between the upper and lower side. So, it results that, for thicker sections, a larger decrease in the potential difference is obtained. As a consequence, during the upstroke, the lift developed by thick airfoils is lower than that generated by a flat plate. This is again consistent with the behaviour exhibited by the curves in figures 8 and 9.

Figure 12. Difference in pressure coefficient between the upper and the lower side of the airfoil, for several angles of attack along the oscillation cycle. Comparison of the Küssner solution for the flat plate with the numerical results obtained for the NACA 0024 airfoil;
 $k=0.5$
,
$k=0.5$
,
 $\mathit{Re}=10^{6}$
,
$\mathit{Re}=10^{6}$
,
 ${\it\alpha}_{0}=0^{\circ }$
,
${\it\alpha}_{0}=0^{\circ }$
,
 ${\it\alpha}_{m}=1^{\circ }$
. (a)
${\it\alpha}_{m}=1^{\circ }$
. (a)
 ${\it\alpha}=0$
, ust; (b)
${\it\alpha}=0$
, ust; (b)
 ${\it\alpha}\approx 0.6^{\circ }$
, ust; (c)
${\it\alpha}\approx 0.6^{\circ }$
, ust; (c)
 ${\it\alpha}=1^{\circ }$
; (d)
${\it\alpha}=1^{\circ }$
; (d)
 ${\it\alpha}\approx 0.6^{\circ }$
, dst; (e)
${\it\alpha}\approx 0.6^{\circ }$
, dst; (e)
 ${\it\alpha}=0$
, dst; (f)
${\it\alpha}=0$
, dst; (f)
 ${\it\alpha}\approx -0.6^{\circ }$
, dst (ust: upstroke, dst: downstroke).
${\it\alpha}\approx -0.6^{\circ }$
, dst (ust: upstroke, dst: downstroke).
Figure 12 shows the difference in pressure coefficient
 ${\rm\Delta}C_{P}$
between the upper and the lower side, on the NACA 0024 airfoil and on the flat-plate model at different angles of attack over one oscillation cycle for a reduced frequency of
${\rm\Delta}C_{P}$
between the upper and the lower side, on the NACA 0024 airfoil and on the flat-plate model at different angles of attack over one oscillation cycle for a reduced frequency of
 $k=0.5$
, above the phase inversion condition. The
$k=0.5$
, above the phase inversion condition. The
 $C_{P}$
for the flat plate are computed using the model developed in Küssner & Schwarz (Reference Küssner and Schwarz1941). In particular, differences between the flat-plate model and the thick airfoil
$C_{P}$
for the flat plate are computed using the model developed in Küssner & Schwarz (Reference Küssner and Schwarz1941). In particular, differences between the flat-plate model and the thick airfoil
 $C_{P}$
distribution are always observed in the leading-edge area where, as expected, the flat-plate approximation is not applicable (see Barger Reference Barger1975). However, significant differences in the
$C_{P}$
distribution are always observed in the leading-edge area where, as expected, the flat-plate approximation is not applicable (see Barger Reference Barger1975). However, significant differences in the
 $C_{P}$
distribution on the upper and lower side are clearly visible when
$C_{P}$
distribution on the upper and lower side are clearly visible when
 ${\it\alpha}=0$
(upstroke and downstroke), i.e. when the angular velocity is maximum, while at
${\it\alpha}=0$
(upstroke and downstroke), i.e. when the angular velocity is maximum, while at
 ${\it\alpha}=\pm 1^{\circ }$
the difference is limited to the nose area. The differences at the trailing edge are related to the fact that, differently from the method of Küssner & Schwarz (Reference Küssner and Schwarz1941) where the Kutta condition is explicitly imposed, in the CFD solver the fulfillment of the Kutta conditions, both steady and unsteady, is indirectly obtained by the introduction of the artificial viscosity in the inviscid flow equations.
${\it\alpha}=\pm 1^{\circ }$
the difference is limited to the nose area. The differences at the trailing edge are related to the fact that, differently from the method of Küssner & Schwarz (Reference Küssner and Schwarz1941) where the Kutta condition is explicitly imposed, in the CFD solver the fulfillment of the Kutta conditions, both steady and unsteady, is indirectly obtained by the introduction of the artificial viscosity in the inviscid flow equations.

Figure 13. Numerical lift coefficient magnitude versus
 $k$
compared to Theodorsen’s model and to experimental data by Halfman (Reference Halfman1952) and Rainey (Reference Rainey1957).
$k$
compared to Theodorsen’s model and to experimental data by Halfman (Reference Halfman1952) and Rainey (Reference Rainey1957).

Figure 14. Numerical lift phase angle versus
 $k$
compared to Theodorsen’s model and to experimental data by Halfman (Reference Halfman1952) and Rainey (Reference Rainey1957).
$k$
compared to Theodorsen’s model and to experimental data by Halfman (Reference Halfman1952) and Rainey (Reference Rainey1957).
Figures 13 and 14 show the effects of the thickness in terms of the amplitude and the phase of the lift coefficient transfer function. Both the amplitude and the phase retain a qualitative dependence on the reduced frequency that is similar to the flat-plate case, cf. figures 2(a) and 2(b). However, the amplitude increases at low
 $k$
on increasing the thickness and decreases at high reduced frequency, while the phase curves shift to the right, moving the phase inversion point to higher values of
$k$
on increasing the thickness and decreases at high reduced frequency, while the phase curves shift to the right, moving the phase inversion point to higher values of
 $k$
as the thickness is increased. This behaviour is in accordance with the observations above on the lift coefficient curve. Indeed, because of the amplification of the lift coefficient hysteresis due to thickness, phase inversion is observed at larger
$k$
as the thickness is increased. This behaviour is in accordance with the observations above on the lift coefficient curve. Indeed, because of the amplification of the lift coefficient hysteresis due to thickness, phase inversion is observed at larger
 $k$
. It also appears useful to gain further insight into the behaviour of the lift coefficient magnitude at
$k$
. It also appears useful to gain further insight into the behaviour of the lift coefficient magnitude at
 $k=0$
in figure 13. By recalling that the lift magnitude is normalized with respect to that of the input motion (see figure 2
a in § 2), the modulus depicted in figure 13 evaluated at
$k=0$
in figure 13. By recalling that the lift magnitude is normalized with respect to that of the input motion (see figure 2
a in § 2), the modulus depicted in figure 13 evaluated at
 $k=0$
is equal to the slope of the steady
$k=0$
is equal to the slope of the steady
 $C_{L}{-}{\it\alpha}$
curve. Moreover, according to the flat-plate model, this value is
$C_{L}{-}{\it\alpha}$
curve. Moreover, according to the flat-plate model, this value is
 $2{\rm\pi}$
. For airfoils of larger thickness an increase in the value of the lift magnitude at
$2{\rm\pi}$
. For airfoils of larger thickness an increase in the value of the lift magnitude at
 $k=0$
is observed. This is in agreement with the classical steady-state aerodynamics of thick Joukowsky airfoils, where the lift coefficient slope follows the law
$k=0$
is observed. This is in agreement with the classical steady-state aerodynamics of thick Joukowsky airfoils, where the lift coefficient slope follows the law
 $C_{L_{{\it\alpha}}}=2{\rm\pi}(1+0.77t/c)$
, with
$C_{L_{{\it\alpha}}}=2{\rm\pi}(1+0.77t/c)$
, with
 $t$
the maximum airfoil thickness (see for instance Currie Reference Currie2012, chapter 4). This correction is valid for small perturbations so that
$t$
the maximum airfoil thickness (see for instance Currie Reference Currie2012, chapter 4). This correction is valid for small perturbations so that
 $\sin {\it\alpha}\sim {\it\alpha}$
.
$\sin {\it\alpha}\sim {\it\alpha}$
.
The amplitude and the phase of the moment coefficient transfer function are shown in figures 15 and 16, together with the results from Theodorsen’s theory. In this case the disagreement with respect to Theodorsen’s model can be explained by the fact that the aerodynamic centre location is not at
 $c/4$
(a well-known fact already suggested in Leishman (Reference Leishman2006, pp. 437–438)). As a consequence, the circulatory part of the lift has an influence on the moment, showing a dependence of moment coefficient on the airfoil thickness.
$c/4$
(a well-known fact already suggested in Leishman (Reference Leishman2006, pp. 437–438)). As a consequence, the circulatory part of the lift has an influence on the moment, showing a dependence of moment coefficient on the airfoil thickness.

Figure 15. Moment coefficient magnitude versus
 $k$
compared to Theodorsen’s model and to experimental data.
$k$
compared to Theodorsen’s model and to experimental data.

Figure 16. Moment coefficient phase angle versus
 $k$
compared to Theodorsen’s model and to experimental data.
$k$
compared to Theodorsen’s model and to experimental data.
5. Modified Theodorsen’s model for thick airfoils
The numerical experiments presented in the previous section indicate that thick airfoils exhibit a qualitatively similar behaviour to the flat-plate Theodorsen model described in § 2. In the present section, a simplified aerodynamic model for oscillating thick airfoils is therefore derived from the original flat-plate one. In particular, from the previous section, it can be assumed that Theodorsen’s function
 $C(k)$
, (2.33), does not significantly change for thick airfoils. Therefore the new model can be obtained by scaling the formulae (2.30) and (2.31) for the lift and moment coefficients. From empirical observations, the scaling factors are independent of the reduced frequency but depend only on the airfoil thickness.
$C(k)$
, (2.33), does not significantly change for thick airfoils. Therefore the new model can be obtained by scaling the formulae (2.30) and (2.31) for the lift and moment coefficients. From empirical observations, the scaling factors are independent of the reduced frequency but depend only on the airfoil thickness.
Under these assumptions, the lift and moment frequency response functions are modelled by the following modified Theodorsen expressions:
 $$\begin{eqnarray}\displaystyle C_{L}(k,s_{m}) & = & \displaystyle {\rm\pi}b\left[P_{1}^{L}(s_{m})\frac{\dot{{\it\alpha}}}{U}-P_{2}^{L}(s_{m})\frac{ba\ddot{{\it\alpha}}}{U^{2}}\right]\nonumber\\ \displaystyle & & \displaystyle +\,2{\rm\pi}C(k)\left[P_{3}^{L}(s_{m}){\it\alpha}+P_{4}^{L}(s_{m})b\left(\frac{1}{2}-a\right)\frac{\dot{{\it\alpha}}}{U}\right],\end{eqnarray}$$
 $$\begin{eqnarray}\displaystyle C_{m}(k,s_{m}) & = & \displaystyle -\frac{1}{2}{\rm\pi}b\left[P_{1}^{m}(s_{m})\frac{1}{U}\dot{{\it\alpha}}+P_{2}^{m}(s_{m})\frac{b}{2U^{2}}\left(\frac{1}{4}-a\right)\ddot{{\it\alpha}}\right],\end{eqnarray}$$
 $s_{m}$
represents the airfoil thickness. The parameters
$s_{m}$
represents the airfoil thickness. The parameters
 $P_{1}^{L}$
and
$P_{1}^{L}$
and
 $P_{2}^{L}$
and
$P_{2}^{L}$
and
 $P_{1}^{m}$
and
$P_{1}^{m}$
and
 $P_{2}^{m}$
, that depend on the airfoil thickness, are used to fit the added mass terms for the lift and the moment. The parameters
$P_{2}^{m}$
, that depend on the airfoil thickness, are used to fit the added mass terms for the lift and the moment. The parameters
 $P_{3}^{L}$
and
$P_{3}^{L}$
and
 $P_{4}^{L}$
, that depend as well on the airfoil thickness, are used to fit the circulatory part of the lift. The effect on the aerodynamic moment due to the shift of the aerodynamic centre is not explicitly considered, since the moment in (5.2) is computed around the aerodynamic centre of the airfoil.
$P_{4}^{L}$
, that depend as well on the airfoil thickness, are used to fit the circulatory part of the lift. The effect on the aerodynamic moment due to the shift of the aerodynamic centre is not explicitly considered, since the moment in (5.2) is computed around the aerodynamic centre of the airfoil.
The values of the coefficients
 $P_{i}^{L}$
and
$P_{i}^{L}$
and
 $P_{i}^{m}$
for the four NACA airfoils considered in the present work are now discussed. A weighted least-squares fitting procedure is used to compute the values of the
$P_{i}^{m}$
for the four NACA airfoils considered in the present work are now discussed. A weighted least-squares fitting procedure is used to compute the values of the
 $P$
coefficients, considering 17 reduced frequencies ranging from
$P$
coefficients, considering 17 reduced frequencies ranging from
 $k=0.05$
to
$k=0.05$
to
 $k=0.75$
. Notice that higher weights are associated with the points with higher reduced frequency, since they are affected by a smaller numerical error. The coefficients obtained are reported in table 2.
$k=0.75$
. Notice that higher weights are associated with the points with higher reduced frequency, since they are affected by a smaller numerical error. The coefficients obtained are reported in table 2.

Figure 17. Polynomial interpolation of the coefficients of the modified Theodorsen function versus the airfoil thickness.
Table 2. Fitted coefficients for the modified Theodorsen formulae (5.1) and (5.2) for the lift and moment coefficients of thick airfoils, respectively.

The fitting procedure is now extended to the case of an airfoil of arbitrary thickness by using an interpolation of the coefficients computed for the reference airfoils. A fourth-order polynomial is used to interpolate the
 $P_{i}^{L}$
and
$P_{i}^{L}$
and
 $P_{i}^{m}$
coefficients with respect to the maximum thickness to obtain (see figure 17)
$P_{i}^{m}$
coefficients with respect to the maximum thickness to obtain (see figure 17)
 $$\begin{eqnarray}\displaystyle P_{1}^{L}(s_{m}) & = & \displaystyle 1-2.09s_{m}+25.73s_{m}^{2}+160.94s_{m}^{3}-735.68s_{m}^{4},\end{eqnarray}$$
 $$\begin{eqnarray}\displaystyle P_{2}^{L}(s_{m}) & = & \displaystyle 1+3.93s_{m}-64.71s_{m}^{2}+244.47s_{m}^{3}-280.08s_{m}^{4},\end{eqnarray}$$
 $$\begin{eqnarray}\displaystyle P_{3}^{L}(s_{m}) & = & \displaystyle 1+0.31s_{m}-1.65s_{m}^{2}+24.26s_{m}^{3}-77.97s_{m}^{4},\end{eqnarray}$$
 $$\begin{eqnarray}\displaystyle P_{4}^{L}(s_{m}) & = & \displaystyle 1+4.17s_{m}-68.51s_{m}^{2}+75.45s_{m}^{3}+269.26s_{m}^{4},\end{eqnarray}$$
 $$\begin{eqnarray}\displaystyle P_{1}^{m}(s_{m}) & = & \displaystyle 1+1.32s_{m}-24.64s_{m}^{2}+98.24s_{m}^{3}-154.77s_{m}^{4},\end{eqnarray}$$
 $$\begin{eqnarray}\displaystyle P_{2}^{m}(s_{m}) & = & \displaystyle 1-4.92s_{m}+71.09s_{m}^{2}-403.38s_{m}^{3}+756.28s_{m}^{4}.\end{eqnarray}$$
To assess the validity of the obtained interpolation formulae, the symmetric NACA 0020 and the non-symmetric NACA 23012 airfoils are chosen as test cases, each of them oscillating with an amplitude of
 $1^{\circ }$
around zero at several reduced frequencies. The NACA 23012 is selected also to test the reliability of the proposed formulation on slightly cambered airfoils.
$1^{\circ }$
around zero at several reduced frequencies. The NACA 23012 is selected also to test the reliability of the proposed formulation on slightly cambered airfoils.
The hysteresis curves for
 $C_{L}$
and
$C_{L}$
and
 $C_{m}$
, computed with the new formulation, are compared to the numerical results and to the classical Theodorsen formulation. For brevity, only a case with
$C_{m}$
, computed with the new formulation, are compared to the numerical results and to the classical Theodorsen formulation. For brevity, only a case with
 $k=0.5$
is herein reported. Figures 18 and 19 highlight better accordance of the modified model for
$k=0.5$
is herein reported. Figures 18 and 19 highlight better accordance of the modified model for
 $C_{L}$
with the numerical tests compared with the flat-plate Theodorsen model. An increase of the accuracy can be also observed in figures 20 and 21, where the
$C_{L}$
with the numerical tests compared with the flat-plate Theodorsen model. An increase of the accuracy can be also observed in figures 20 and 21, where the
 $C_{m}$
hysteresis curves are reported.
$C_{m}$
hysteresis curves are reported.

Figure 18. NACA 0020
 $C_{L}$
hysteresis curves at
$C_{L}$
hysteresis curves at
 $k=0.5$
. Stars: CFD computations; dashed line: classical Theodorsen model; solid line: modified Theodorsen model.
$k=0.5$
. Stars: CFD computations; dashed line: classical Theodorsen model; solid line: modified Theodorsen model.

Figure 19. NACA 23012
 $C_{L}$
hysteresis curves at
$C_{L}$
hysteresis curves at
 $k=0.5$
. Stars: CFD computations; dashed line: classical Theodorsen model; solid line: modified Theodorsen model.
$k=0.5$
. Stars: CFD computations; dashed line: classical Theodorsen model; solid line: modified Theodorsen model.

Figure 20. NACA 0020
 $C_{m}$
hysteresis curves at
$C_{m}$
hysteresis curves at
 $k=0.5$
. Stars: CFD computations; dashed line: classical Theodorsen model; solid line: modified Theodorsen model.
$k=0.5$
. Stars: CFD computations; dashed line: classical Theodorsen model; solid line: modified Theodorsen model.

Figure 21. NACA 23012
 $C_{m}$
hysteresis curves at
$C_{m}$
hysteresis curves at
 $k=0.5$
. Stars: CFD computations; dashed line: classical Theodorsen model; solid line: modified Theodorsen model.
$k=0.5$
. Stars: CFD computations; dashed line: classical Theodorsen model; solid line: modified Theodorsen model.
5.1. Applicability of the modified Theodorsen model to viscous flows
The modified Theodorsen model devised in the previous section was obtained by neglecting the effect of viscosity, since unsteady flows without major separation were considered. In § 3 it was shown through a comparison with experimental data that the non-separated model also remains valid for large oscillations, for the NACA 0012 up to
 $6^{\circ }$
of oscillation as shown in figure 3(a). Additionally, it was shown that the effects of viscosity are negligible for the NACA 0012.
$6^{\circ }$
of oscillation as shown in figure 3(a). Additionally, it was shown that the effects of viscosity are negligible for the NACA 0012.
Since the modified Theodorsen model proposed in the previous section extends to airfoil thickness up to 24 %, it is important to check if the hypothesis of low relevance of the viscosity up to this thickness is still valid. For this reason several numerical tests were performed with a pitch amplitude of
 $1^{\circ }$
using a RANS viscous model at a reduced frequency of
$1^{\circ }$
using a RANS viscous model at a reduced frequency of
 $k=0.5$
with the NACA 0018, 0020 and 0024 airfoils. The Spalart & Allmaras (Reference Spalart and Allmaras1994) turbulence model is used for viscous computations, which are performed at a Reynolds number of
$k=0.5$
with the NACA 0018, 0020 and 0024 airfoils. The Spalart & Allmaras (Reference Spalart and Allmaras1994) turbulence model is used for viscous computations, which are performed at a Reynolds number of
 $10^{6}$
. The comparison of the hysteresis cycles obtained with and without viscosity are shown in figure 22.
$10^{6}$
. The comparison of the hysteresis cycles obtained with and without viscosity are shown in figure 22.

Figure 22. Comparison of the hysteresis curve obtained by inviscid (Euler) and viscous (
 $\mathit{Re}=10^{6}$
) (NS) CFD models at
$\mathit{Re}=10^{6}$
) (NS) CFD models at
 $k=0.5$
with the flat-plate Theodorsen model results. (a) NACA 0018. (b) NACA 0020. (c) NACA 0024.
$k=0.5$
with the flat-plate Theodorsen model results. (a) NACA 0018. (b) NACA 0020. (c) NACA 0024.
Figure 22 shows that the modification of the hysteresis cycle due the viscosity for attached flow on thick airfoils is less significant than the effect due to the thickness in inviscid flows up to airfoils thicknesses of 18 %. Over 18 % the modification due to viscosity becomes significant. The inclusion of viscosity cause a modification of the slope of the hysteresis cycle only, without affecting the amplitude of the cycle. On the contrary, from the present simulations the inclusion of thickness in an inviscid flow was shown to lead to a change of the amplitude of the hysteresis cycles.
It is possible to speculate that this modification of the slope of the hysteresis due to viscosity may be caused by a shift downstream of the location of the point where the Kutta condition must be enforced, in a similar fashion to what happens for airfoils equipped with Gurney flaps (see Liebeck Reference Liebeck1978; Motta & Quaranta Reference Motta and Quaranta2015). In fact, for thick airfoils, the thickness of the boundary layer at the trailing edge becomes significant, and a small recirculation region appears behind the trailing edge. The shift downstream of the Kutta condition causes an increase of the equivalent chord of the airfoil, which in turns leads to a increase of the apparent reduced frequency. This increase of apparent reduced frequency may explain the change of slope, since there is a direct dependence between the increase of slope of the hysteresis cycle and the increase of reduced frequency, as shown in Leishman (Reference Leishman2006, pp. 434–436). A detailed investigation of these effects is beyond the scope of this work; however, it is possible to affirm that the inclusion of the viscosity leads to further modifications of the loads that are significant only above a thickness of 18 %. Moreover, the effect of viscosity can be accounted for by fine tuning the modified Theodorsen model presented here. In any case, given the nature of the modification of the cycle induced by the viscosity, it not expected that a significant modification of the inversion reduced frequency due to viscosity will be found.
In conclusion, it is possible to state that the presented correction model should be considered valid up to a thickness of 18 %, and to some extent still valid up to a thickness of 24 %, at least regarding the amplitude of the hysteresis cycle. For airfoils with thickness above 18 %, an additional effect due to viscosity on the slope of the hysteresis should be considered.
6. Conclusions
The effects of the airfoil thickness on the aerodynamic loads generated by an harmonic motion were investigated numerically. As expected from a detailed analysis of the boundary conditions, the dependence of the linearized lift and moment coefficient on the thickness was found for the case of pitch movements.
Numerical results obtained using the flow solver ROSITA showed a dependence of the loads on the thickness. In particular, the inversion reduced frequency – at which the phase inversion of the lift coefficient curve occurs – depends on the thickness of the airfoil. The amplitude of the lift hysteresis cycle is larger for thicker airfoils, for reduced frequencies below the inversion frequency, and smaller for reduced frequencies above it. This modification results in a shift of the phase inversion point towards higher reduced frequencies for thicker airfoils.
A fitting procedure was applied to identify a modified Theodorsen linear model that accounts for the airfoil thickness. The flat-plate Theodorsen model was used as a starting point. The resulting simplified model was found to accurately predict the unsteady lift and moment coefficients for symmetric and slightly cambered airfoils of arbitrary thickness, from 4 % to 24 %, in the considered range of reduced frequencies under the assumptions of the small-perturbation theory. Additional modifications due to viscosity, and related to the slope of the hysteresis cycle, have been identified for airfoils with a thickness above 18 %.


