


INTRODUCTION
The eastern Carpathians are the northeasternmost sector of the European Alpine mountain system, which act as a north-south orographic barrier for maritime and continental airflows over central and eastern Europe (Cordoneanu and Banciu, Reference Cordoneanu and Banciu1991; Constantin et al., Reference Constantin, Bojar, Lauritzen and Lundberg2007; Drăguşin et al., Reference Drăguşin, Staubwasser, Hoffmann, Ersek, Onac and Veres2014; Micu et al., Reference Micu, Dumitrescu, Cheval and Birsan2015). This area is, therefore, a key region in central eastern Europe that could be used test the magnitude and extent of the inferred zonal/meridional mode of atmospheric circulation in the European continent during glacial stages. In the eastern Carpathians of Romania (Carpații Orientali in Romanian), only high-altitude mountain massifs located entirely in the northern part of the range, which is referred to as the northern Romanian Carpathians, were glaciated during the Pleistocene (Pawłowski, Reference Pawłowski and du. Congrès Géogr1936; Urdea, Reference Urdea, Ehlers and Gibbard2004; Urdea et al., Reference Urdea, Onaca, Ardelean, Ardelean, Ehlers, Gibbard and Hughes2011; Fig. 1).
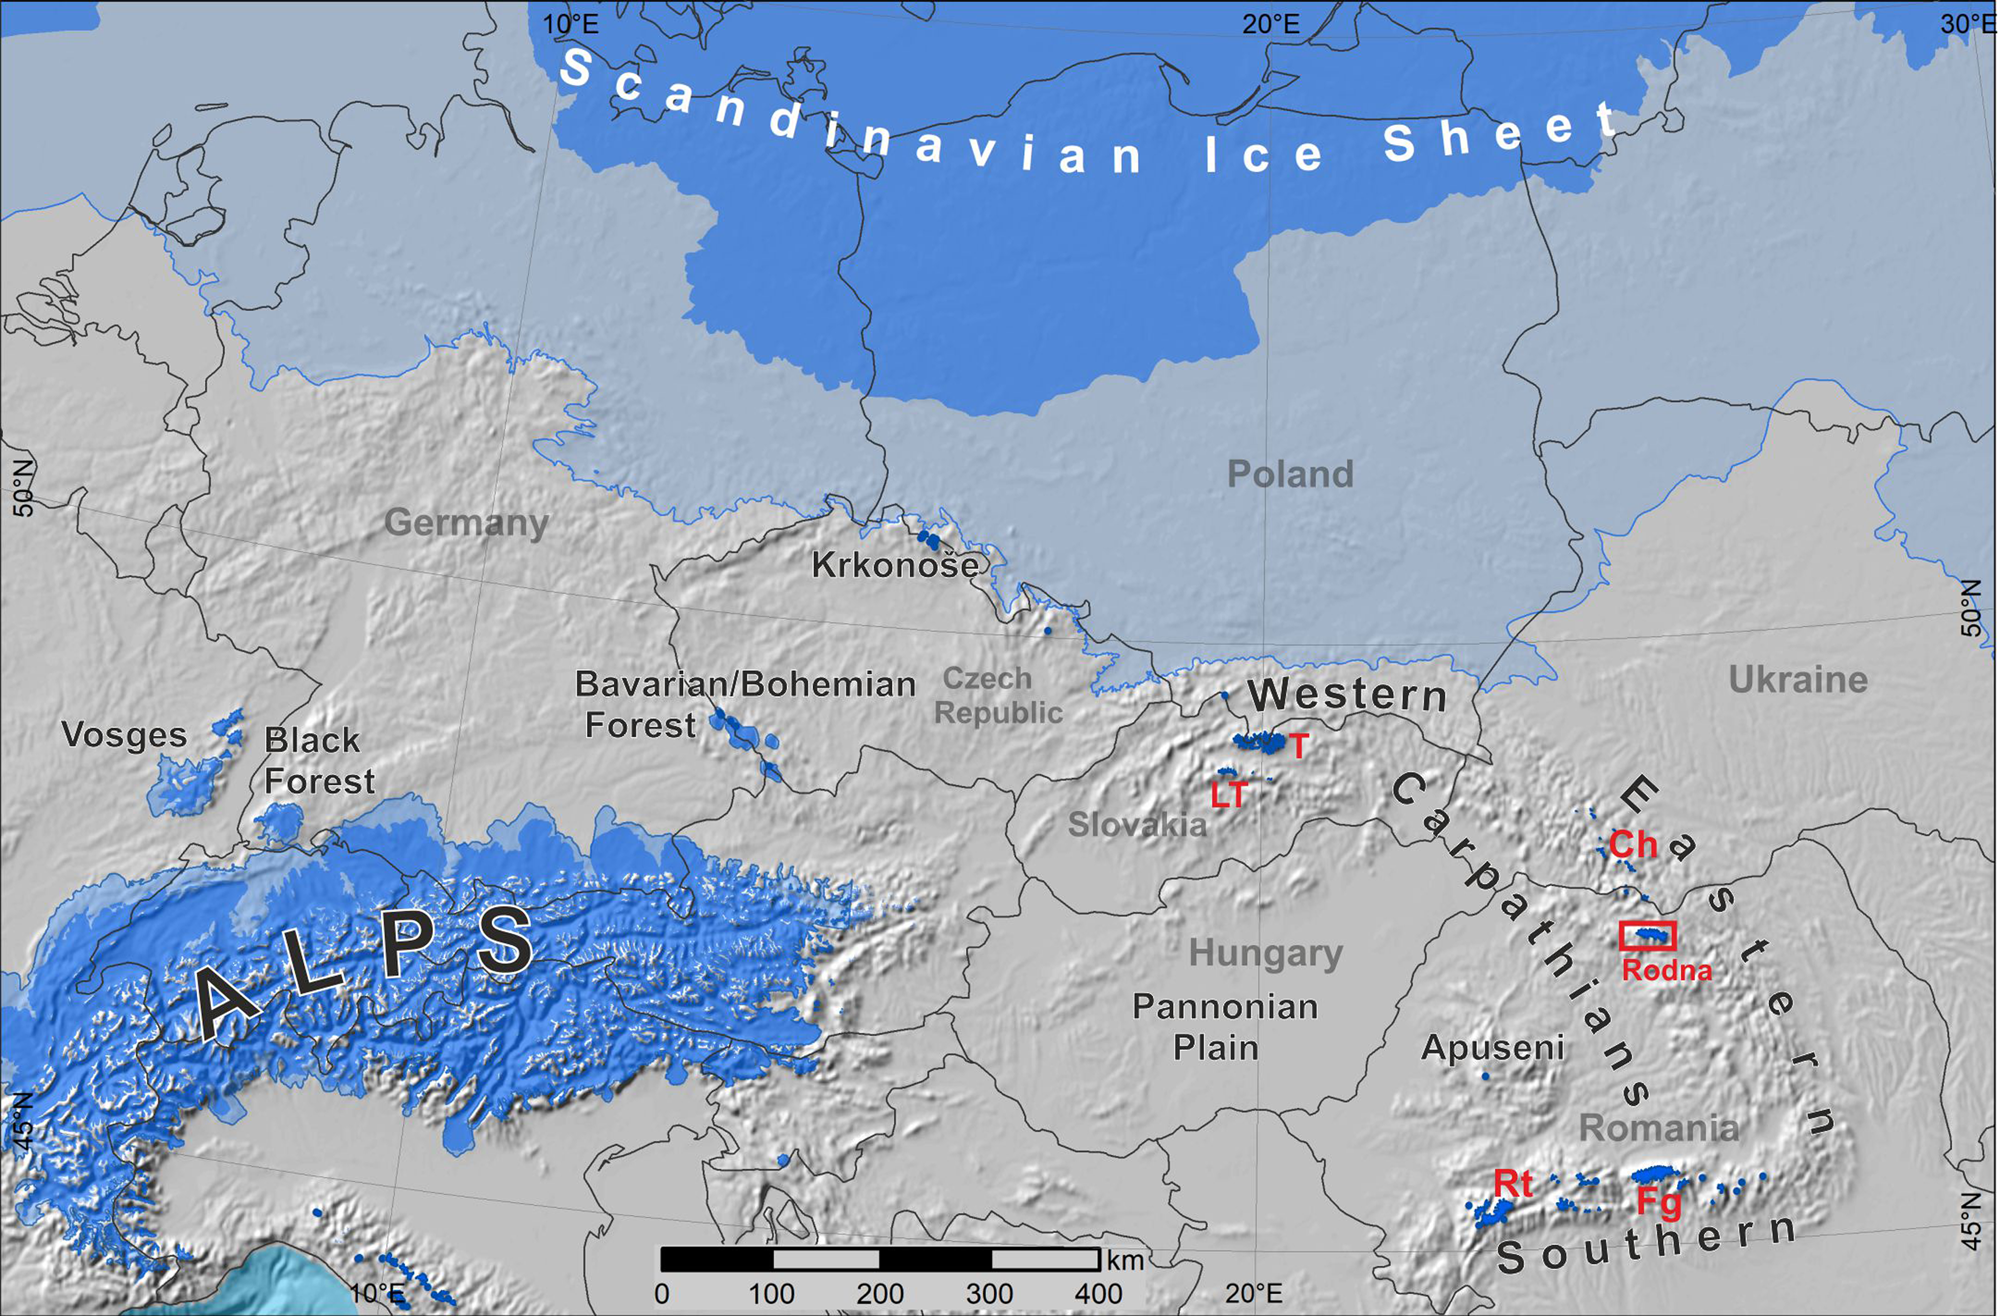
Figure 1. Location of the Rodna Mountains on a map of Quaternary glaciation limits in central Europe. The last glacial maximum ice limit and mountain glaciers are indicated by a darker blue area. The most-extensive ice limit during the Quaternary is indicated by a lighter blue area. Ice limits based on Ehlers et al. (Reference Ehlers, Gibbard and Hughes2011: supplementary digital data, modified in the western Carpathians); base topography from ETOPO (2009, http://www.ngdc.noaa.gov); sea surface lowered to 120 m. Abbreviations: T, Tatra Mountains; LT, Low Tatra Mountains; Ch, Chornohora; Rt, Retezat Mountains; Fg, Fagaraş Mountains. (For interpretation of the references to color in this figure legend, the reader is referred to the web version of this article.)
One such area is the Rodna Mountains (2303 m above sea level [m asl]), the highest range in the eastern Carpathians (Fig. 1). These mountains preserve some of the best glacial landscapes in the region, which have a high potential for research of glacial landforms and processes. This mountain range is regarded in the literature as the glacial pole of the northern Romanian Carpathians (Mîndrescu, Reference Mîndrescu2016). Although glacial landforms were recognised in the Rodna Mountains as early as the late nineteenth century (Lehmann, Reference Lehmann1891), there is still uncertainty regarding both the maximum extent of Pleistocene glaciation (see Supplementary Data 1) and its palaeoclimatic significance, mostly due to the lack of comprehensive mapping of glacial landforms in densely forested areas. According to Gheorghiu (Reference Gheorghiu2012), the local last glacial maximum (LGM) equilibrium line altitude (ELA) was between 900 and 1300 m for Buhăescu and 1250 m for the Pietroasa glaciers (Supplementary Data 1), whereas the ELA estimated by László et al. (Reference László, Kern and Nagy2013) for the same glaciers was around 1735 m. Glacier-based proxy data from the Rodna Mountains were previously used for the continental-scale reconstruction of LGM climates in Europe (Allen et al., Reference Allen, Siegert and Payne2008). Glacial extent was adapted from the global data set of Quaternary glaciations (Urdea, Reference Urdea, Ehlers and Gibbard2004), which shows an extensive ice cap-type glaciation in the Rodna Mountains covering a total area of 156 km2 (Fig. 1). However, such a vast glacial extent is not supported by any previous studies. The great uncertainties in the estimation of the maximal glacial extent and related ELA render the palaeoclimatic inferences questionable and hinder understanding of the regional glacial ELA and the assessment of past climatic trends.
The Rodna Mountains are the only area in the eastern Romanian Carpathians where chronological data are available for glacial history. The results of 10Be cosmogenic exposure dating show that the surface boulders of the lowest moraines at 870–1000 m asl have ages between 37.2 ± 3.4 and 26.6 ± 2.4 ka; thus the major glacial advance occurred during Marine Oxygen Isotope Stage (MIS) 3 and the early phase of the LGM (Gheorghiu, Reference Gheorghiu2012). This is much earlier than documented for the mountain massifs in the western and southern Carpathians, where the maximum ice extent occurred between 26 and 21 ka (Kuhlemann et al., Reference Kuhlemann, Dobre, Urdea, Krumrei, Gachev, Kubik and Rahn2013; Engel et al., Reference Engel, Mentlík, Braucher, Minár, Léanni, Arnold, Aumaître, Bourlès, Keddadouche and Team2015; Ruszkiczay-Rüdiger et al., Reference Ruszkiczay-Rüdiger, Kern, Urdea, Braucher, Balazs, Schimmelpfennig and Team2016; Makos et al., Reference Makos, Rinterknecht, Braucher, Tołoczko-Pasek and Team2018), coincident with the global LGM (26–19 ka; Clark et al., Reference Clark, Dyke, Shakun, Carlson, Clark, Wohlfarth, Mitrovica, Hostetler and McCabe2009; Hughes et al., Reference Hughes, Gibbard and Ehlers2013). According to Gheorghiu (Reference Gheorghiu2012), the asynchronous maximal advance was controlled by specific climatic conditions in northern Romania that restricted glacial advance during the global LGM. However, the geomorphological and chronological significance of these results were questioned by László et al. (Reference László, Kern and Nagy2013) and Popescu et al. (Reference Popescu, Urdea, Vespremeanu-Stroe, Rădoane and and Vespremeanu-Stroe2017), who suggested that these data could represent only the minimal age of boulder deposition.
High-resolution regional climate model simulations for Europe (Strandberg et al., Reference Strandberg, Brandefelt, Kjellström and Smith2011; Ludwig et al., Reference Ludwig, Schaffernicht, Shao and Pinto2016, Reference Ludwig, Pinto, Raible and Shao2017; Pinto and Ludwig, 2018) indicate that the regional pattern of atmospheric circulation exerted considerable influence on temperature and precipitation distribution during the LGM. As the distribution of precipitation at a given altitude is much more spatially variable than temperature and seldom reflected in the proxy data (Feurdean et al., Reference Feurdean, Perşoiu, Tanţău, Stevens, Magyari, Onac and Marković2014; Kerschner et al., Reference Kerschner, Kaser and Sailer2000), the ELA trend of palaeoglaciers provides valuable information concerning the dominant moisture advection and orographically induced precipitation in the past (Allen et al., Reference Allen, Siegert and Payne2008; Kuhlemann et al., Reference Kuhlemann, Rohling, Krumrei, Kubik, Ivy-Ochs and Kucera2008). Glacier mass balance and ELA respond in a sensitive way to changes in summer temperature and annual precipitation, and thus to the regional pattern of ice buildup (Porter, Reference Porter1975; Benn and Lehmkuhl, Reference Benn and Lehmkuhl2000; Rea, Reference Rea2009; Pellitero et al., Reference Pellitero, Rea, Spagnolo, Bakke, Hughes, Ivy-Ochs, Lukas and Ribolini2015; Ohmura and Boettcher, Reference Ohmura and Boettcher2018), and are therefore crucial for validating the results of palaeoclimate model simulations.
The atmospheric circulation in central eastern Europe during the LGM is discussed in the literature based on multiproxy palaeoclimatic data (Buggle et al., Reference Buggle, Glaser, Zöller, Hambach, Marković, Glaser and Gerasimenko2008; Bokhorst et al., Reference Bokhorst, Vandenberghe, Sümegi, Łanczont, Gerasimenko, Matviishina, Markovič and Frechen2011; Sümegi et al., Reference Sümegi, Magyari, Dániel, Molnár and Tőrőcsik2013; Magyari et al., Reference Magyari, Veres, Wennrich, Wagner, Braun, Jakab and Karátson2014, Rousseau et al., Reference Rousseau, Svensson, Bigler, Sima, Peder, Steffensen and Boers2017) and has been modelled with computer simulations (Ludwig et al., Reference Ludwig, Schaffernicht, Shao and Pinto2016, Reference Ludwig, Pinto, Raible and Shao2017; Pinto and Ludwig, Reference Pinto and Ludwig2020). A southward movement of the polar front and associated southern circulation pattern during the LGM was evident in the Alps and Mediterranean region (Florineth and Schlüchter, Reference Florineth and Schlüchter2000; Kuhlemann et al., Reference Kuhlemann, Rohling, Krumrei, Kubik, Ivy-Ochs and Kucera2008; Luetscher et al., Reference Luetscher, Boch, Sodemann, Spötl, Cheng, Edwards, Frisia, Hof and Müller2015; Monegato et al., Reference Monegato, Scardia, Hajdas, Rizzini and Piccin2017; Baroni et al., Reference Baroni, Guidobaldi, Salvatore, Christl and Ivy-Ochs2018), which contrasts with present-day conditions in these regions. Similarly, some ELA proxy-based data from the Carpathians (Kuhlemann et al., Reference Kuhlemann, Dobre, Urdea, Krumrei, Gachev, Kubik and Rahn2013; Makos et al., Reference Makos, Dzierżek, Nitychoruk and Zreda2014; Ruszkiczay-Rüdiger et al., Reference Ruszkiczay-Rüdiger, Madarász, Kern, Urdea, Braucher and Team2017; Marks et al., Reference Marks, Makos, Szymanek, Woronko, Dzierżek and Majecka2019) suggest reduced northwesterly inflow and increased southerly advection of moist air masses from the Mediterranean region. Other studies (Gheorghiu, Reference Gheorghiu2012) highlight the important role of northeasterly cold and dry air masses associated with the Eurasian ice sheet. This contrasts with model simulation results that imply enhanced North Atlantic storm track activity over central Europe (Laîné et al., Reference Laîné, Kageyama, Salas-Mélia, Voldoire, Riviere, Ramstein and Planton2009; Hofer et al., Reference Hofer, Raible, Merz, Dehnert and Kuhlemann2012; Luetscher et al., Reference Luetscher, Boch, Sodemann, Spötl, Cheng, Edwards, Frisia, Hof and Müller2015) and an overall increase in the number and intensity of cyclones (Ludwig et al., Reference Ludwig, Schaffernicht, Shao and Pinto2016; Pinto and Ludwig, 2018).
This paper aims to present the geomorphological record of Pleistocene glaciation in the Rodna Mountains and to reconstruct glacial geometry and associated ELA during the local LGM. Based on ELA trends, we discuss the atmospheric circulation pattern during the local glacial maximum. Additionally, geomorphological and sedimentologic characteristics allow us to document the legacy of older glaciation beyond the LGM terminal moraines. Based on the morphological freshness and Schmidt hammer (SH) weathering index, we discuss the chronological position of older glacial deposits.
STUDY AREA
The Rodna Mountains (area ca. 950 km2) are located in northern Romania and represent the highest mountain range in the eastern Carpathians, reaching a maximum elevation of 2303 m asl at the top of Pietrosu Peak (Fig. 1). The west-east-aligned main ridge, with a mean elevation of 1770 m asl, stretches longitudinally over 55 km and separates the Vişeu and Bistrița Aurie valleys in the north from the Someşul Mare valley to the south.
The Rodna Mountains are part of the inner eastern Carpathians and appear as a horst of the crystalline basement of the Dacia tectonic mega-unit, built up by the Bucovinian nappe stack (Subbucovinian and Infrabucovinian nappes) (Schmid et al., Reference Schmid, Bernoulli, Fügenschuh, Matenco, Schefer, Schuster, Tischler and Ustaszewski2008). The Rodna horst is delineated by the Rodna Fault to the south (Someșul Mare Fault) and Bogdan-Dragoş Vodă Fault system to the north (Tischler et al., Reference Tischler, Gröger, Fügenschuh and Schmid2007; Supplementary Fig. S1). The Rodna form a monoclinal block (megacuesta) tilted gently (ca. 5°) towards the southwest with strong north-south morphological asymmetry. The asymmetry is expressed in the higher inclination of the northern slopes, which cut rock bedding edges, and in generally shorter and steeper northern valleys compared with south-facing deeply incised valleys (Sîrcu, Reference Sîrcu1978). The structurally controlled asymmetry was emphasized by the activity of glacial processes.
Due to its high altitude and competent crystalline basement, the mountain range features a typical alpine landscape and displays the most pronounced glacial morphology within the eastern Carpathians, concentrated mainly on the northern slope of the range (Sawicki, Reference Sawicki1911; Sîrcu, Reference Sîrcu1978; Fig. 2). The northern slope is deeply dissected by valley-head and compound cirques surrounded by headwalls up to 300–350 m high, and glacial trough valleys with stepped longitudinal profiles and bottoms covered by glacial deposits. The glacial sculpted landscape extends down to 1100–1050 m asl, and locally in the Pietroasa and Fântâna Valleys even down to 900–850 m asl (Sawicki, Reference Sawicki1911; Sîrcu, Reference Sîrcu1978; Urdea, Reference Urdea, Ehlers and Gibbard2004). In contrast, shallow cirques and cirque moraines are present on the gentle, smooth southern slopes. A total 53 glacial cirques were recognized in the Rodna Mountains by Mîndrescu and Evans (Reference Mîndrescu and Evans2014) and Mîndrescu (Reference Mîndrescu2016); they represent the largest examples in the Romanian Carpathians, with areas of up to 3.78 km2: mean length and width are 1988 and 2124 m, respectively (Mîndrescu and Evans, Reference Mîndrescu and Evans2014; Mîndrescu, Reference Mîndrescu2016). The average altitude of cirque floors is 1749 m asl The dominant northeast cirque aspect corresponds to the eastward tendency in snow drifting. Two recessional stages were identified in the north-exposed valleys in the form of latero-frontal moraines (Sawicki, Reference Sawicki1911; Sîrcu, Reference Sîrcu1978). The age of the older-stage moraines is unknown, whereas the highest located, small moraines (1800–1950 m asl) were dated with cosmogenic 10Be between 13 and 11 ka, indicating the last glacial advance occurred during the Younger Dryas (Gheorghiu, Reference Gheorghiu2012).
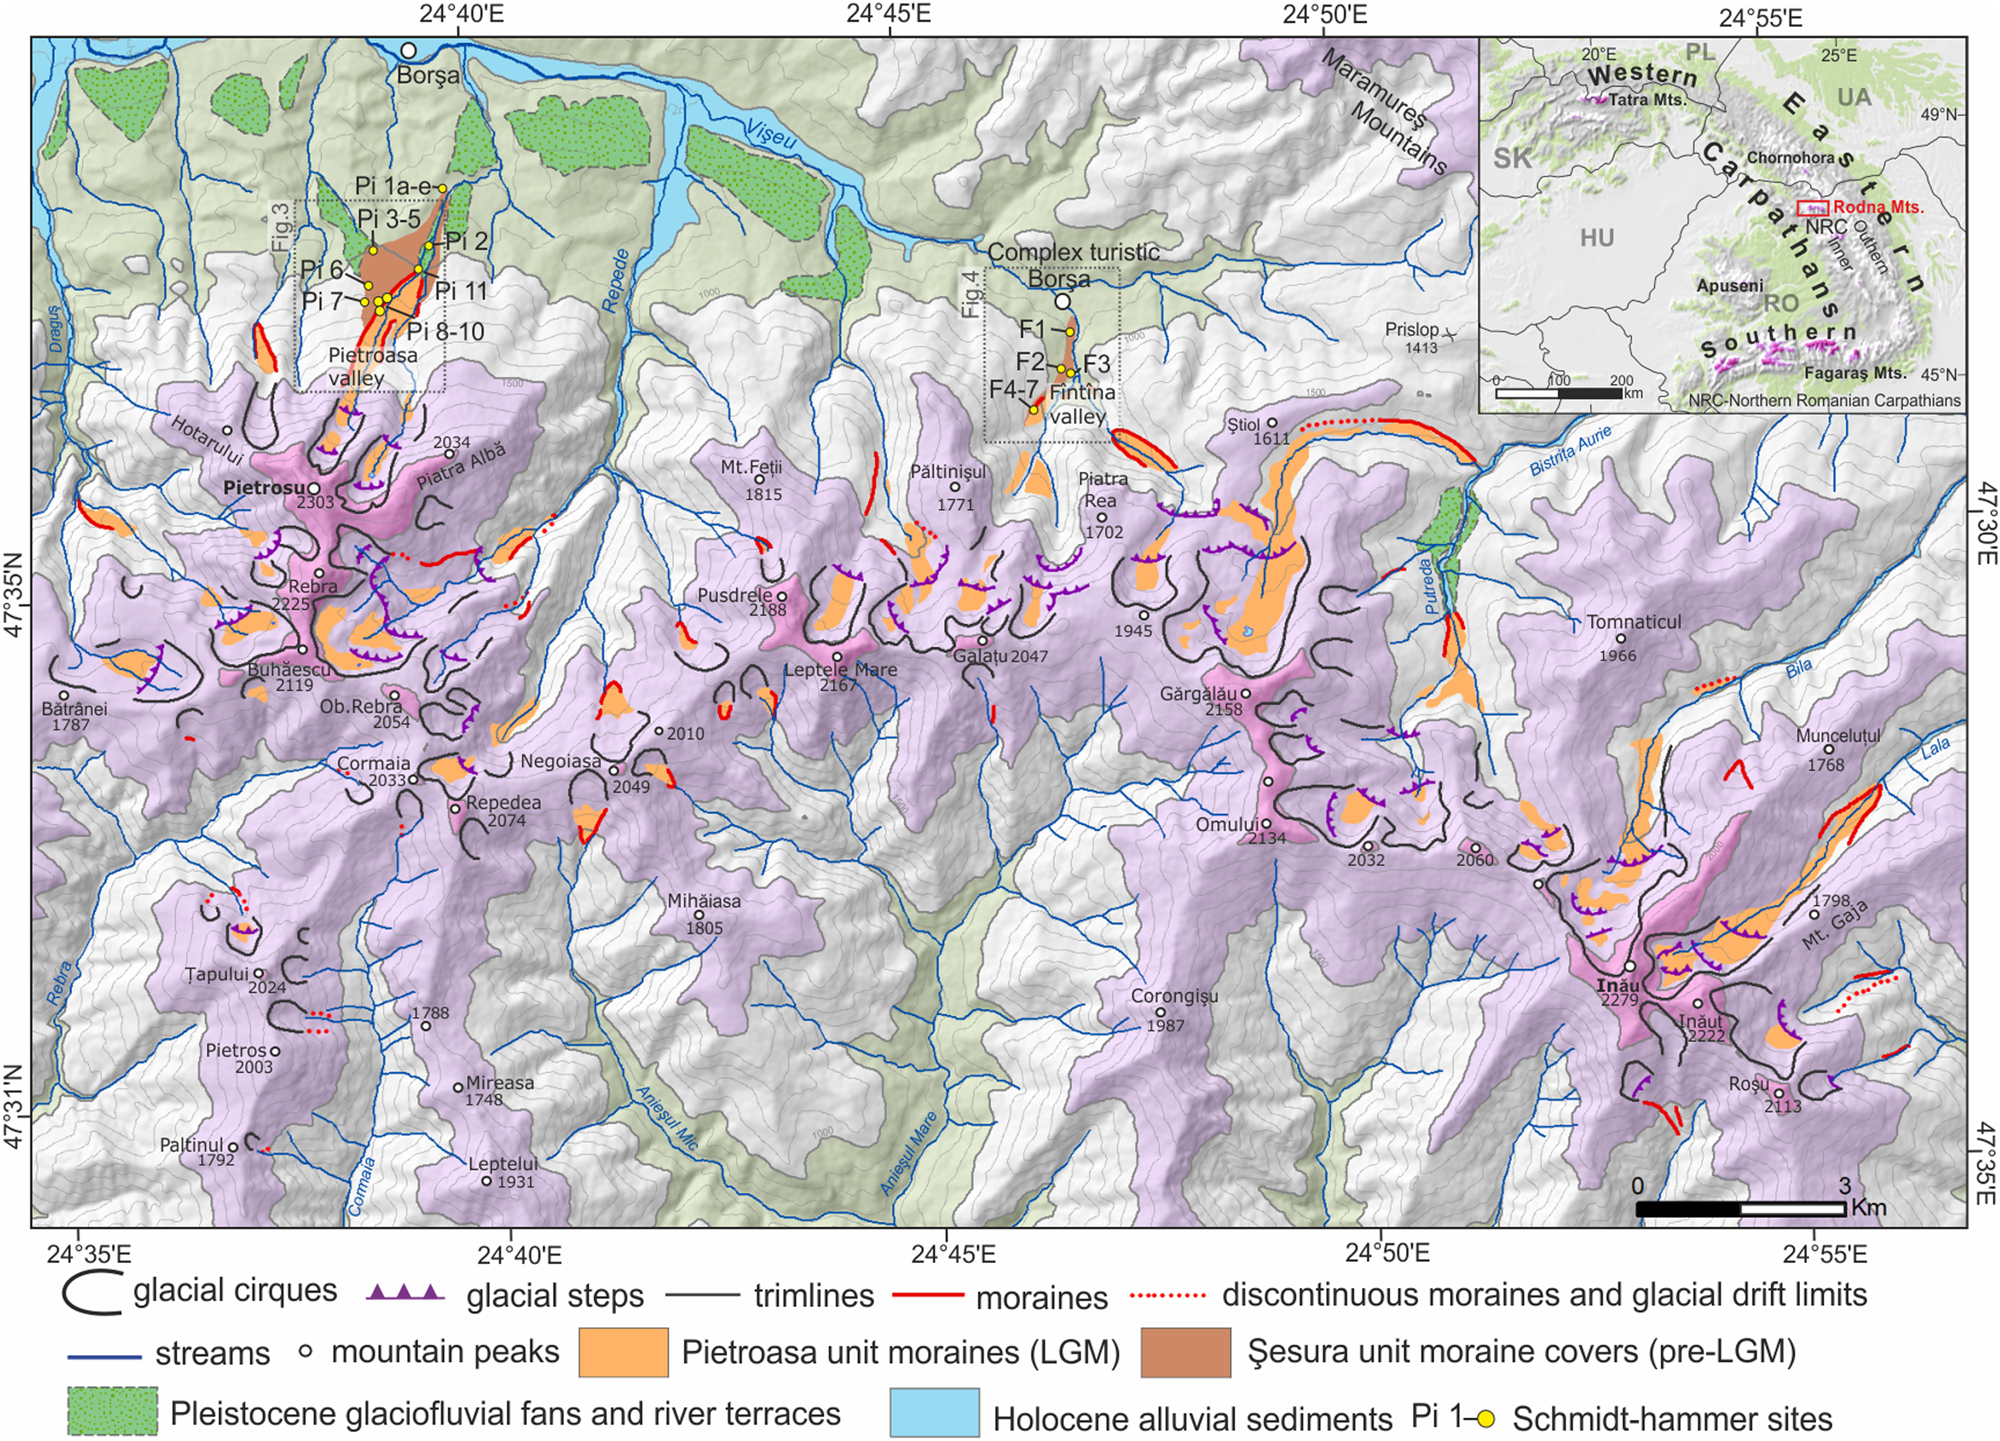
Figure 2. (color online) Schematic geomorphological map of the Rodna Mountains with locations of Schmidt hammer measurement sites marked. Extent of Pleistocene glaciofluvial fans and river terraces after Kräutner et al. (1982, 1983). The Schmidt hammer codes refer to measurements sites listen in Supplementary data 3. LGM, last glacial maximum.
Studies on glaciation in the Rodna Mountains were initiated by Lehmann (Reference Lehmann1891) and were followed by pioneer studies that focused on glacial relief in selected valleys (Czirbusz, Reference Czirbusz1896; Pawłowski and Pokorny, Reference Pawłowski and Pokorny1907; Szilády, Reference Szilády1907; Orghidan, Reference Orghidan1910; de Martonne, Reference Martonne1924; Layos, Reference Layos1927; Varga, Reference Varga1927; Morariu, Reference Morariu1940), and glacial-geomorphological syntheses of the whole range with schematic maps (Sawicki, Reference Sawicki1911; Kräutner, Reference Kräutner1930; Sîrcu, Reference Sîrcu1978; Supplementary Data 1). In recent years, a comprehensive inventory of glacial cirques (Mîndrescu, Reference Mîndrescu2008, Reference Mîndrescu2016; Mîndrescu et al., Reference Mîndrescu, Evans and Cox2010; Mîndrescu and Evans, Reference Mîndrescu and Evans2014) documented several new glaciated areas, especially on the southern slope of the Rodna Mountains. The most recent geomorphological investigations that were concentrated in the northwestern part of the range (Gheorghiu, Reference Gheorghiu2012; László et al., Reference László, Kern and Nagy2013), provide the first GIS-based glacier reconstructions and calculations of ELA based on modern approaches.
The present-day climate of the Rodna Mountains is moderate continental, influenced by maritime air masses moving from the Atlantic Ocean and drier polar-continental air masses from the north and northeast (Dragotă and Kuscicsa, Reference Dragotă and Kucsicsa2011). Mean annual air temperatures change from 6°C–7°C at its foot down to 1.5°C–0°C above 2200 m (Coldea, Reference Coldea1990; Donisa, Reference Donisa2005). The distribution of annual air temperature means for the period 1961–2007 show no differences between opposite slopes (Dragotă and Kuscicsa, Reference Dragotă and Kucsicsa2011). The average summer temperature (June, July, August) reaches 9.8°C at Iezer Pietrosu weather station (1785 m).
The Rodna Mountains are particularly humid for the Romanian Carpathians, as they receive more than 1000–1100 mm of annual precipitation (Micu et al., Reference Micu, Dumitrescu, Cheval and Birsan2015), concentrated mostly on their northern slopes (Sîrcu, Reference Sîrcu1978; Dragotă and Kuscicsa, Reference Dragotă and Kucsicsa2011). The highest precipitation totals occur usually between May and August and are related to low-pressure centres coming from the west. The mean annual precipitation at Iezer Pietrosu weather station (1785 m) reaches ca. 1260 mm, whereas on the 2000-m-high summits, the multiannual mean is estimated between 1200 and 1400 mm (Dragotă and Kuscicsa, Reference Dragotă and Kucsicsa2011). The height of the condensation level is estimated at 1700–1800 m on the westward side of the Rodna Mountains (Dragotă, Reference Dragotă2006). The range is not currently glaciated, and even in the shadiest locations (e.g., Buhăescu Mare cirque), snow patches do not survive the heat of August (Mîndrescu et al., Reference Mîndrescu, Evans and Cox2010; Dragotă and Kuscicsa, Reference Dragotă and Kucsicsa2011).
METHODS
Geomorphological mapping
The glacial geomorphology of the Rodna Mountains was established through detailed geomorphological mapping supported by landform identification on aerial orthoimages (e.g., Google Earth and high-resolution colour orthophoto maps with 0.5 m resolution) and an ALOS PALSAR (source:www.eorc.jaxa.jp) digital elevation model (DEM). The latter, with 25 m horizontal resolution, served as a source of altitudinal information for mapped geomorphological features and as a background for glacier reconstruction. Field mapping was carried out using base maps reproduced from the 1:25,000 topographic maps with a 10 m contour interval and handheld GPS receivers. In the upper parts of glaciated valley systems, the maximal vertical extent of ice surfaces was delimited by the presence of uppermost trimlines and oversteepened parts of cirque backwalls (Zasadni and Kłapyta, Reference Zasadni and Kłapyta2014). Glacial erosional features were traced with the help of field observations, aerial images, and DEM analysis. The terminal zones of former glaciers were determined based on the presence of ice-marginal landforms (moraine ridges, discontinuous moraines, and glacial drift limits) and sediments (glacial till and large boulders). The mapping of glacial extents in the central Rodna Mountains was additionally enhanced by the lithological contrast between local Palaeozoic metasedimentary bedrock and gneiss-dominated moraine material. Additionally, to characterize sedimentologic properties of moraine sediments in complex metamorphic lithology and determine the possible differences between the glacial sediments of the last and older glaciations, clast shape and roundness were measured. The methodology and results of these analyses are presented in Supplementary Data 2.
Schmidt hammer test
SH rebound values (R-values) were used to determine the measure of surface weathering index of morainic boulders and therefore the relative age of landforms (Matthews and Shakesby, Reference Matthews and Shakesby1984; McCarroll, Reference McCarroll1989; Kłapyta, Reference Kłapyta2013). The degree of surface weathering allows estimates about the length of surface exposure (Černá and Engel, Reference Černa and Engel2011). We used the electronic SilverSchmidt BN-type with R-value unit conversion (Viles et al., Reference Viles, Goudie, Grab and Lalley2011; Winkler and Matthews, Reference Winkler and Matthews2014) with an impact energy of 2.207 Nm. Tests were performed on 22 sites in two glaciated valleys (Fig. 2), where morphostratigraphic relations indicate a double moraine sequence of inner and outer moraines and till covers. The measurements were obtained from visually homogeneous lithology; quartz mica schist boulders in Pietroasa valley and sericite and chlorite schists in Fântâna valley (Supplementary Fig. S2A). Thirty R-values were recorded per site (Niedzielski et al., Reference Niedzielski, Migoń and Placek2009), where six hammer impacts were recorded per boulder from a total of five boulders at each measurement site. Only stable, dry, and near-horizontal boulder surfaces, free of cracks, were chosen (Day and Goudie, Reference Day and Goudie1977; Sumner and Nel, Reference Sumner and Nel2002). Large boulders >50 cm diameter that stand at a minimum of 0.5 m (best = 1.0 m above the topographic surface) were measured. Each rock surface was first brushed using carborundum to clean lichens and remove unevenness from the rock surface (Černá and Engel, Reference Černa and Engel2011; Kłapyta, Reference Kłapyta2013). The standard statistical analysis comprised the calculation of the standard mean, standard error of the mean, median, standard deviation, coefficient of variation, skewness, and kurtosis (cf. Shakesby et al., Reference Shakesby, Matthews and Owen2006; Winkler, Reference Winkler2009; Supplementary Data 3). The mean R-values from measured boulders were averaged, and the resulting value was taken as representative for each moraine unit. Analysis of variance was used to determine whether any differences exist in mean R-value among groups of moraines. The significance of a relationship was tested by F-test with P level 0.05.
Reconstruction of glacial geometries and ELAs
The extent and ice-surface geometry of the LGM glacial advance were reconstructed in a GIS environment based on the distribution of moraines and glacial trimlines that mark the approximation of the ice-surface position (Benn et al., Reference Benn, Owen, Osmaston, Seltzer, Porter and Mark2005). Ice thickness was assessed using a glacier profile model (Benn and Hulton, Reference Benn and Hulton2010) provided in the Pellitero et al. (Reference Pellitero, Rea, Spagnolo, Bakke, Hughes, Ivy-Ochs, Lukas and Ribolini2015) toolbox with the use of 50–100 kPa basal shear stress values (Cuffey and Paterson, Reference Cuffey and Paterson2010) and a calculated valley shape factor. We estimated the glacier's ELA by using the area altitude balance ratio (AABR) method, which is considered to be nonsensitive to glacial hypsometry (Furbish and Andrews, Reference Furbish and Andrews1984; Osmaston, Reference Osmaston2005; Rea, Reference Rea2009; Pellitero et al., Reference Pellitero, Rea, Spagnolo, Bakke, Hughes, Ivy-Ochs, Lukas and Ribolini2015). We applied the global median AABR value of 1.6 calculated by Zasadni et al. (Reference Zasadni, Kłapyta, Broś, Ivy-Ochs, Świąder, Christl and Balážovičová2020) from Rea's (Reference Rea2009) monitored glacier data set. The AABR 1.6 method is commonly used in modern studies in the Alps (Rea, Reference Rea2009; Federici et al., Reference Federici, Ribolini and Spagnolo2016) and the Carpathian–Balkan area (Ruszkiczay-Rüdiger et al., Reference Ruszkiczay-Rüdiger, Madarász, Kern, Urdea, Braucher and Team2017; Temovski et al., Reference Temovski, Madarász, Kern, Milevski and Ruszkiczay-Rüdiger2018; Zasadni et al., Reference Zasadni, Kłapyta, Broś, Ivy-Ochs, Świąder, Christl and Balážovičová2020). To yield the ELA estimation error, we include in the results an elevation range for a global range of AABR of 1.0 to 3.0 (Rea, Reference Rea2009). Our estimation error is in the range of ±30 m, which is similar to what is reported in the literature (cf. Kerschner and Ivy-Ochs Reference Kerschner and Ivy-Ochs2008).
For comparison, we report also median glacier elevation (accumulation area ratio [AAR] 0.5), mean glacier elevation (AABR 1.0 or Kurowski's method; Braithwaite, Reference Braithwaite2015; Pellitero et al., Reference Pellitero, Rea, Spagnolo, Bakke, Hughes, Ivy-Ochs, Lukas and Ribolini2015), and ELA at the size-specific accumulation area ratio (ssAAR) (Kern and László, Reference Kern and László2010). The ssAAR approach is designed to better predict the topoclimatic effect of very small glaciers on ELA.
We present the mean ELA for the Rodna Mountains as the geometric means between the mean ELA of the south- and north-facing glaciers. The simple mean value for all glaciers would include an overrepresentation of ELA of north-facing glaciers due to the strong north-south glaciation asymmetry in the study area. Similarly, due to the small size of south-facing glaciers (<1 km2), the interpretation of the ELA trend was carried out solely for the glaciers on the northern slope of the Rodna Mountains. The basic morphometric and hypsometric parameters of palaeoglaciers, such as the length, aspect, area, maximal and minimal thickness, volume, z min, z max, z med (AAR 0.5), z mean (AABR 1.0) (Zasadni et al., Reference Zasadni, Kłapyta, Broś, Ivy-Ochs, Świąder, Christl and Balážovičová2020) were calculated for each glacier.
RESULTS
Geomorphological record of maximal glaciation in Rodna Mountains
The extent and distribution of glacial landforms are illustrated in Figure 2. In most of the area the maximal glacial extent is recorded as a well-defined system of single latero-frontal moraines. Due to the availability of geomorphological data, 10Be exposure age chronology (Gheorghiu, Reference Gheorghiu2012), as well as the SH weathering index and sedimentologic data (Supplementary Data 2), the Pietroasa valley represents a key stratigraphic locality, where maximal glaciation moraines were subdivided into two morphostratigraphic units: the Şesura unit (older moraines) and the Pietroasa unit (younger moraines) (Fig. 3). This double moraine sequence was recognised only in three valleys (Pietroasa, Fîntîna, and Bistricioara) based on significant differences in landform and relative sediment preservation (Figs. 3 and 4). In this study, the term “LGM” refers to the local LGM.
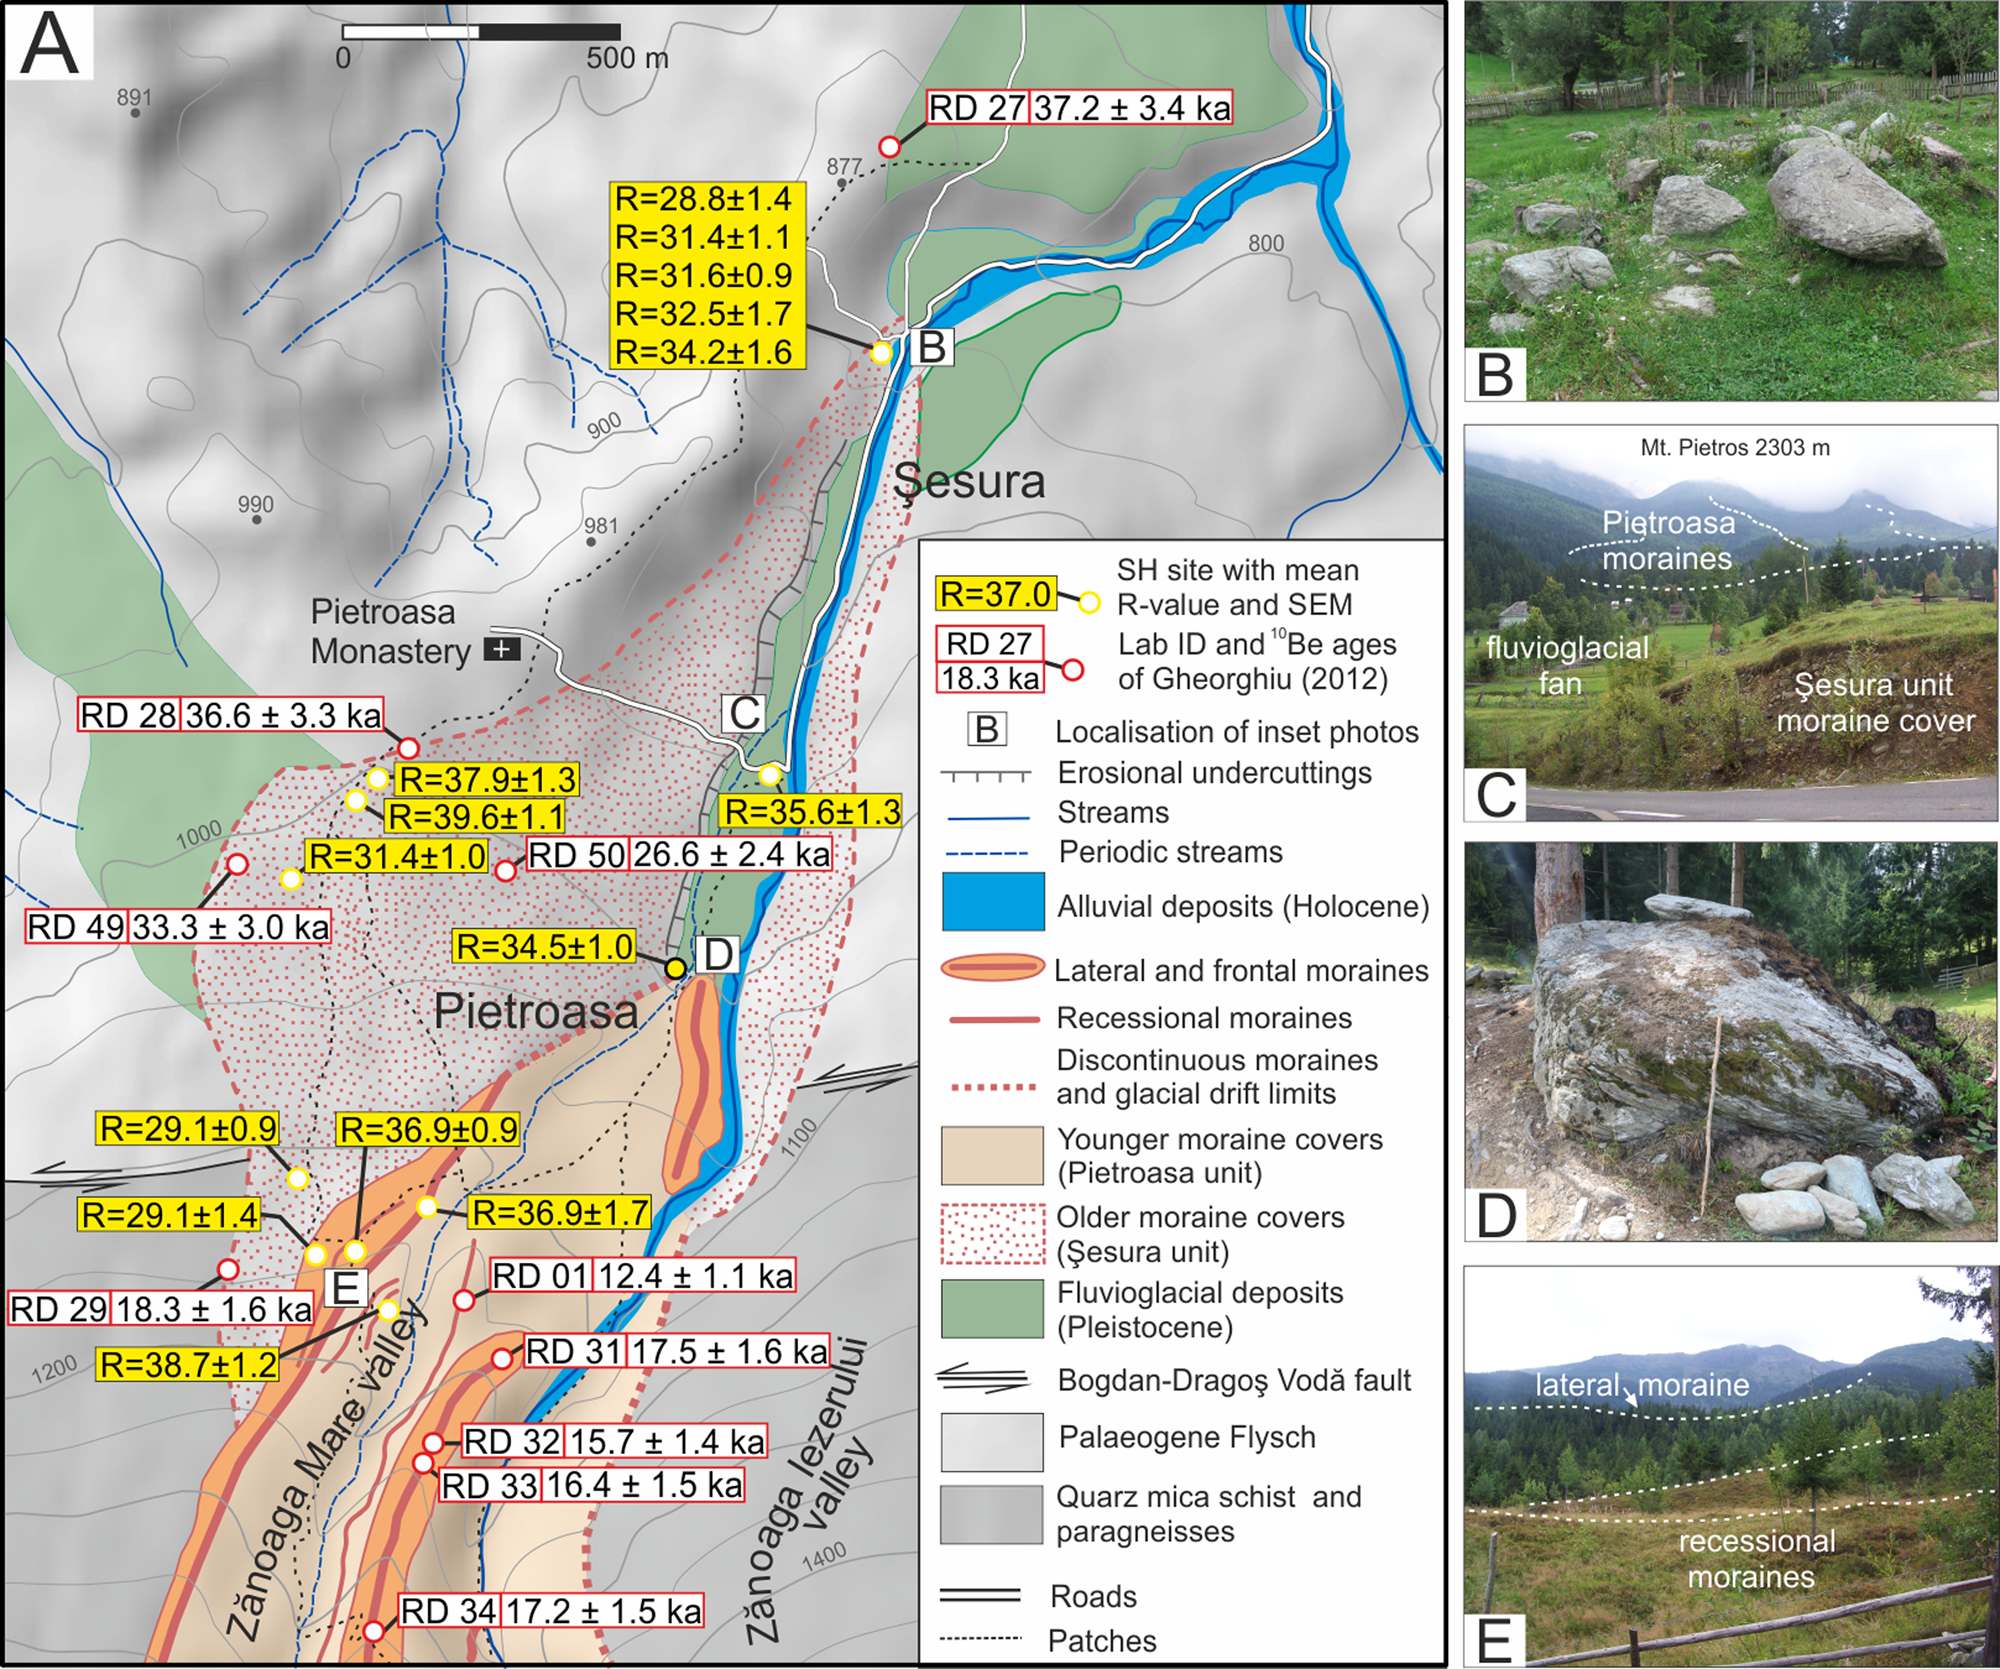
Figure 3. (color online) Spatial distribution of maximal glaciation moraines in Pietroasa valley. (A) Geomorphological map of Pietroasa valley with type localities of double moraine sequence of Şesura and Pietroasa units. The results of 10Be cosmogenic exposure dating (Gheorghiu, Reference Gheorghiu2012) represent single boulder ages. Locations of inset photos B–E are marked on the map. (B) Scattered morainic boulders (max. 3 m in diameter) in the terminal zone of the Şesura unit moraines. (C) Type locality of the Şesura unit glacial deposits (P-2 site, Fig. 1). In the background extent of the Pietroasa unit moraines (last glacial maximum). (D) Large morainic block (3 × 2 m) in the rewashed terminal part of the Pietroasa unit. (E) Distinct right-side ridge of outer moraine and series of inner (recessional) moraines of the Pietroasa unit, photo taken from the crest of the left-side outer moraine.
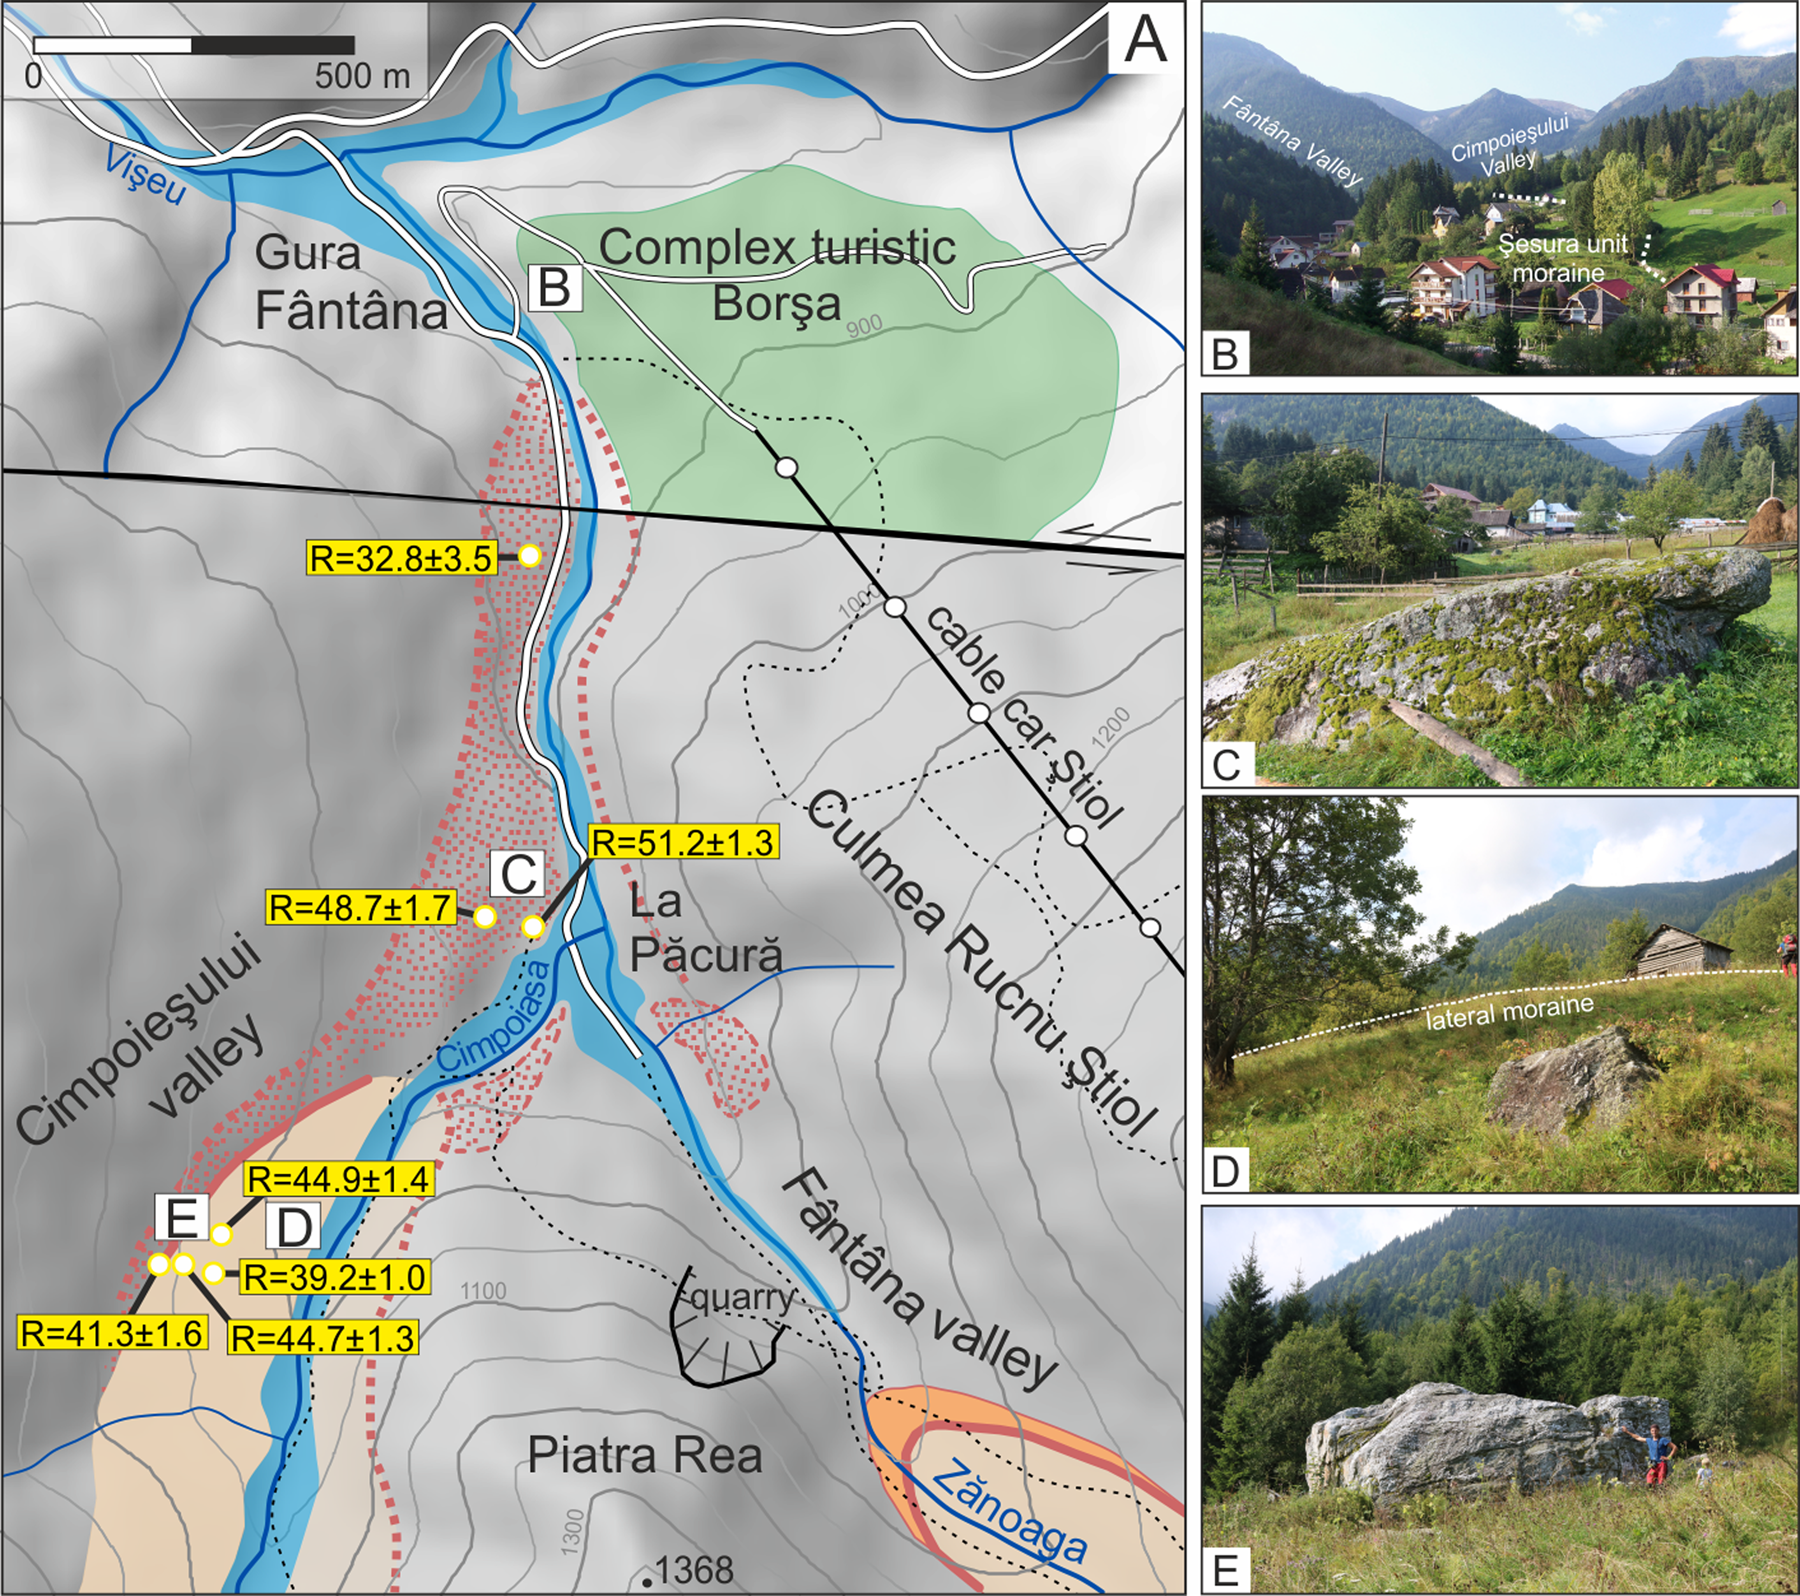
Figure 4. (color online) Spatial distribution of maximal glaciation moraines in Fântâna and Cimpoieşului valleys. (A) Geomorphological map of Fântâna valley and Cimpoieşului valleys with double moraine sequence of Şesura and Pietroasa units. Locations of the inset photos B–E are marked on the map. (B) Terminal zone of the Şesura unit moraine till covers in Fântâna valley. (C) Large superficial morainic boulder (5 × 2 m) on the surface of Şesura unit moraines in the Fântâna valley. (D) Lateral moraine of the Pietroasa unit in Cimpoieşului valley. (E) Large supraglacially transported morainic block (6.3 × 4.4 × 4.1 m) in Cimpoieşului valley.
The Şesura unit represents the most extensive type of glacial deposits in the Rodna (here called the Şesura glacial stage). These highly degraded moraines and till covers (older moraines) were first recognised by Sawicki (Reference Sawicki1911) in the Pietroasa valley. In the Pietroasa and Cimpoieşului valleys, the glacial deposits of the Şesura unit occur as low as 840–850 m asl (Figs. 3 and 4), while in the Bistricioara valley, they occur at 1200 m asl The Şesura unit is preserved 150–1200 m horizontally beyond the distinctly developed moraines of the Pietroasa unit. The vertical extent of the Şesura unit is marked by till covers with scattered boulders protruding on the smooth and subdued topographic surface without any moraine ridges (Figs. 3B and 4C). The glacial deposits of the Şesura unit feature an abundance of boulders with mean a-axis length above 1–1.5 m and maximal lengths of ca. 3–5 m, which appear to be intensely weathered (Fig. 3C).
The Pietroasa unit is represented by the inner, freshly shaped morainic walls (younger moraine) (Fig. 5A and B), which are well-defined morphological expressions of the LGM (the Pietroasa glacial stage). The landforms and deposits can be traced all around the Rodna Mountains. On the northern slopes, the lower limits of this unit occur between 900 and 1260 m asl, most commonly between 1100 and 1150 m asl. On the southern slopes, short glaciers (maximum length 1 km) have deposited small cirque moraines with fronts located at altitudes of ca. 1500–1600 m asl (Fig. 5G).
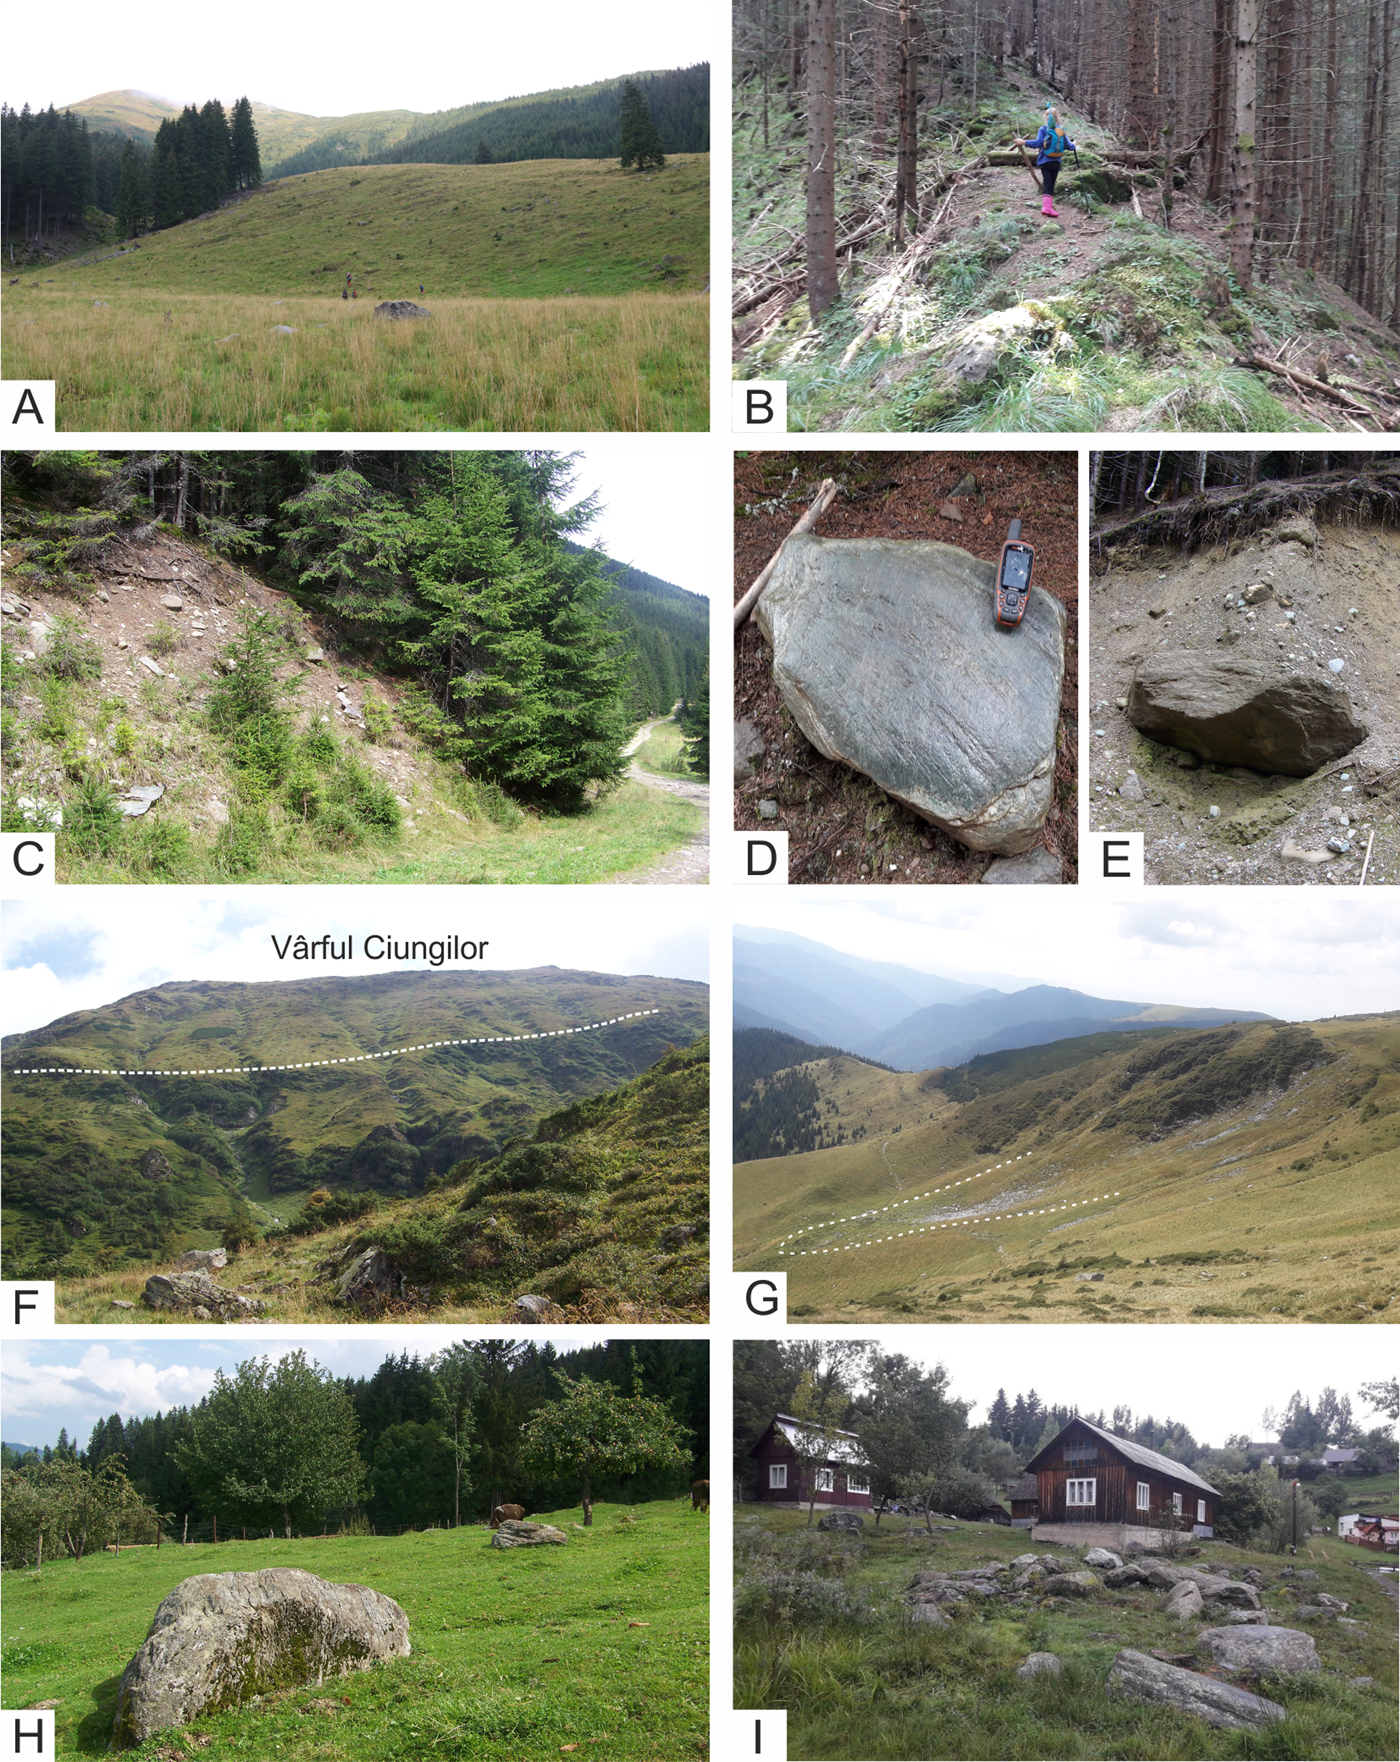
Figure 5. (color online) Geomorphological characteristics of the Pietroasa unit ice-marginal landforms (last glacial maximum [LGM]; A–G) and Şesura unit moraines and till covers (pre-LGM; H and I). (A) Prominent left lateral moraine in Lala valley. (B) Sharp crest of the left lateral moraine in Gropilor valley. (C) Outcrop of frontal moraine deposits in Bila valley. (D) Striated sericite and chlorite schist boulder within terminal moraines in Putreda valley. (E) Outcrop of the matrix-supported till in Putreda valley. (F) Glacial trimline in the Bila valley. (G) Partially preserved lateral and terminal moraines of the Jneapănu cirque glacier (Rodna Mountains, southern slope). (H) Highly weathered boulders on the surface of moraine cover in Pietroasa valley (Şesura unit type locality). (I) Boulder field in terminal zone of the Şesura unit moraines in Pietroasa valley.
In narrower and steeper valleys (e.g., the Buhăescu and Negoiescu valleys), only discontinuous morainic crests and glacial drift limits are preserved. Distinct latero-frontal moraines, tens of metres high, occur in valley sections with wider bottoms, such as the Lala and Bila valleys (Fig. 5A). Latero-frontal moraines pertaining to the Pietroasa stage are delimited by steep (30°–40°) slopes and sharp-crested (3–5 m width) ridges (Fig. 5B) with large morainic boulders, commonly 2–3 m in diameter (Fig. 5C–E). Large morainic blocks of probable supraglacial origin, with a maximal length of ca. 5–6 m, can also be found locally (Fig. 4E). In the Bistricioara and Fântâna valleys, terminal zones feature hummocky topographies typical for debris-covered glacial termini. Sediments of the Pietroasa unit consist of diamict with a sandy-silty matrix supporting cobble- to boulder-sized clasts (Fig. 5E). These clasts are predominantly subrounded, and some of the clasts display evidence of striae (Fig. 5D).
In the upper part of glaciated valleys, oversteepened backwalls and trimlines are best developed in the Bila, Lala, and Pietroasa valleys. However, in the Rodna Mountains, trimlines are generally poorly developed due to the relatively less competent metasedimentary bedrock. Cirque thresholds 50 to 100 m high are commonly preserved in the upper valley sections on the northern slope, with the best examples including the Buhăescu, Repedea, Bila, and Lala valleys (Fig. 2). Pleistocene glacial erosion has consumed the watershed divides between the Bistricioara/Fântâna and Cimpoiașului/Negoiescu valleys. These ice-moulded divides have already been recognised during previous studies (Sawicki, Reference Sawicki1911; Kräutner, Reference Kräutner1930; Tufescu, Reference Tufescu1940; Sîrcu, Reference Sîrcu1978). The central part of the Rodna Mountains has rounded as well as flat local summit areas suitable for wind drifting of snow or for plateau-ice accumulation at the area between Mt. Galațu and Mt. Cailor (Sîrcu, Reference Sîrcu1978).
Schmidt hammer test
The results of the SH test are shown on the plot in Figure 6, and the SH sites are shown in Figures 2–4. R-values obtained for sampled Şesura unit moraine boulders in Pietroasa valley are in the range of 28.8 to 39.6 (Fig. 6, Supplementary Data 3), with a mean of 32.8 ± 3.5. However, the measurements reveal bimodal distributions of individual mean R-values, with a lower (30.7 ± 1.3) and an upper mode (37.5 ± 2.1). The highest degree of weathering index (lower mode) represents the R-values for in situ weathered boulders in a stable morphological position at a time close to the deposition of the Şesura moraine. The mean R-values measured on the Pietroasa unit moraines (36.8 ± 1.6) show a significant difference (F = 30.365, P < 0.0002) compared with the lower Şesura unit R-values, but no significant difference (F = 0.117, P = 0.744) with the upper mode (Fig. 6). This points to the presence of some similarly weathered boulders on the surface of both older and younger moraines, which suggests postdepositional exhumation and erosional processes occurring on the highly denudated Şesura moraine cover (cf. Heyman et al., Reference Heyman, Stroeven, Harbor and Caffee2011). In the Fântâna valley the different bedrock lithology (quartz-rich gneiss) results in higher overall recorded R-values (Fig. 6, Supplementary Data 3). Mean R-values for the Şesura and Pietroasa unit show no significant differences (F = 0.110, P = 0.753). However, the limited number of stable boulders available on the surface of Şesura unit moraines precludes the identification of a significantly larger number of weathered boulders. This indicates that, in the steep-sided Fântâna valley, Şesura moraines are not well suited to either SH or cosmogenic age datings. The presence of anomalous low-weathered (fresh) boulders within both moraine units suggest the postdepositional disturbance (exhumation) of the moraine boulders.
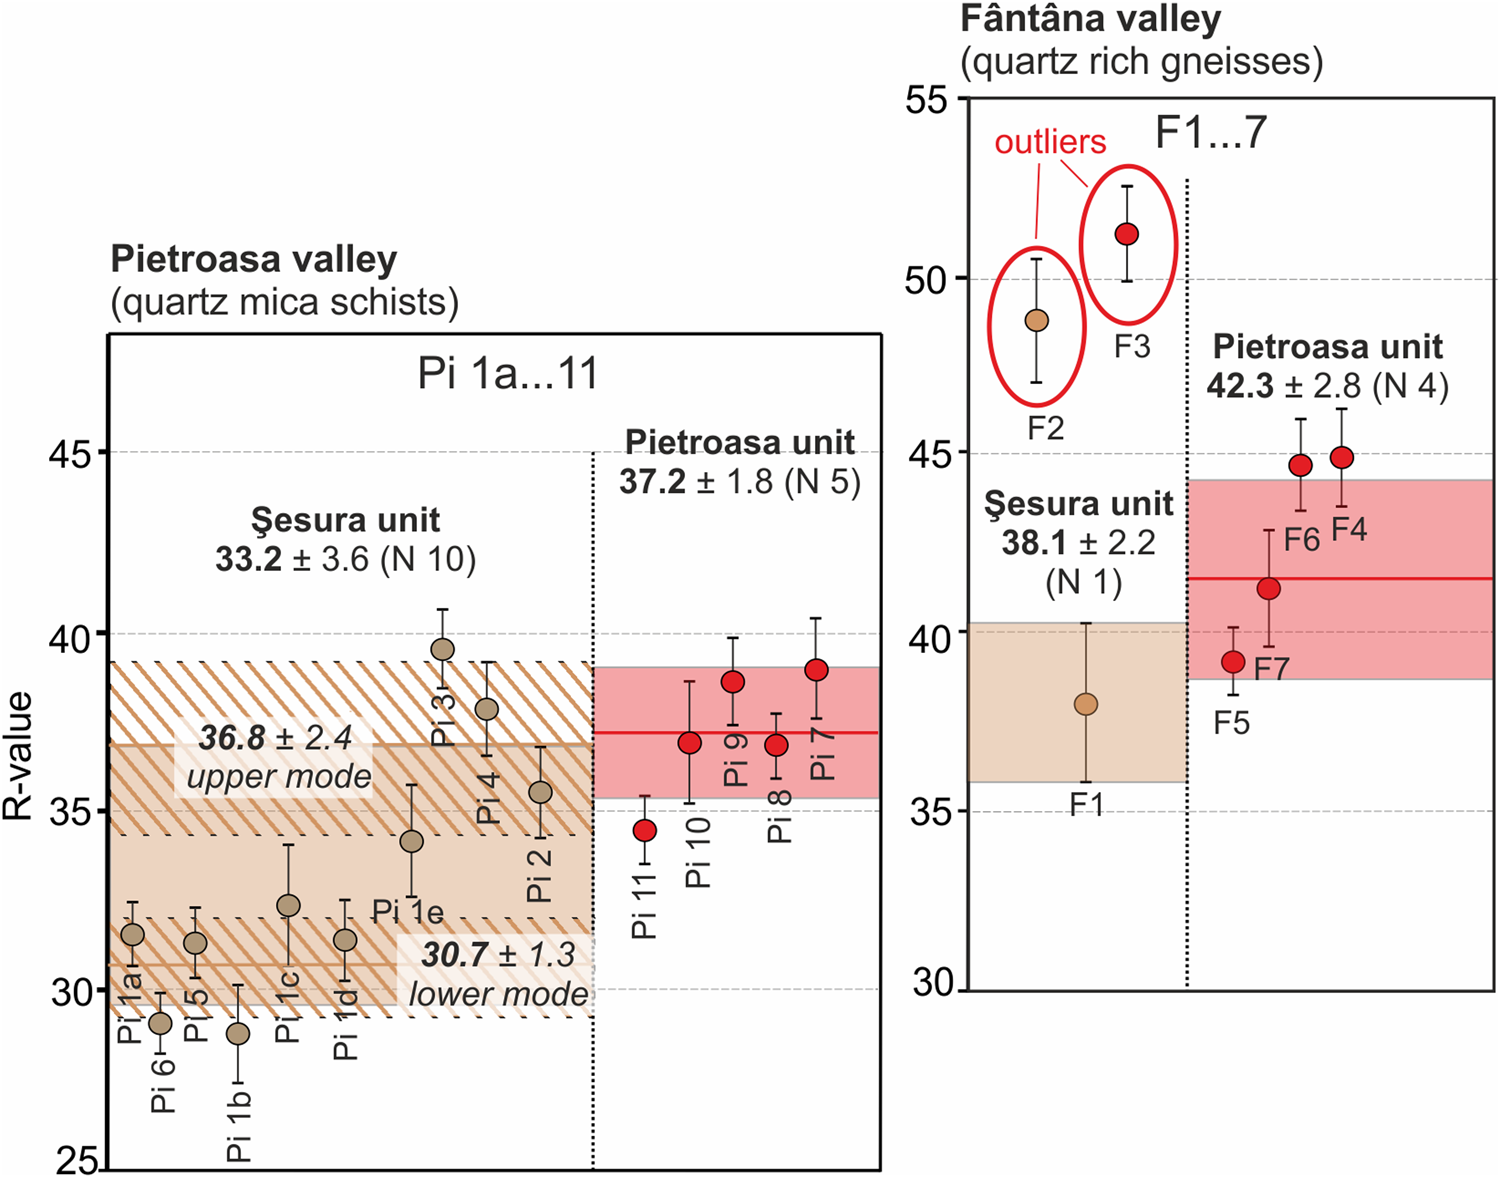
Figure 6. (color online) Results of the Schmidt hammer (SH) rebound test in Pietroasa and Fântâna valleys. Combined R-value statistics for each glacial stage are plotted as horizontal bars of standard error of the mean. SH test sites are numbered separately in each valley. Locations of SH test sites are presented in Figs. 2–4.
Glacial and ELA reconstructions of the LGM advance in the Rodna Mountains
Glacial geometry and ELA during the Pietroasa glacial stage (LGM) are presented in Figure 7. Detailed topographic and hypsometric parameters for individual glacial entities are provided in Table 1 and further summarized in Table 2. Our results indicate that during the Pietroasa glacial stage, the Rodna Mountains were covered by 40 valley and cirque glaciers (Fig. 7) that extended over a total area of 45.2 km2. The Putredu glacier found on the northern slope was the largest of the glaciers in this mountain range, with an area of 5.48 km2 (Table 1). The estimated area-averaged ice thickness for all glaciers was 23 m, whereas larger glaciers reached maximum thickness values close to 100 m, peaking at 144 m in the Buhăescu valley (Fig. 8). The entire LGM ice volume stored in glaciers of the Rodna Mountains was 1.56 km3.
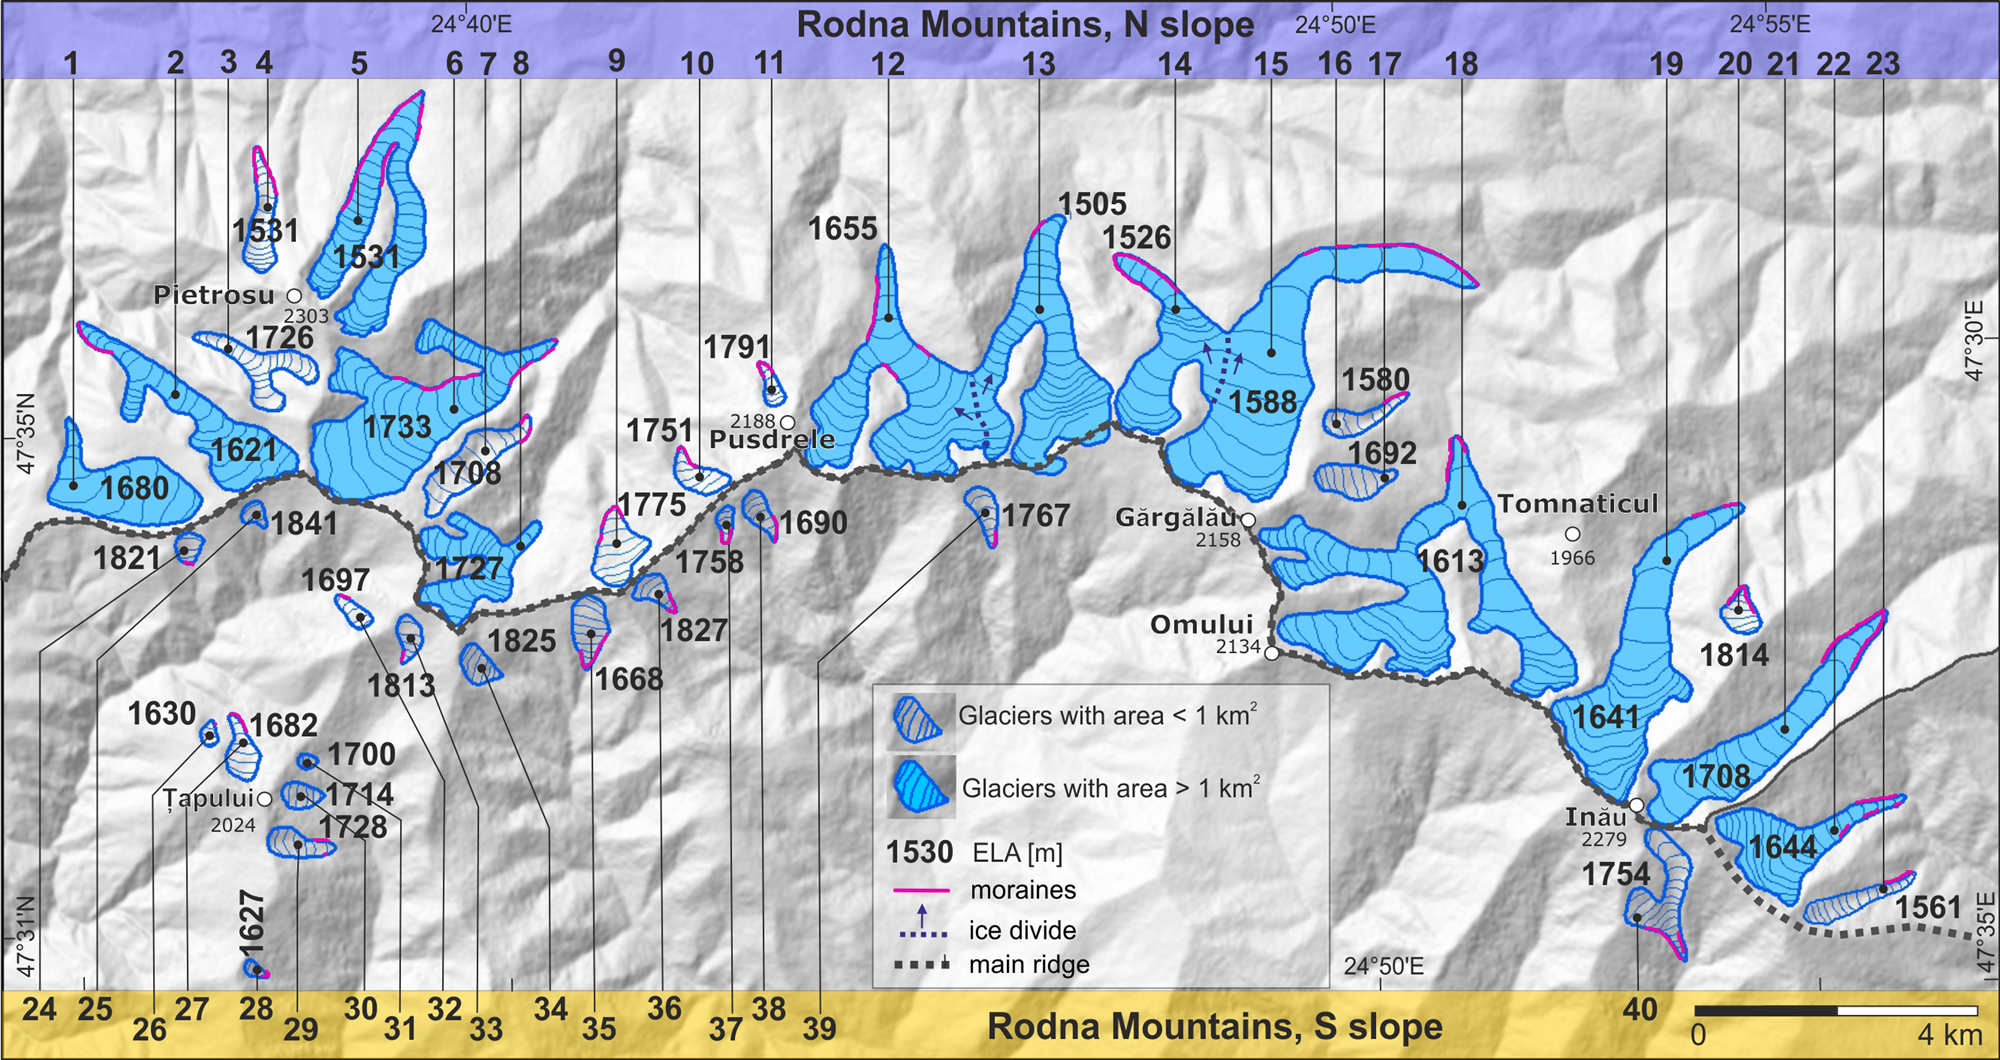
Figure 7. (color online) Glacier and equilibrium line altitude (ELA) reconstructions of the last glacial maximum advance (Pietroasa glacial stage) in the Rodna Mountains. The numbers refer to the numbers assigned to the glacial systems described in Table 1.
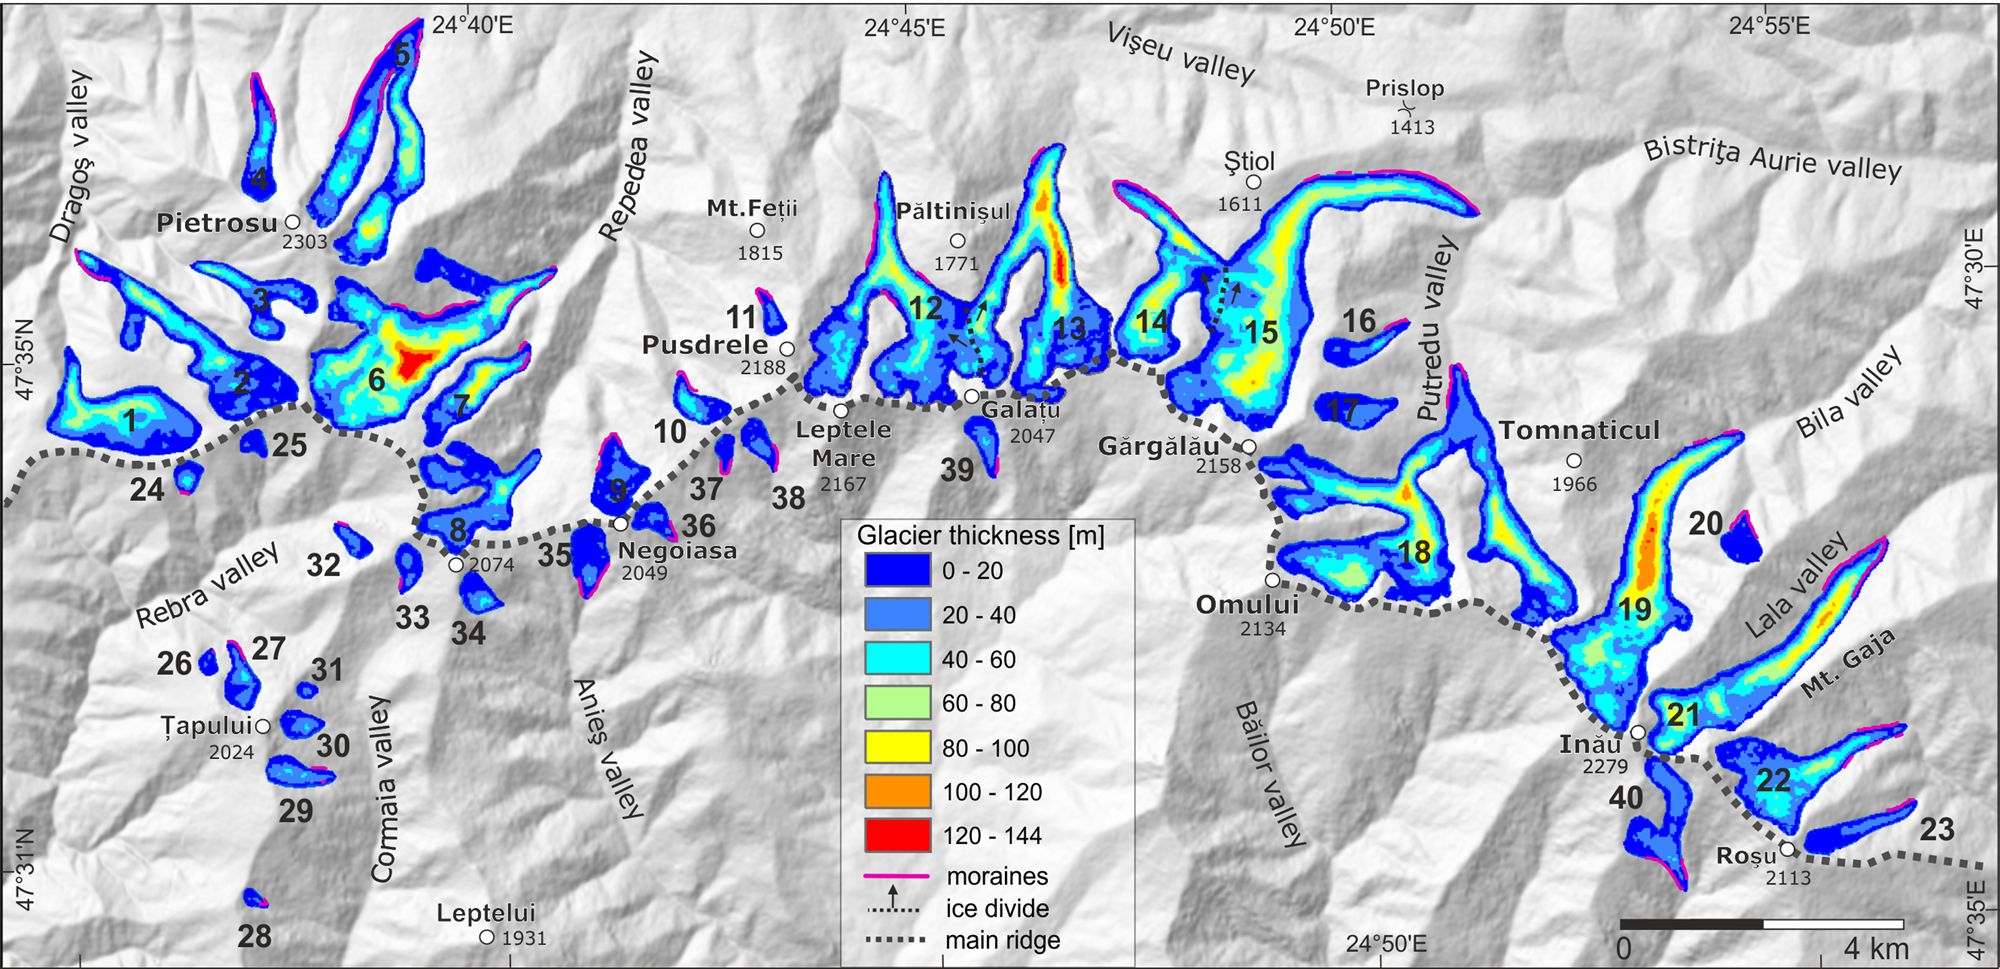
Figure 8. (color online) Glacier thickness of the last glacial maximum advance (Pietroasa glacial stage) in the Rodna Mountains. The numbers refer to the numbers assigned to the glacial systems described in Table 1.
Table 1. Basic morphometric and hypsometric parameters and results of estimations of equilibrium-line altitude (ELA) for the reconstructed palaeoglaciers in the Rodna Mountains.a
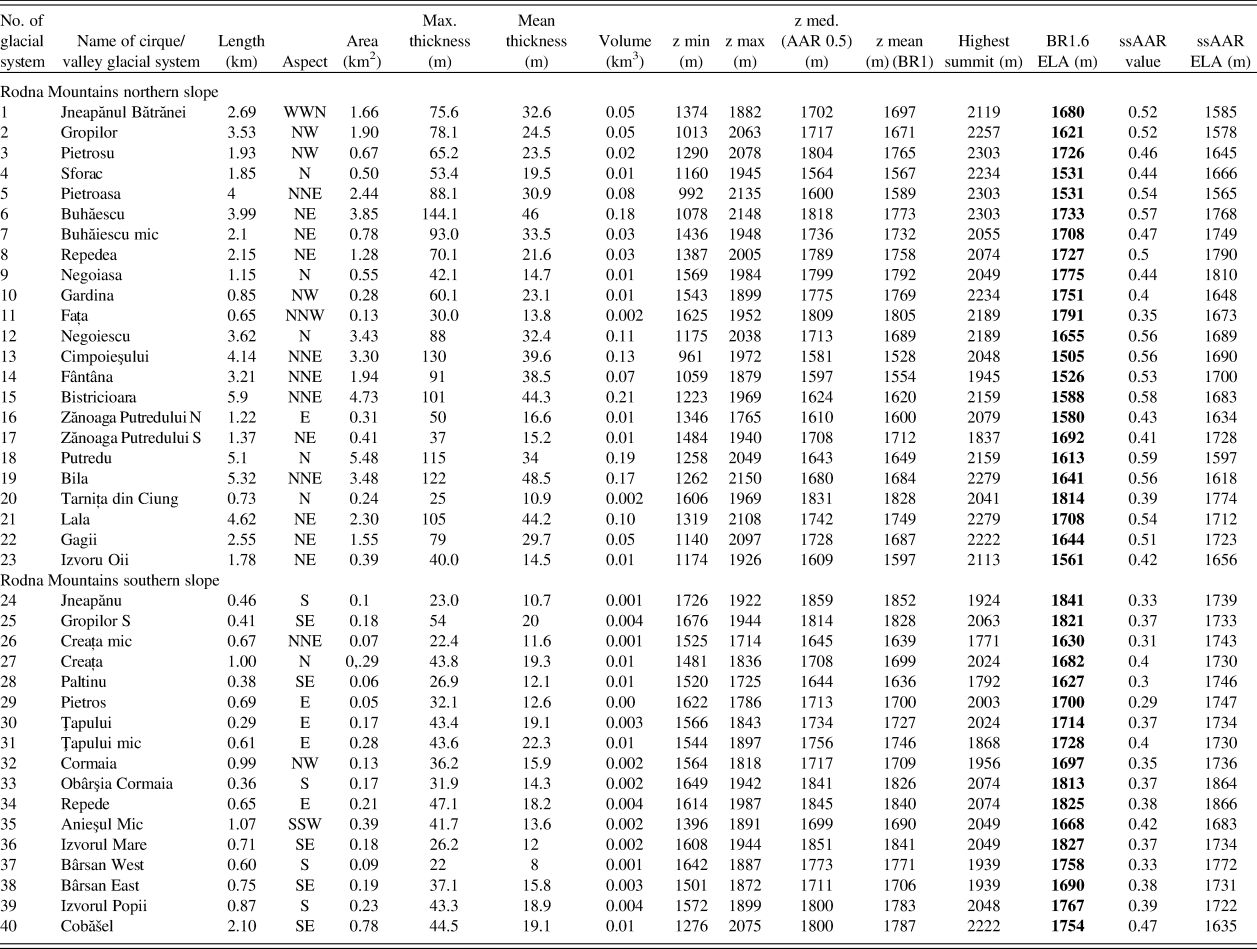
a Abbreviations: AAR, accumulation area ratio; BR, balance ratio; ssAAR, size-specific accumulation area ratio.
Table 2. North-south slope glaciation asymmetry and selected morphometrics of reconstructed last glacial maximum (LGM) glaciers in the Rodna Mountains.
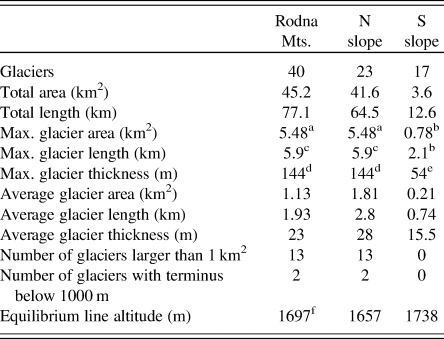
a Putredu valley glacier.
b Cobăšel cirque glacier.
c Bistricioara Valley glacier.
d Buhăescu Valley glacier.
e Gropilor S cirque glacier.
f N-S average ELA = N average + S average/2.
The Rodna Mountains feature strong north-south glacial asymmetry, with 92% (41.6 km2) of the glaciated area concentrated on the northern slope. On the northern flank of the mountain range, the mean size of cirque and valley glaciers (n = 23) was 1.81 km2 (Fig. 7). Most glaciers terminated in the elevation range 1150–1250 m; however, two glaciers descended below 1000 m asl (Pietroasa and Cimpoieşului glaciers). Thirteen glaciers each covered an area larger than 1 km2 (Fig. 7). The maximum length of palaeoglaciers that occupied the northern slope was 5.9 km, with a mean length of 2.8 km. On the southern flank of the Rodna Mountains, all the glaciers (n = 17) were smaller than 1 km2 (mean glacier size: 0.21 km2) and terminated below south- and east-facing cirques (Fig. 7). Using glacial vector analysis of aspect (Mîndrescu et al., Reference Mîndrescu, Evans and Cox2010), glacial aspects for all glaciers (n = 40) tend northeast with a mean of 43° and strength of 41.5%, while glaciers larger than 1 km2 (n = 13) tend north with a mean of 13° and strength of 84.5%.
During the LGM, the mean (north-south average) ELA (AABR 1.6) was 1697 m asl (Table 1). Nearly the same mean is found by applying the AAR 0.6 and ssAAR (AAR range 0.29–0.59) methods: 1690 and 1708 m asl, respectively: Therefore, we discuss only the AABR ELA results in the following analysis. The average difference between the mean ELA of the north- (1657 m asl) and south-facing glaciers (1738 m asl) was 80 m (Table 1).
Individual glacier ELAs show substantial variability, mostly due to glacier size and aspect, in the range of 310 m. The northern-slope glaciers show the largest ELA variability in the northwestern part of the massif, where one of the lowest (1530 m) and one of the highest (1790 m) individual ELAs were estimated. The lowest ELA values occurred on the northern fringe of the Rodna massif (nos. 4 and 5, ELA = 1530 m), and the highest in the inner zone, located between Mt. Gropilor and Mt. Pusdrelor (nos. 1–3 and 6–10; ELA = 1724 m) (Fig. 7). The glaciers in the eastern part of the massif show slightly eastward-rising tendency from ca. 1600 m (nos. 15 and 18) to 1700 m (no. 21) (Fig. 7).
DISCUSSION
Geomorphological and sedimentologic evidence of maximum Pleistocene glacial extent in Rodna Mountains
In the Rodna Mountains the maximum extent of Pleistocene glaciation is recorded as a well-defined system of the Pietroasa moraine unit, which is the morphological equivalent of the Rebra-phase moraines defined previously by László et al. (Reference László, Kern and Nagy2013) in the northwestern part of this range. Our results confirm the glacial extent documented by László et al. (Reference László, Kern and Nagy2013), except for the Pietroasa valley, where the configuration of moraines indicates that glaciers from Zănoaga Mare and Zănoaga Iezerului valleys joined together and terminated 900 m downstream, which roughly corresponds to the views of Szilády (Reference Szilády1907) and Sîrcu (Reference Sîrcu1978; Fig. 3, Supplementary Data 1). In comparison with previous studies (Sawicki, Reference Sawicki1911; Layos, Reference Layos1927; Kräutner, Reference Kräutner1930; Sîrcu, Reference Sîrcu1978; Gheorghiu, Reference Gheorghiu2012), the geomorphological mapping enables the detailed reconstruction of the LGM glacial extent and thickness (Figs. 7 and 8). In the upper part of glaciated valley systems, the vertical extent of ice surfaces corresponds to the trimlines, found in glacial troughs (Fig. 5F) and the oversteepened backwalls of cirques that were previously inventoried by Mîndrescu (Reference Mîndrescu2016). Additionally, five new glacial entities were recognised, whereas for two previously suggested locations no convincing evidence of glacial modification of slope topography and moraine deposits were found (Supplementary Data 1).
The Pietroasa moraines were dated by Gheorghiu (Reference Gheorghiu2012). The oldest (17.5 ± 1.6 ka) and the mean (16.7 ± 1.5 ka, n = 4) 10Be exposure age of boulders (Fig. 3) are younger than the peak of the global LGM (26.5–19 ka; Clark et al., Reference Clark, Dyke, Shakun, Carlson, Clark, Wohlfarth, Mitrovica, Hostetler and McCabe2009). The obtained exposure age distribution may, however, reflect a long time of moraine deposition and/or some postdepositional processes that had an influence on the isotope production as rolling or toppling of boulders during the final stabilization of the moraine crest as well as local erosion (Hallet and Putkonen, Reference Hallet and Putkonen1994). The sampled lateral moraine forms a sharp-crested ridge located between two steep branches of the Pietroasa valley (Zănoaga Mare and Zănoaga Iezerului valleys) that are drained by erosive streams cutting the base of the 600-m-long ridges from both sides (Fig. 3). The present-day surface of the ridge could have been lowered by erosion exposing previously buried subsurface boulders; thus the exposure ages of Gheorghiu (Reference Gheorghiu2012) may represent only the minimal age of moraine deposition that falls within the global LGM time range.
A similar geomorphological situation was found in the Western Tatra Mountains, where the relatively young 36Cl exposure ages of suspected LGM-age maximum moraines in the Bystra Valley (mean 15.5 ± 0.8 ka, n = 3) were interpreted by Makos et al. (Reference Makos, Rinterknecht, Braucher and Żarnowski2016) as the result of postdepositional degradation of the moraine crest induced by fluvial sapping of the moraine base. Additionally, 10Be exposure ages similar to those of the Pietroasa moraines were obtained for an LGM moraine boulder in the Făgăraş Mountains (17.2 ± 3.1 ka, n = 1) (Kuhleman et al., Reference Kuhlemann, Dobre, Urdea, Krumrei, Gachev, Kubik and Rahn2013). These locations are, however, exceptional in the glacial chronology of the Carpathians, where the formation of maximum moraines was contemporaneous with the global LGM. In the seven individual glacial systems on both northern and southern slopes of the Tatra Mountains, the obtained ages of moraines in a maximum position were dated with 10Be and 36Cl between 28 and 18 ka (Makos et al., Reference Makos, Dzierżek, Nitychoruk and Zreda2014, 2018; Engel et al., Reference Engel, Mentlík, Braucher, Minár, Léanni, Arnold, Aumaître, Bourlès, Keddadouche and Team2015). Similarly, the 10Be-based glacial chronology of the Retezat Mountains (Ruszkiczay-Rüdiger et al., Reference Ruszkiczay-Rüdiger, Kern, Urdea, Braucher, Balazs, Schimmelpfennig and Team2016, Reference Ruszkiczay-Rüdiger, Madarász, Kern, Urdea, Braucher and Team2017) indicates that the largest glacial advance on both the northern and southern sides of the massif occurred around ~21 ka.
As documented in this study, the Şesura glacial deposits represent a mappable geomorphological/stratigraphic unit preserved locally beyond the LGM terminal moraines. It records the local most-extensive glaciation. The Şesura moraine was recognized in the lower part of the Pietroasa valley (850–900 m) by early studies (Pawłowski and Pokorny, Reference Pawłowski and Pokorny1907; Sawicki, Reference Sawicki1911; Pawłowski, Reference Pawłowski and du. Congrès Géogr1936; Sîrcu, Reference Sîrcu1978; Gheorghiu, Reference Gheorghiu2012; László et al., Reference László, Kern and Nagy2013), albeit its spatial limit and age were disputable. According to Pawłowski and Pokorny (Reference Pawłowski and Pokorny1907), Pawłowski (Reference Pawłowski and du. Congrès Géogr1936), and Gheorghiu (Reference Gheorghiu2012), the glacier in the Pietroasa Valley extended as much as ca. 2 km downstream beyond the Şesura site, to ca. 760–700 m asl (Supplementary Data 1). Such a far-reaching glacial extent is not confirmed by our data. Downstream from the Şesura site, the rounded crystalline cobbles and pebbles preserved on the gently descending (ca. 5°) valley sides probably represent a glaciofluvial accumulation (Fig. 3). There are no large (1.5–2 m in size) subrounded boulders typical for glacial deposits in the upper section of the valley.
According to László et al. (Reference László, Kern and Nagy2013), the large boulders of the Şesura site represent a reworked moraine deposit formed by a glacial outburst flood. However, our geomorphological and sedimentologic data (Fig. 3C, Supplementary Data 2) indicate that this deposit is typical glacial till and consists of cobbles dispersed in a massive sandy-gravel matrix. The clast shape and roundness characteristics of this sediment are similar to the Pietorasa unit moraines (Supplementary Data 2).
The age of Şesura glacial sediments was previously tentatively correlated with the last (Sawicki, Reference Sawicki1911) or penultimate glaciation (Pawłowski, Reference Pawłowski and du. Congrès Géogr1936; Sîrcu, Reference Sîrcu1978; Urdea, Reference Urdea, Ehlers and Gibbard2004). The moraine boulders of the Şesura unit were dated by Gheorghiu (Reference Gheorghiu2012) with cosmogenic 10Be. The dated boulders yielded ages between 37.2 ± 3.4 and 18.3 ± 1.6 ka (Fig. 3). This gives rise to significant palaeoclimatic implications indicating a strong glacial advance during MIS 3 that has not been documented in other parts of the Carpathian–Balkan region.
Our geomorphological data, supported by the SH weathering index, and sedimentologic data (Supplementary Data 2) indicate advanced topographic degradation of Şesura moraines and substantial weathering of some of the surface boulders in comparison with the Pietroasa unit. The high degree of weathering recorded for the Şesura moraine boulders (R = 30.7 ± 1.3) in relation to the Pietroasa unit (R = 37.2 ± 1.8) point to a substantial difference in their relative ages, as R-value differences of 10 suggest time periods of thousands to tens of thousands of years, even for resistant rocks such as gneiss (Frauenfelder et al., Reference Frauenfelder, Laustela and Kääb2005; Shakesby et al., Reference Shakesby, Matthews and Owen2006; Keller-Pirklbauer et al., Reference Keller-Pirklbauer, Wangensteen, Farbrot and Etzemüller2008). The effective age limit obtained using the SH technique is unclear, however, as its resolution decreases with increasing rock age due to variable weathering rates, but decreases nonlinearly over time (Colman, Reference Colman1981; Colman and Dethier, Reference Colman and Dethier1986). In the Pyrenees, Tomkins et al. (Reference Tomkins, Dortch, Hughes, Huck, Stimson, Delmas, Calvet and Pallàs2018) reported R-values ≤30 for 10Be-dated granite boulders of ~50 ka age. Similar R-values were noted by Sánchez et al. (Reference Sánchez, Mosquera and Vidal Romaní2009) for surfaces of ~70 ka age, however, about the same R-values obtained for 160 ka old and 100 ka younger surfaces indicate that the SH technique should be used with extreme caution for relative dating of erosive surfaces (Sánchez et al., Reference Sánchez, Mosquera and Vidal Romaní2009). According to Černa and Engel (Reference Černa and Engel2011), the SH age limit can be extended by surface grinding, which may extend the effective measurement range even to the middle Pleistocene. Nevertheless, an extensive characterization of the surface boulders by the SH technique is a good representation of the mean erosion rate and would help in choosing samples to be dated by cosmogenic exposure methods (Sánchez et al., Reference Sánchez, Mosquera and Vidal Romaní2009).The results of clast morphology analysis (Supplementary Data 2) indicate lower RA values (the percentage of angular and very angular clasts in a sample, 0%–20%, mean 9%) along with slightly higher RWR values (the percentage of rounded and very rounded clasts in a sample, 6.3%) for the Şesura unit moraines, which indicate the presence of more rounded clasts compared with the Pietroasa unit. This could be an effect of prolonged subaerial weathering of moraine clasts of pre-LGM moraines. According to Hallet and Putkonen (Reference Hallet and Putkonen1994), a near-surface zone (~2 m depth) is characterised by relatively reactive weathering controlled by the abundance of moisture available for chemical weathering and clast disintegration.
Interestingly, our SH weathering data show significant R-value variability within the Şesura moraine (Fig. 6) that points to a continuous process of boulder exhumation and erosional processes (cf. Graf et al., Reference Graf, Strasky, Ivy-Ochs, Akcar, Kubik, Burkhard and Schluchter2007; Heyman et al., Reference Heyman, Stroeven, Harbor and Caffee2011). The common presence of less-weathered boulders (R = 37.5 ± 2.1) and outliers with R-values similar to those recorded for the Pietroasa moraine (Fig. 6) suggest enhanced postdepositional erosion and boulder exhumation. The model presented by Hallet and Putkonen (Reference Hallet and Putkonen1994) explains that it is possible to observe boulders that are “young” on relatively old moraine surfaces. On pre-LGM moraines, most of the original surface boulders have been destroyed by weathering, while new previously buried boulders were exposed on the moraine surface due to erosional lowering. The exposure ages of these boulders would be substantially younger than the moraine, and hence their mean age represents only minimum the age of the moraine (Hallet and Putkonen, Reference Hallet and Putkonen1994). In the study area, the process of boulder exhumation is manifested through the occurrence of outliers and bimodality of R-values distribution within the Şesura unit (Fig. 6). In this context, the true age of the Şesura moraine could be much older; however, the precise age of this landform is unclear. It cannot be excluded that its deposition may even pertain to the middle Pleistocene, whereas the 10Be exposure ages of some boulders reflect a prolonged time of boulder exhumation, as was previously proposed by László et al. (Reference László, Kern and Nagy2013) and Popescu et al. (Reference Popescu, Urdea, Vespremeanu-Stroe, Rădoane and and Vespremeanu-Stroe2017).
Similarly, anomalously “too young” 36Cl ages (90–20 ka) were obtained for postulated penultimate glaciation moraines in the High Tatra Mountains (Dzierżek, Reference Dzierżek2009; see Kłapyta and Zasadni, Reference Kłapyta and Zasadni2018) and for 10Be-dated moraines (63.5–38.8 ka) formed during the Saalian glaciation (MIS 6) in the Polish lowlands (Tylman et al., Reference Tylman, Woźniak and Rinterknecht2018). These facts indicate that the distribution of 10Be exposure ages in the Rodna Mountains may highlight a common problem in the absolute dating of older Pleistocene moraines in temperate climates, where relatively humid conditions enhanced accelerated surface disintegration of the rock surface by chemical weathering and effective erosional processes.
ELA trend and palaeoclimatic inferences
Previous LGM ELA reconstructions in the northwestern part of the Rodna Mountains provided very different assessments of ELA position on the same palaeoglaciers that range between 900–1300 m (Gheorghiu, Reference Gheorghiu2012) and ca. 1735 m (László et al., Reference László, Kern and Nagy2013). Such large inconsistency resulted from the different size of the reconstructed glaciation (Supplementary Data 1).
In this study, the LGM ELA values in the Rodna Mountains (~1690 m) are higher compared with the values calculated for selected glaciers on the northern slope of the Western (1400 m) and High Tatra Mountains (1460–1525 m), which are located 400 km to the northwest in a cooler, more humid setting (Zasadni and Kłapyta, Reference Zasadni and Kłapyta2016; Engel et al., Reference Engel, Mentlík, Braucher, Minár, Léanni, Arnold, Aumaître, Bourlès, Keddadouche and Team2015; Makos et al., Reference Makos, Rinterknecht, Braucher, Tołoczko-Pasek and Team2018; Zasadni et al., Reference Zasadni, Kłapyta and Świąder2018), and lower than the ELAs calculated for Retezat Mountains in the southern Carpathians (1700–1850 m) (Ruszkiczay-Rüdiger et al., Reference Ruszkiczay-Rüdiger, Kern, Urdea, Braucher, Balazs, Schimmelpfennig and Team2016, Reference Ruszkiczay-Rüdiger, Madarász, Kern, Urdea, Braucher and Team2017).
In the wider context, LGM ELA values in the Rodna Mountains fit well with the general rise of the ELA trend line along a longitudinal transect north of the Alps (Heyman et al., Reference Heyman, Stroeven, Harbor and Caffee2011). An eastward-rising LGM ELA trend is observed from the Vosges and Black Forest Mountains (ELA = 900–1000 m; Heyman et al., Reference Evans and Cox2013), through the Bavarian/Bohemian forest and the Krkonoše Mountains (ca. 1100 m; Mentlik et al., Reference Mentlík, Engel, Braucher, Léanni and Team2013; Engel et al., Reference Engel, Braucher, Traczyk, Laetitia and Team2014), the Tatra Mountains (1580 m; Zasadni et al., Reference Zasadni, Kłapyta and Świąder2018), and the easternmost-located Rodna Mountains (~1690 m). The eastward-rising ELA trend was controlled by strong precipitation starvation in the continental interior during the LGM (Magyari et al., Reference Magyari, Veres, Wennrich, Wagner, Braun, Jakab and Karátson2014) that limited glacial development in the east to mountain massifs exceeding 1600 m asl in elevation (Urdea, Reference Urdea, Ehlers and Gibbard2004; Urdea et al., Reference Urdea, Onaca, Ardelean, Ardelean, Ehlers, Gibbard and Hughes2011).
The glaciation was strongly asymmetrical in the Rodna Mountains with dominant northern aspects (mean 43°). The abundance of glaciers and glacial cirques on the northern slopes is a widespread pattern observed in most Northern Hemisphere mountain ranges (Evans, Reference Evans1977; Evans and Cox, Reference Evans and Cox1995) from the effect of shade and radiation incidence on glacier mass balance in accumulation areas (Evans, Reference Evans2006). According to previous studies, the uneven glacial distribution was climatically controlled by higher precipitation on the north face of the mountains (Sawicki, Reference Sawicki1911) or enhanced snow accumulation by westerly moisture-bearing winds (Sîrcu, Reference Sîrcu1978). Although the mean altitude of the Rodna cirque floors is similar on the opposite slopes (N = 1692 m, S = 1698 m), the area and cirque height range of the north-facing cirques are 2.7 and 1.5 larger, respectively, than those of south-exposed cirques. The extensive area of north-facing cirques served as capacious source areas for glaciers and, along with preferential moisture transport from the west and northwest, resulted in a significant degree of glaciation on the northern slopes of the massif.
The west-east orientation of the Rodna Mountains provides a good test area for tracing the spatial ELA trend in the central part of the eastern Carpathians and inferring the magnitude and extent of the North Atlantic zonal circulation through the interior of the European continent during the last glaciation. The trend for northern slope glaciers (nos. 1–23) shows an insignificant fall to the east (P = 0.644, r 2 = 0.037); however, when they are separated into local groups, the west-east trend becomes more pronounced. Based on the ELA values, the glaciers on the northern slope could be separated into two groups: northern fringe zone (nos. 4and 5 and 12–23) and inner zone (nos.1 and 2 and 6–11) (Fig. 9). In both northern fringe glaciers and inner group zones, the small eastward ELA rise observed is 6.6 m/km (P = 0.41, r 2 = 0.25) and 8.4/km (r 2 = 0.69), respectively (Fig. 9).The eastward rise of ELA for the 14 former glaciers along the northern fringe of the Rodna Mountains (>26 km long) supports former snow-bearing winds being from the west.
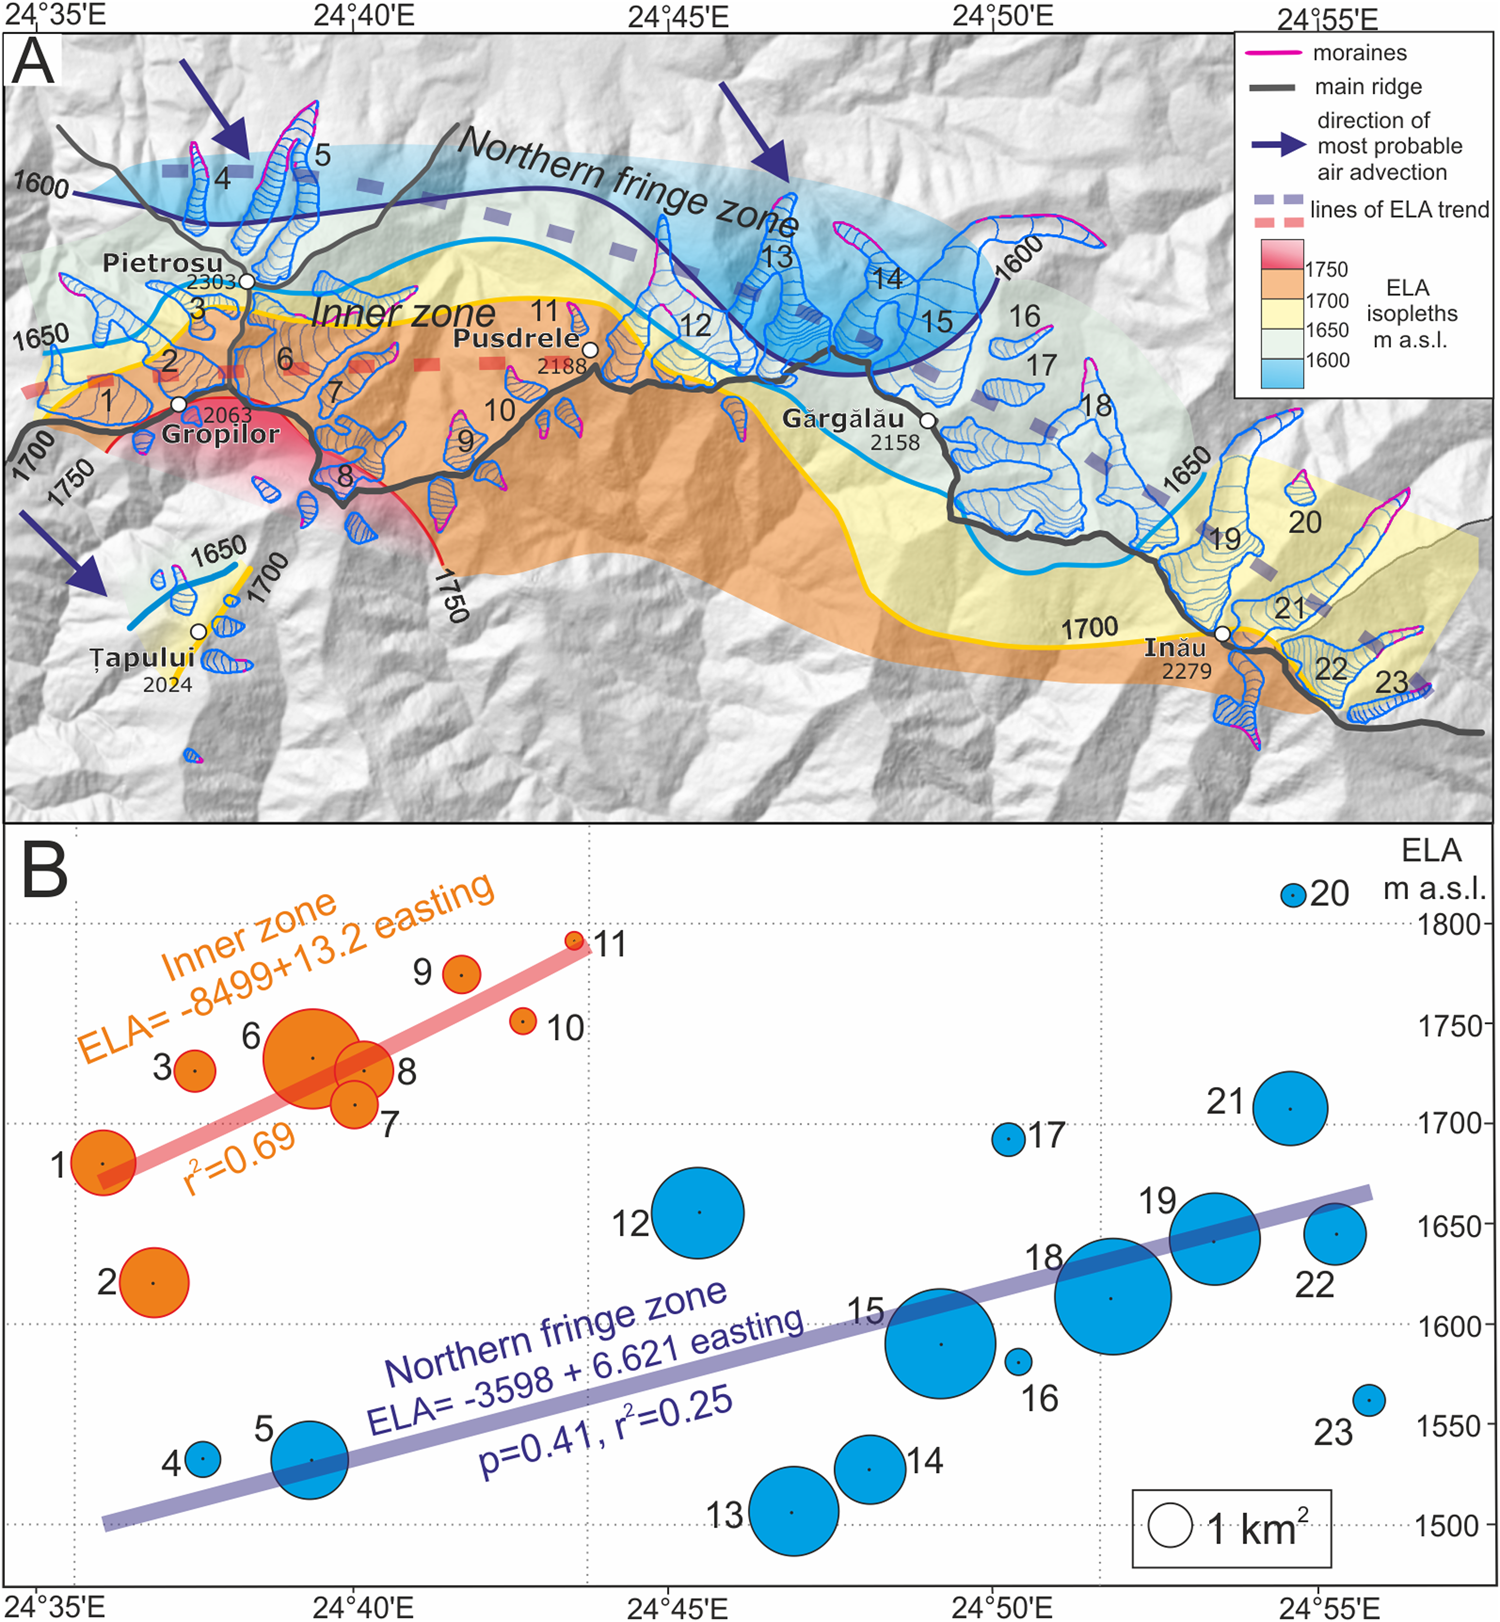
Figure 9. (color online) Distribution of the last glacial maximum glaciers and associated equilibrium line altitudes (ELA) in the Rodna Mountains. (A) ELA isopleth map for the north-exposed glaciers in Rodna Mountains. The glaciers on the northern slope were separated into two groups: northern fringe zone (nos. 4 and 5 and 12–23) and inner-zone glaciers (nos. 1 and 2 and 6–11). (B) West-east ELA trends on the northern slope of the Rodna Mountains. The circle area corresponds to glacier surface area. Numbers refer to glacier symbols in Table 1.
Mount Pietrosu (2303 m) extends ca. 2 km north from the main ridge and represents prominent local topographic culmination with high local relief (ca. 1800 m) and exposition to the regional winds (Sîrcu, Reference Sîrcu1978; Mîndrescu et al., Reference Mîndrescu, Evans and Cox2010). The significantly lower ELA on the northern slope of Mt. Pietrosu (nos. 4 and 5; ELA 1530 m), was likely the effect of enhanced orographic-induced precipitation on the northern and northwestern fringe of the Rodna Mountains (Fig. 9). Therefore, the marked north-south ELA gradient between northern fringe zone glaciers in the Mt. Pietrosu area and the inner-zone glaciers located behind this massif (ELA 1620–1720 m) suggest that the latter were more sheltered from northwest and north winds by the Pietrosu ridge (Fig. 9).
According to the early views of Sawicki (Reference Sawicki1911) and the glacier ELA reconstruction in the northwestern part of the Rodna Mountains (Gheorghiu, Reference Gheorghiu2012), during the global LGM, the eastern Carpathians were under the influence of cold and dry air masses associated with the Scandinavian ice sheet and influenced by a katabatic wind system operating from the northeast. Due to the limited supply of moisture from the North Atlantic, the glacier mass balance in the Rodna Mountains was supported by exceptionally low summer temperatures (Gheorghiu, Reference Gheorghiu2012). In contrast, according to Makos et al. (Reference Makos, Dzierżek, Nitychoruk and Zreda2014) and Marks et al. (Reference Marks, Makos, Szymanek, Woronko, Dzierżek and Majecka2019), north-south ELA gradients in the High Tatra Mountains indicate that during the LGM, the western Carpathians were influenced by an increased inflow of humid air masses from the south and reduced northwestern moisture inflow. This contrasts with the results of glacial palaeo-ELA trends calculated from the full set of Tatra LGM glaciers (Zasadni et al., Reference Zasadni, Kłapyta and Świąder2018), which point to a strong influence of west/northwest moisture transport and orographic-induced precipitation causing an eastward ELA rise.
In the southern Carpathians, a southerly wind regime was inferred by Kuhleman et al. (Reference Kuhlemann, Dobre, Urdea, Krumrei, Gachev, Kubik and Rahn2013) and Ruszkiczay-Rüdiger et al. (Reference Ruszkiczay-Rüdiger, Madarász, Kern, Urdea, Braucher and Team2017) based on glacier ELA reconstructions of single glaciers in the Fagaraş and Retezat Mountains. However, climatic implications of cirque distribution in the southern Carpathians (Mîndrescu et al., Reference Mîndrescu, Evans and Cox2010) confirm the importance of winds from the westerly direction at times of mountain glaciation. Thus, further research is needed to develop a coherent picture of the precipitation–wind regime during the LGM in the southern Carpathians.
Our interpretation of the eastward-rising ELA pattern on the north-facing Rodna Mountain glaciers and steep southward ELA gradient in the Mt. Pietrosu area suggest orographic forcing on the northwestern fringe of the mountains, which acts as a topographic barrier for precipitation-bearing winds. The observed pattern is difficult to attribute to an error in glacial ELA reconstruction because of its clear internal consistency. A wind and precipitation regime from south or east, as suggested in previous studies (Sawicki. Reference Sawicki1911; Gheorghiu. Reference Gheorghiu2012; Kuhlemann et al., Reference Kuhlemann, Dobre, Urdea, Krumrei, Gachev, Kubik and Rahn2013), would not give the observed ELA pattern. Conversely, the ELA pattern determined in the Rodna Mountains supports former snow-bearing winds being from the west.
Moreover, the ELA trend is consistent with the west-northwest-dominated winds during glacial maxima inferred from the spatial distribution of glacial cirques in the Romanian Carpathians. According to Mîndrescu et al. (Reference Mîndrescu, Evans and Cox2010), the 39° mean wall aspect for the 53 cirques in the Rodna Mountains could result from a west wind 79% as important as solar radiation and shade or a northwest wind 60% as important. The dominant northeast tendency of cirque aspects in the Rodna Mountains and the lower cirque floors found in northeast-facing cirques confirm the importance of precipitation-bearing winds from the northwest during mountain glaciation stages (Sîrcu, Reference Sîrcu1978; Mîndrescu et al., Reference Mîndrescu, Evans and Cox2010).
The characteristics of the precipitation–wind regime during the LGM inferred in this study fit well with previous simulations of dominant wind direction during glacial stages in the Pannonian basin and the region east of the Carpathians. Grain-size records of loess sequences in the areas located to the west and east of the Carpathians indicate the spatial reorganisation of prevailing wind directions from the west during MIS 4 and 3 to the northwest during MIS 2 (Bokhorst et al., Reference Bokhorst, Vandenberghe, Sümegi, Łanczont, Gerasimenko, Matviishina, Markovič and Frechen2011). These observations support the previous simulations by Van Huissteden and Pollard (Reference Van Huissteden and Pollard2003) showing that central Europe was dominated by strong western winds during the winter conditions of MIS 3, while the LGM was dominated by strong northwestern winds. Similarly, major wind directions reconstructed based on the orientation of gredas and loess isopach mapping (Różycki, Reference Różycki1967; Marković et al., Reference Marković, Bokhorst, Vandenberghe, McCoy, Oches, Hambach, Gaudenyi, Jovanović, Stevens, Zöller and Machalett2008) indicate that northwesterly and northerly winds prevailed in the area during the periods of loess formation. This is in line with the orientation of ventifacts and yardangs, both in bedrock and in late Pleistocene deposits, studied in the hilly regions of the Pannonian plain in central Hungary (Jámbor, Reference Jámbor1992; Ruszkiczay-Rüdiger et al., Reference Ruszkiczay-Rüdiger, Fodor and Horváth2007), which also demonstrate a northwesterly wind direction. Additionally, anisotropy of magnetic susceptibility data of loess (Bradák, Reference Bradák2009) from northeastern Hungary support a more northerly direction of dust transport close to the eastern Carpathians. Intensive aeolian activity in the southeastern part of the eastern Carpathians of Romania, with increased continentality, probably with relatively warm and dry summers between 26–20.2 cal ka BP, were documented by high-resolution pollen records (Magyari et al., Reference Magyari, Veres, Wennrich, Wagner, Braun, Jakab and Karátson2014).
Recent palaeoclimate model simulations indicate that during the LGM, the number and intensity of cyclones increased over central Europe (Ludwig et al., Reference Ludwig, Schaffernicht, Shao and Pinto2016, Reference Ludwig, Pinto, Raible and Shao2017, Pinto and Ludwig, 2020) as the result of stronger and southward-shifted jet streams (Luetscher et al., Reference Luetscher, Boch, Sodemann, Spötl, Cheng, Edwards, Frisia, Hof and Müller2015; Ludwig et al., Reference Ludwig, Schaffernicht, Shao and Pinto2016) and the southward-deflected North Atlantic storm track with greater eastward extent across continental Europe (Laine et al., Reference Laîné, Kageyama, Salas-Mélia, Voldoire, Riviere, Ramstein and Planton2009; Hofer et al., Reference Hofer, Raible, Merz, Dehnert and Kuhlemann2012; Luetscher et al., Reference Luetscher, Boch, Sodemann, Spötl, Cheng, Edwards, Frisia, Hof and Müller2015).
The data presented indicate that North Atlantic zonal circulation was likely an important palaeoclimatic feature in the northeasternmost sector of the Carpathian area during the LGM. In the area of the European loess belt, north and northeast of the Carpathians, the North Atlantic climate signal has been recorded at least as far as 30°E (Sima et al., Reference Sima, Kageyama, Rousseau, Ramstein, Balkanski, Antoine and Hatté2013). In addition to the zonal mode of circulation having influenced glacial development in the eastern Carpathians, there is both proxy (Bradák, Reference Bradák2009; Újvári et al., Reference Újvári, Stevens, Molnár, Demény, Lambert, Varga and Jull2017) and model simulation evidence (Schaffernicht et al., Reference Schaffernicht, Ludwig and Shao2020) that advection of cold and dry air from the northeast sector, triggered by a strong anticyclone over the Eurasian ice sheet, may also have played a role. To test this hypothesis and support the zonal circulation pattern hypothesis further, glacial reconstruction and ELA trend research are required north of the present study area, in the high-altitude mountain massifs of the Ukrainian Carpathians.
CONCLUSIONS
The eastern Carpathians represent one of the least-explored areas for glacial geomorphology in Europe. The area is the northeasternmost glaciated area in Europe, standing as an important region that documents the magnitude and extent of the inferred zonal/meridional mode of atmospheric circulation across the interior of the continent during glacial stages.
Here we present new geomorphological and sedimentologic evidence of LGM and maximal Pleistocene glaciation in the Rodna Mountains, at 2303 m asl the highest mountain range in the eastern Carpathians. In most of the glacial valleys, the LGM glacial extent is represented by sharp-crested moraines (younger moraines). Only locally beyond the younger moraines do highly degraded moraines and till covers record the local most-extensive glaciation. The key locality showing both sequences is the Petroasa valley, where both moraine units were previously dated with cosmogenic 10Be by Gheorghiu (Reference Gheorghiu2012) as 37.2–26.6 ka for the Şesura advance and 16.7 ± 1.5 ka for the Pietroasa advance. The Pietroasa moraines are regarded as the LGM advance, whereas advanced topographic degradation of Şesura moraines and substantial weathering of some of the surface boulders in comparison with the Pietroasa unit suggest that the true age of Şesura moraine could be much older, but its precise age is unclear (pre-LGM, likely MIS 6).
During the Pietroasa glaciation (LGM), the Rodna Mountains hosted 40 valley and cirque glaciers that occupied a total area of 45.2 km2. The glaciation was strongly asymmetrical, with 92% of the glaciated area concentrated on the northern slope. The LGM mean ELA (AABR 1.6) was 1697 m. This value is the highest recorded LGM ELA along a longitudinal transect north of the Alps, reflecting continental condition in the eastern Carpathians.
Our results also reveal a rising ELA trend towards the southeast on the northern Rodna slope, which suggests dominant snow-bearing winds and orographically induced precipitation from the northwest. The local ELA pattern presented here highlights the important role moisture from the North Atlantic played in glacier mass balance in the eastern Carpathians during the LGM. Our results support the dominantly zonal pattern of atmospheric circulation in the western and eastern Carpathians, in line with results from model simulations and regional palaeo-wind proxies that show enhanced midlatitude North Atlantic storm track activity over central Europe during the LGM.
ACKNOWLEDGMENTS
The present research work was funded by the National Science Centre (Poland), grant no. 2018/02/X/ST10/01593, titled: “The Glaciation in the Rodna Mountains during the Last Glacial Maximum.” We wish to thank the Rodna Mountains National Park (Romania) authorities for their permission to conduct research work in this protected natural area. We would like to thank I. Muntean from the Rodna Mountains National Park administration and J. Cząstka-Kłapyta and C. Balaban for help with the fieldwork. Additionally, we would like to thank Ian S. Evans for helpful comments and discussion.
SUPPLEMENTARY MATERIAL
The supplementary material for this article can be found at https://doi.org/10.1017/qua.2020.90


