


INTRODUCTION
Biofilm-associated diatoms are an abundant component of biofilm or periphyton communities, and play an important role as primary sources of energy for aquatic food webs in both lentic and lotic ecosystems (Oemke & Burton, Reference Oemke and Burton1986; Liu et al., Reference Liu, Zhang and Xu2013). As they respond rapidly to both hydrological and water quality changes, these periphytic organisms have widely been accepted as a useful bioindicator of many types of pollution, such as acidification, eutrophication, organic pollution and metallic pollution since the 1920s. Furthermore, their biotic indices have been used to estimate water quality in both European and Asian countries (Lange-Bertalot, Reference Lange-Bertalot1979; Lei et al., Reference Lei, Lam and Hu2011).
A number of investigations have demonstrated that taxonomic distinctness indices are a useful indicator to evaluate both biodiversity and environmental quality status, mainly due to their weak dependence on natural habitat type and sampling effort, and high sensitivity to environmental stress and anthropogenic impacts (Warwick & Clarke, Reference Warwick and Clarke2001; Leonard et al., Reference Leonard, Clarke, Somerfield and Warwick2006; Prato et al., Reference Prato, Morgana, Valle La, Finoia and Lattanzi2009; Xu et al., Reference Xu, Zhang, Jiang, Zhu, Al-Rasheid, Warren and Song2011a, Reference Xu, Zhang, Jiang, Min and Choib, Reference Xu, Zhang, Jiang, Zhu and Al-Resheid2012a; Zhang et al., Reference Zhang, Xu, Jiang, Zhu and Al-Resheid2013; Jiang et al., Reference Jiang, Xu and Warren2014). Our previous investigations on the diatom microflora have documented the temporal variations in species biodiversity indices (e.g. species richness, evenness and diversity) that are traditionally used as indicators of water quality (Xu et al., Reference Xu, Zhang, Jiang, Zhu, Al-Rasheid, Warren and Song2011a, Reference Xu, Zhang, Jiang, Min and Choib, Reference Xu, Zhang, Jiang, Zhu and Al-Resheid2012a). However, little information was documented with regard to temporal patterns of taxonomic distinctness of the diatoms within their colonization process.
In this study, a 1-month baseline survey was carried out in coastal waters of the Yellow Sea, near Qingdao, northern China during May and June 2014, in order to explore the temporal variation in taxonomic distinctness of biofilm-associated diatoms. Our aims were: (1) to document the temporal variation in taxonomic structure of the diatom microflora; (2) to reveal the temporal dynamics of taxonomic distinctness; and (3) to compare the differences in taxonomic structure/distinctness of the diatoms during the colonization period at different depths in coastal waters.
MATERIALS AND METHODS
Study site and data collection
The study station was located in the harbour of the Olympic Sailing Centre at Qingdao, northern China (Figure 1). This is a typical coastal area of the Yellow Sea with an average depth of ~8 m and an average tidal range of 3 m.

Fig. 1. Map of the sampling station, which was located in the harbour of the Olympic Sailing Center at Qingdao, on the Yellow Sea coast of northern China.
The sampling strategy was designed as described by Xu et al. (Reference Xu, Min, Choi, Jung and Park2009b, Reference Xu, Min, Choi, Kim, Jung and Limc). A total of 200 glass slides (2.5 × 7.5 cm) were immersed for the diatom colonization at depths of 1 and 3 m below the water surface. For each depth, a total of five PVC frames were used to hold the 100 slides, 12 of which were randomly collected from each PVC frame at the time intervals of 1, 3, 7, 10, 14, 21 and 28 days, during the study period. From both depths, samples were collected simultaneously. Diatom abundances were calculated from two replicates with six glass slides each to confirm the average abundance of diatoms (Xu et al., Reference Xu, Zhang, Jiang, Zhu and Al-Resheid2012b; Liu et al., Reference Liu, Zhang and Xu2013, Reference Liu, Zhang and Xu2014).
Diatom identification and enumeration were carried out following the methods outlined by Xu et al. (Reference Xu, Zhang, Jiang, Zhu and Al-Resheid2012a, Reference Xu, Zhang, Jiang, Zhu and Al-Resheidb). The taxonomic classification of diatoms was based on the published references to keys and guides such as Hasle & Syvertsen (Reference Hasle, Syvertsen and Tomas1997).
The enumeration of diatoms in vivo was conducted at 1000× magnification under an inverted microscope within 24 h after sampling. For recovering all species colonizing the glass slides, a whole slide (17.5 cm2) was examined to record both occurrences and individual abundances, using a bright field illumination. After 14 days of colonization period, in order to count the numbers of dominant diatoms, 10 fields of view per slide were randomly chosen. The diatom abundances were calculated from six slide-replicates to confirm the average abundance of diatoms (Xu et al., Reference Xu, Zhang, Jiang, Zhu and Al-Resheid2012b; Liu et al., Reference Liu, Zhang and Xu2014).
Data analysis
Taxonomic diversity (Δ), taxonomic distinctness (Δ*), average taxonomic distinctness (Δ+) and variation in taxonomic distinctness (Λ+) were computed following the equations:
 $$\Delta = [\Sigma \Sigma _{i \lt j} {\rm \omega} _{ij} x_i x_j ]/[N\left( {N-{\rm} 1} \right)/2]$$
 $$\Delta ^{\ast} = [\Sigma \Sigma _{i \lt j} {\rm \omega} _{ij} x_i x_j ]/[\Sigma \Sigma _{i \lt j} x_i x_j ]$$
 $$\Delta ^ + = {\rm} [\Sigma \Sigma _{i \lt j} {\rm \omega} _{ij} ]/[S(S-1)/2]$$
 $$\Lambda ^ {+} = [\Sigma \Sigma _{i \lt j} ({\rm \omega} _{ij -} -\Delta ^ {+} )]/[S(S-1)/2]$$
where x i (i = 1, 2,…, S) denotes the abundance of the i th species; N is the total number of individuals in the sample; ω ij is the ‘distinctness weight’ given to the path length linking species i and j (with i < j); and S is the number of species (Warwick & Clarke, Reference Warwick and Clarke1995).
The distinctness weights used in this study were according to Clarke & Warwick (Reference Clarke and Warwick1998), i.e. ω = 1 (species in the same genus), 2 (same family but different genera), 3 (same order but different family), 4 (same class but different order) and 5 (same phylum but different class). The distinctness of two species connected at the highest taxonomic level is set equal to 100 (Warwick & Clarke, Reference Warwick and Clarke2001). The taxonomic scheme used was according to Round et al. (Reference Round, Crawford and Mann1990).
The community structures of samples were analysed using the PRIMER 6.1.16 package and the PERMANOVA + v1.0.6 for PRIMER (Clarke & Gorley, Reference Clarke and Gorley2006; Anderson et al., Reference Anderson, Gorley and Clarke2008). The matrices of the diatom taxon numbers were analysed by cluster analysis and non-metric multidimensional scaling (nMDS) ordination on Euclidean distance matrices from log-transformed data (Clarke & Gorley, Reference Clarke and Gorley2006). The canonical analysis of principal coordinates (CAP) was use to discriminate the differences in species composition patterns of the diatom communities, based on the Sørensen similarity matrices from the species presence/absence data (Anderson et al., Reference Anderson, Gorley and Clarke2008). The relationship between similarity matrices was analysed using the Spearman rank correlation coefficient (p value) which was computed by the routine RELATE (Clarke & Gorley, Reference Clarke and Gorley2006). The standard errors of the community parameters between both enumeration schemes were summarized using the coefficient of variation (CV) (Xu et al., Reference Xu, Zhang, Jiang, Zhu and Al-Resheid2012b). The t-test was used to evaluate the differences in the taxonomic distinctness parameters between depths of 1 and 3 m at the 0.05 level, using the software SPSS (version 16.0). Data were log-transformed before analysis (Liu et al., Reference Liu, Zhang and Xu2013).
RESULTS
Taxonomic composition and temporal variation
A total of 14 biofilm-associated diatom species, belonging to 10 genera, 9 families, 6 orders and 2 classes, were recorded at depths of 1 and 3 m throughout the period of study (Table 1 and Figure 2a, for details see Appendix). Taxonomic composition showed the same pattern at both depths (Table 1 and Figure 3).
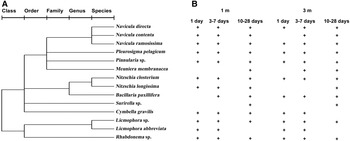
Fig. 2. Classification of biofilm-associated diatoms into five ranks, i.e. species, genus, family, order and class (A), and their temporal and spatial occurrence (presence/absence) pattern (B) during the 1–28-day colonization periods at depths of 1 and 3 m in coastal waters of the Yellow Sea, northern China.
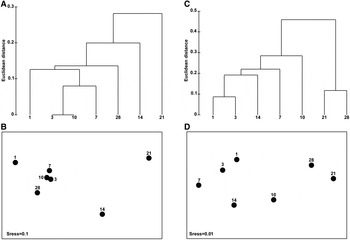
Fig. 3. Clustering analyses (A, C) and MDS ordinations (B, D) for the matrices of taxon numbers of diatoms during the 1–28-day colonization periods at depths of 1 (A, B) and 3 m (C, D) in coastal waters of the Yellow Sea, northern China.
Table 1. Numbers of taxa at five taxonomic levels of species (S), genus (G), family (F), order (O) and class (C) of total periphytic diatom communities and their distribution at depths of 1, 3 m and both in coastal waters of the Yellow Sea, northern China during the study period.
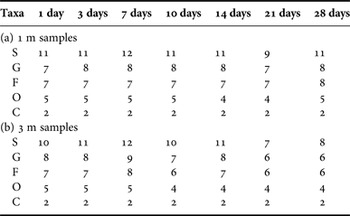
The numbers of the diatom taxa at 1, 3, 7,…, 14 day colonization times remained stable generally (Table 2). It should be noted that these counts were comparatively higher at 1 m than at 3 m, especially in the 21–28 day colonization periods (Table 2).
Table 2. Accumulative numbers of taxa at five taxonomic levels of species (S), genus (G), family (F), order (O) and class (C) of total periphytic diatom communities with 1, 3, 7, 10, 14, 21 and 28-day ages at depths of 1 (a) and 3 m (b) in coastal waters of the Yellow Sea, northern China.
Colonization dynamics in community pattern
The temporal variations in species composition of the diatom communities during the colonization periods of 1–28 days were discriminated by CAP ordination on Sørensen similarity matrices from the species presence/absence data (Figure 4). The first canonical axis (CAP 1) mainly separated the immature (1–7 day) diatom communities (on the left) from the mature (10–28 day) (on the right), while the second canonical axis (CAP 2) mainly discriminated those collected at 3 m (upper) from those collected at 1 m (lower) (Figure 4a).
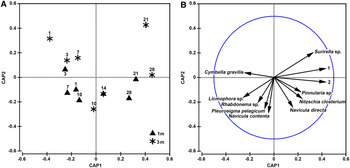
Fig. 4. CAP ordination (A) with correlations (B) of diatom species with correlation coefficients >0.5 CAP axes, showing the differences in taxonomic pattern of the diatom microflora during the 1–28-day colonization periods at depths of 1 and 3 m in coastal waters of the Yellow Sea, northern China. 1 means Meuniera membranacea and 2 refers to Navicula ramosissima.
A vector overlay of Pearson correlations of 11 species (correlation coefficients >0.5) with the CAP axes is shown in Figure 4b. Vectors for six diatom species (Nitzschia closterium, Navicula directa, Meuniera membranacea, Bacillaria paxillifera, Surirella sp. and Pinnularia sp.) pointed toward the mature sample cloud (right) and for five species (Cymbella gravilis, Pleurosigma pelagicum, Navicula contenta, Licmophora sp. and Rhabdonema sp.) toward the immature samples from a depth of 1 m (lower) (Figure 4b).
Temporal patterns of taxonomic distinctness measures
The temporal variations of taxonomic distinctness indices of the diatom communities colonizing the glass slides during study period are shown in Figure 5. The taxonomic diversity (Δ) represented a high variability (coefficients of variation >10%) among both immature and mature communities (Figure 5a), whereas the taxonomic distinctness (Δ*), average taxonomic distinctness (Δ+) and the variation in taxonomic distinctness (Λ+) showed a high stability (coefficients of variation <10%) during the colonization times of 3–28 days (Figure 5b–d).
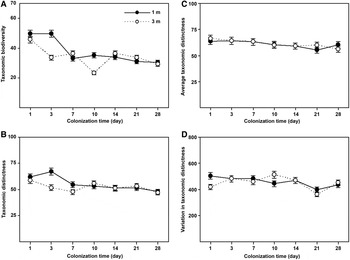
Fig. 5. Temporal variations of the taxonomic diversity (A), taxonomic distinctness (B), average taxonomic distinctness (C) and variation in taxonomic distinctness (D) of periphytic diatom communities during the 1–28-day colonization periods at depths of 1 and 3 m in coastal waters of the Yellow Sea, northern China.
Statistical analyses (t-test) showed that all four measures had higher values of the 1- and 28-day diatom communities at a depth of 1 m than those at 3 m (t-test: P < 0.05; Figure 5), while there was a high variability (CV values >10%) between the two depths (Figure 6). It should be noted that the average taxonomic distinctness (Δ+) maintained stable values (<10% CV) during the colonization times of 1–28 days at both depths (Figures 5c and 6c).
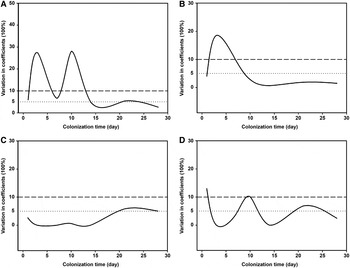
Fig. 6. Coefficients of variations of taxonomic diversity (A), taxonomic distinctness (B), average taxonomic distinctness (C) and variation in taxonomic distinctness (D) of periphytic diatom communities between depths of 1 (A, C) and 3 m (B, D) in coastal waters of the Yellow Sea, northern China during 1–28-day colonization periods.
DISCUSSION
Colonization dynamics of biofilm-associated diatoms are commonly affected positively by the additive factors of cell immigration and reproduction, while negative effects may be due to cell loss through sloughing or death, and cell removal by grazers (Railkin, Reference Railkin1998; Liu et al., Reference Liu, Zhang and Xu2014). Previous studies have demonstrated that cell death is not a major factor compared with the potential losses by sloughing, and that grazers were also considered to have little impact on the colonization dynamics (Stevenson, Reference Stevenson1984; Oemke & Burton, Reference Oemke and Burton1986). Our previous investigations have demonstrated that during the primary colonization process, the periphyton abundance generally increases and then equilibrates, following a logistic equilibrium model (Zhang et al., Reference Zhang, Xu, Jiang, Zhu and Al-Resheid2012, Liu et al., Reference Liu, Zhang and Xu2013).
Compared with traditional biodiversity indices at species resolution, such as species richness, evenness and diversity, the biodiversity measures based on taxonomic distinctness have proven to be robust indicators for the evaluation of ecological/environmental quality status (Warwick & Clarke, Reference Warwick and Clarke2001; Tan et al., Reference Tan, Shi, Liu, Xu and Nie2010; Xu et al., Reference Xu, Jiang, Al-Rasheid, Al-Farraj and Song2011a; Shi et al., Reference Shi, Liu, Liu, Sun and Xu2012). Based on the present data, all four taxonomic distinctness measures represented different dependence on the communities with different ages, i.e. high sensitivity for the immature communities but low sensitivity for the mature communities. Otherwise, the taxonomic distinctness indices showed a low variability in the mature communities of the diatoms compared with the traditional biological indices (Liu et al., Reference Liu, Zhang and Xu2014). This finding implies that taxonomic distinctness indices have the additional advantages of being more stable and more reliable than traditional biodiversity indices when using mature diatom-biofilm for bioassessment of water quality.
Note that taxon numbers were higher at a depth of 1 m than at 3 m, even though the diatom community structure was similar at the two depths. This may be mainly due to the reduced light penetration at a depth of 3 m in the water columns with a diaphaneity of ~ 3 m. In the 28-day samples collected at 1 m, however, the taxonomic diversity and variation in taxonomic distinctness dropped sharply, mainly due to the intensive immigration of predation consumers. Thus, it is suggested that the colonization ages of 3–21 days are probably optimal to measure the taxonomic distinctness of the diatom microflora.
In summary, the colonization dynamics of diatom microflora showed similar species composition at both depths. In the young communities (1–7 days), the taxonomic patterns showed high variability compared with those in the mature ones (10 days and more). However, taxonomic distinctness indices at the two depths differed during early stages (e.g. 1–3 days). The taxonomic diversity (Δ) represented a high variability (coefficients of variation >10%) over the total colonization period, whereas the taxonomic distinctness (Δ*), average taxonomic distinctness (Δ+) and variation in taxonomic distinctness (Λ+) showed high stability (coefficients of variation <10%) after 7 days. Based on these findings, we suggest that an exposure time of more than 7 days may be sufficient to identify the taxonomic distinctness of biofilm-associated diatom microflora for both community research and monitoring programmes in marine ecosystems. However, further studies on a range of marine waters and over extended time periods are needed in order to verify this conclusion.
SUPPLEMENTARY MATERIAL
To view supplementary material for this article, please visit http://dx.doi.org/10.1017/S002531541600028X
ACKNOWLEDGEMENTS
This work was supported by the National Natural Science Foundation of China (No. 41076089) and Scholarship Award for Excellent Doctoral Student granted by Chinese Ministry of Education.


