


Introduction
Naturally occurring uranyl sulfate minerals are common in oxidised parts of uranium deposits worldwide. They form due to supergene processes, such as oxidation and hydration of primary uranium minerals, mainly uraninite, and their interaction with acid solutions derived from the decomposition of primary sulfides, such as pyrite, chalcopyrite or sphalerite. The alteration of primary uranium ores under low-pH conditions generates highly mobile acid solutions, containing dissolved UO22+ as UO2–SO4 aqueous complexes, which yields a considerable environmental impact, especially around the old mining sites (Krivovichev and Plášil, Reference Krivovichev, Plášil, Burns and Sigmon2013; Plášil, Reference Plášil2014; Gurzhiy and Plášil, Reference Gurzhiy and Plášil2019). On the other hand, uranyl sulfates represent one of the most structurally and chemically complex families of naturally occurring U6+ phases. To date, 57 uranyl sulfate minerals are known, almost two thirds (37 mineral species) of which were described during the last ten years, thanks to impressive finds at several old mines in Red Canyon, Utah, USA and Jáchymov, Czech Republic. Most of these species represent new structure types. Their dimensional and topological diversity and complexity were recently reviewed by Gurzhiy and Plášil (Reference Gurzhiy and Plášil2019).
Herein, we describe another uranyl sulfate mineral with a novel structure that we named gurzhiite (pronouncing: gur zhi ait; cyrilic – гуржиит) in honour of Russian mineralogist and crystallographer Dr. Vladislav Vladimirovich Gurzhiy (born 17.12.1985), Associate Professor at the Department of Crystallography, and the Chairman of the Scientific Committee at the Institute of Earth Sciences, Saint-Petersburg State University. Dr. Gurzhiy is one of the leading Russian scientists in uranium mineralogy and crystallography. To date, he is the author and co-author of 47 publications focused on the crystal chemistry and structural complexity of uranium-bearing minerals and synthetic compounds (see, e.g. Gurzhiy et al., Reference Gurzhiy, Tyumentseva, Krivovichev, Krivovichev and Tananaev2016, Reference Gurzhiy, Krzhizhanovskaya, Izatulina, Sigmon, Krivovichev and Burns2018, Reference Gurzhiy, Kuporev, Kovrugin, Murashko, Kasatkin and Plášil2019, Reference Gurzhiy, Izatulina, Krzhizhanovskaya, Murashko, Spiridonova, Shilovskikh and Krivovichev2020, Reference Gurzhiy, Kalashnikova, Kuporev and Plášil2021; Gurzhiy and Plášil, Reference Gurzhiy and Plášil2019 etc.).
The new mineral and its name (symbol Grz) have been approved by the Commission on New Minerals, Nomenclature and Classification of the International Mineralogical Association (IMA2021-086; Kasatkin et al., Reference Kasatkin, Plášil, Chukanov, Škoda, Nestola, Agakhanov and Belakovskiy2022). The holotype specimen is deposited in the collections of the Fersman Mineralogical Museum of the Russian Academy of Sciences, Moscow, Russia, with the registration number 5756/1.
Occurrence and mineral association
The specimen that served as holotype was first discovered by Dmitry N. Tsebro in 2016. Additional material was also collected by him in 2019–2021. All the samples come from the 495 m level of the underground Mine #2, Bykogorskoe U deposit, Byk Mountain, Stavropol Krai, Northern Caucasus, Russia (44°11′05.4″N, 42°57′31.5″E) (Figs 1 and 2).
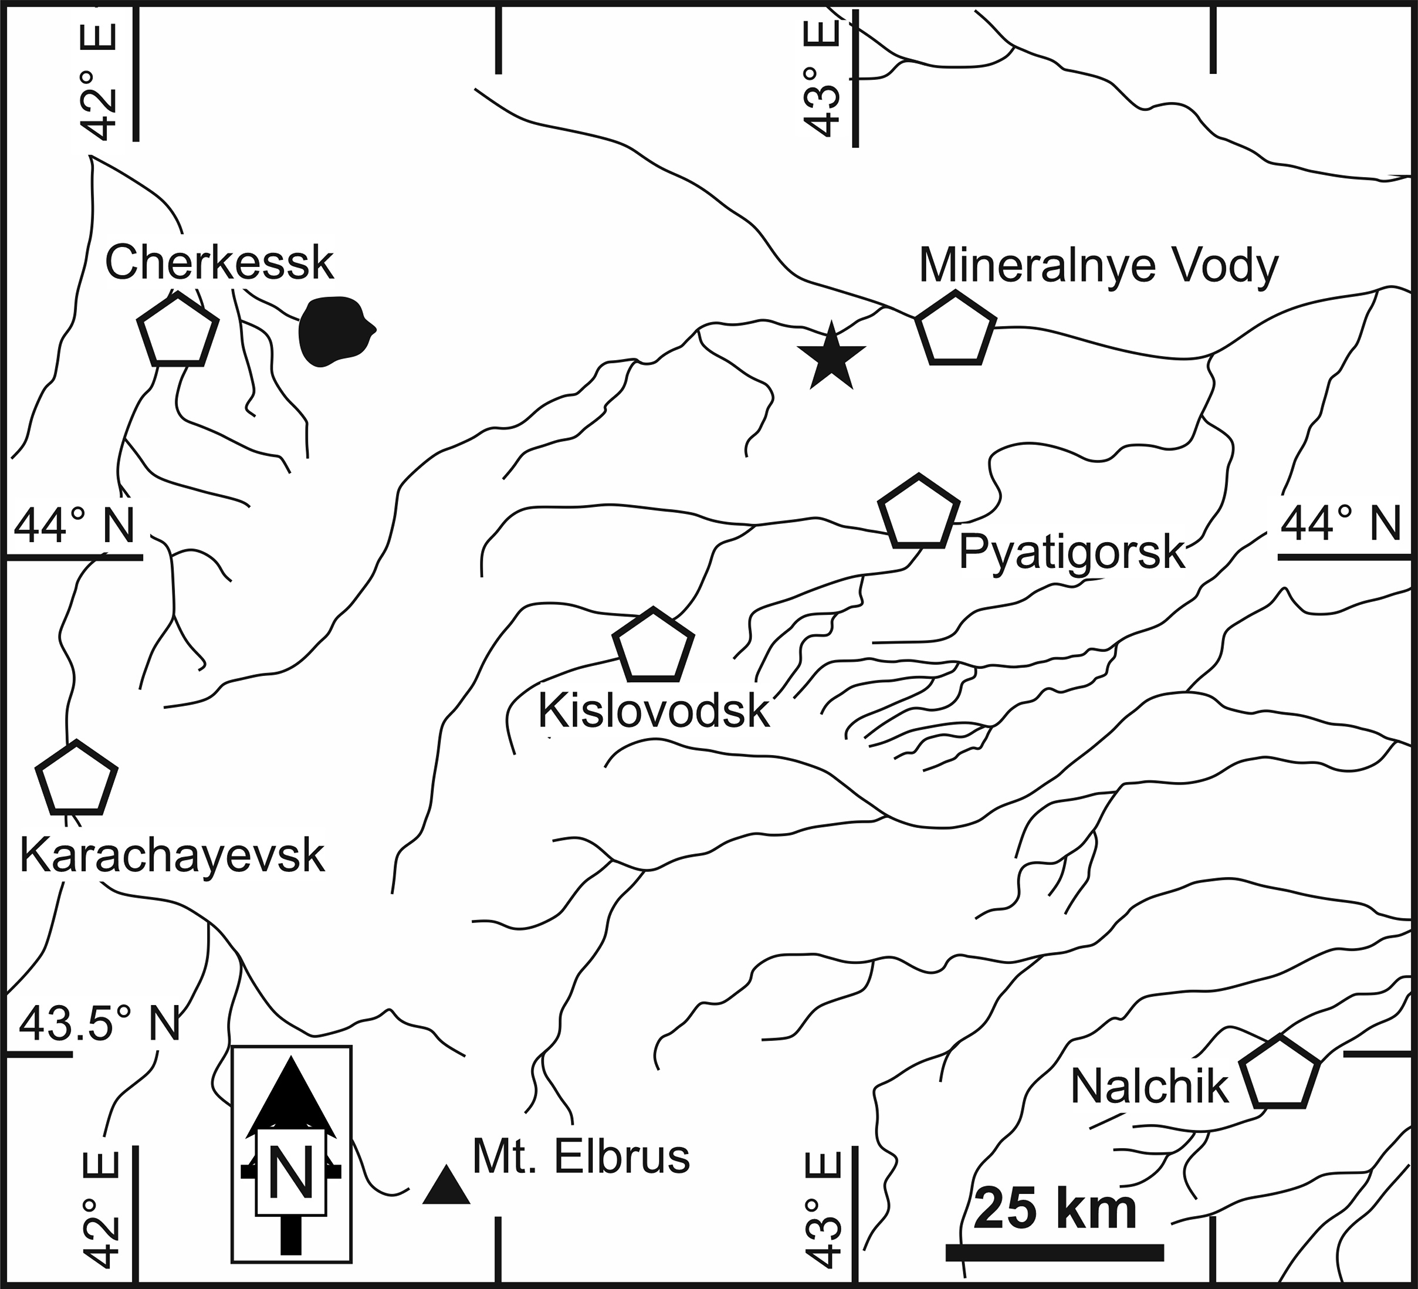
Fig. 1. Geographical position of Bykogorskoe U deposit (black star). Key: black lines and shaded areas = rivers and lakes; pentagon = city; triangle = Mt Elbrus.

Fig. 2. Bykogorskoe U deposit at Byk Mountain. Summer 2019. Photo: N. Operator.
The Bykogorskoe U deposit is confined to the hypabyssal intrusion of granite-porphyry (beshtaunites) that compose the dome-shaped uplift of Byk Mountain. The intrusion is surrounded by clayey and marly sedimentary rocks of the Paleogene age. Ore-controlling zones are the fractured zones of the north-western direction, feathering the meridional fault. As a result of exploration, 26 ore bodies grouped into four ore zones were identified. Industrial uranium mineralisation was located at two levels (535 and 495 m) in the cementation zone of the deposit. The ores of the deposit represent brecciated, limonitised, often crushed granite-porphyries (Belova and Tseitlin, Reference Belova and Tseitlin1959).
The underground workings at the deposit developed from the late 1940s until 1991. After they ceased, supergene oxidation of primary ores with uraninite and pyrite in the wet underground environment of the mine yielded different secondary minerals, mainly sulfates, including gurzhiite. They fill the intermittent cavities of ore bodies, infiltrate breccias, and form veinlets, coatings and crusts on the surface of cracks and mine walls (Fig. 3).

Fig. 3. Gurzhiite in situ. Field of view 2 × 1 m. Summer 2020. Photo: D. Tsebro.
Gurzhiite associates directly, and is sometimes intimately intergrown with, khademite. Other associated minerals include quartz and an unidentified fluoride of Al, most likely a F-analogue or a variety of nordstrandite Al(OH)2F. Other minerals found nearby, but not in close contact with gurzhiite include hydrokenoralstonite, natrozippeite and schröckingerite.
General appearance and physical properties
Gurzhiite occurs as fine-grained aggregates forming veinlets up to 50 cm long in cracks of the brecciated rock. Gurzhiite aggregates are composed of small bladed crystals up to 0.1 mm across flattened on {001}. The new mineral is pale yellow in crystals and lemon yellow in aggregates (Fig. 4a). It is transparent with vitreous lustre and a white streak. Its tenacity is brittle and its fracture is irregular. Good cleavage on {001} is observed. Gurzhiite exhibits a bright yellow–green fluorescence under both longwave and shortwave UV radiation (Fig. 4b). Mohs hardness based on scratch tests is ~2. Density measured by flotation in heavy liquids (bromoform + heptane) is 2.52(3) g/cm3; that calculated using the empirical formula and unit-cell volume obtained from single-crystal X-ray diffraction (XRD) data is 2.605 g/cm3. The lowered D meas value as compared to D calc may be due to porosity, inclusions of other minerals and/or partial dehydration of the mineral during measurement.

Fig. 4. (a) Lemon-yellow gurzhiite intermixed with white khademite; (b) same specimen under shortwave UV light. Specimen size: 1.4 × 0.8 cm. Specimen No.5756/1, photo: M. Milshina.
The mineral is colourless in transmitted light. It is biaxial (–) with α = 1.528(3), β = 1.538(2) and γ = 1.544(3) (589 nm). The estimated 2V angle based on the curve of the conoscopic figures is 80(10)°, the calculated 2V value is 75.1°. No dispersion or pleochroism were observed. The optical orientation cannot be determined due to the anhedral shape of the grains. The Gladstone–Dale compatibility index (Mandarino, Reference Mandarino1981) calculated based on the empirical formula and unit-cell parameters from the single-crystal XRD data is 1 – (K p/K c) = –0.007 (superior).
Spectroscopical studies
Infrared spectroscopy
In order to obtain an infrared (IR) absorption spectrum, a powdered gurzhiite sample was mixed with anhydrous KBr, pelletised, and analysed using an ALPHA FTIR spectrometer (Bruker Optics) in the range of 360–3800 cm–1, at a resolution of 4 cm–1. A total of 16 scans were collected. The IR spectrum of an analogous pellet of pure KBr was used as a reference. The assignment of absorption bands in the IR spectrum of gurzhiite (Fig. 5) was made in accordance with Čejka (Reference Čejka, Burns and Finch1999), Nakamoto (Reference Nakamoto2008, Reference Nakamoto2009), and Chukanov and Chervonnyi (Reference Chukanov and Chervonnyi2016). Bands in the range of 3200–3520 cm–1 correspond to O–H stretching vibrations of H2O molecules forming medium-strength hydrogen bonds (corresponding to O⋅⋅⋅O distances between ~2.7–3.1 Å; after Libowitzky (Reference Libowitzky1999). The bands at 2380 and 2550 cm–1 correspond to O–H stretching vibrations of minor amounts of acid OH groups presumably formed due to the dynamic equilibrium H2O + SO42– ↔ OH– + HSO4– which is typical for high-hydrous sulfates (Chukanov and Chervonnyi, Reference Chukanov and Chervonnyi2016). The bands at 1627 and 1675 cm–1 are due to bending vibrations of non-equivalent H2O molecules. The bands in the range of 1030–1200 cm–1 are assigned to asymmetric stretching vibrations of SO42– [the F 2 (ν3) mode]. The band at 1015 cm–1 corresponds to symmetric stretching vibrations of distorted SO42– anions [the A 1 (ν1) mode] and the one at 936 cm–1 to antisymmetric stretching vibrations of the uranyl cation, UO22+. The weak band at 858 cm–1 is attributed to symmetric stretching vibrations of UO22+. This band is forbidden in the IR spectrum of UO22+ with equivalent U–O bonds. Thus, the UO22+ group in gurzhiite is slightly distorted. This conclusion is in line with the structural data (see below). The bands in the range of 500–670 cm–1 correspond to Al–O stretching and SO42– bending [the F 2 (ν4) mode] vibrations and resonance modes involving these vibrations. Finally, the bands at 440 and 467 cm–1 are due to Al–F stretching and SO42– bending [the E (ν2) mode] vibrations, and/or resonance modes involving these vibrations. No bands of carbonate, nitrate, borate, and organic groups are observed in the IR spectrum of gurzhiite. The IR spectrum of gurzhiite is unique and does not have close analogues among IR spectra of other minerals.

Fig. 5. Powder infrared absorption spectrum of gurzhiite.
Raman spectroscopy
The Raman spectrum of gurzhiite (Fig. 6) was obtained using a Horiba Labram HR Evolution spectrometer. This dispersive, edge-filter-based system is equipped with an Olympus BX 41 optical microscope, a diffraction grating with 600 grooves per millimetre, and a Peltier-cooled, Si-based charge-coupled device (CCD) detector. After careful tests with different lasers (473, 532 and 633 nm), the 633 nm He–Ne laser with the beam power of 1 mW at the sample surface was selected for spectra acquisition to minimise analytical artifacts. A Raman signal was collected in the range of 100–4000 cm–1 with a 50× objective with the system being operated in confocal mode, a beam diameter of ~2.6 μm and lateral resolution of ~5 μm. No visual damage to the surface analysed was observed at these conditions after the excitation. Wavenumber calibration was done using the Rayleigh line and low-pressure Ne-lamp emissions. The wavenumber accuracy was ~0.5 cm–1, and the spectral resolution was ~2 cm–1. Band fitting was done after appropriate background correction, assuming combined Lorentzian–Gaussian band shapes using the Voigt function (PeakFit; Jandel Scientific Software, http://www.sigmaplot.co.uk/products/peakfit/peakfit.php). The assignment of the Raman bands is as follows. The bands in the range of 2900–3550 cm–1 correspond to O–H stretching vibrations. The weak bands at 1612 and 1677 cm–1 are due to bending vibrations of H2O molecules. The bands in the 1020–1200 cm–1 range are attributed to asymmetric stretching vibrations of SO42– [the F 2(ν3) mode]. The bands at 991 and 1013 cm–1 correspond to symmetric stretching vibrations of two non-equivalent SO42– anions [the A 1(ν1) mode]. The weak band at 930 cm–1 is assigned to antisymmetric stretching vibrations of the uranyl cation. This band is forbidden in the Raman spectrum of UO22+ with equivalent U–O bonds, which is another proof of the slightly distorted character of the UO22+ group in gurzhiite. Bands at 833, 843 and 861 cm–1 are due to symmetric stretching vibrations of UO22+, while those in the range of 500–650 cm–1 – to Al–O stretching and SO42– bending [the F 2(ν4) mode] vibrations, as well as resonance modes involving these vibrations. Bands at 448 and 461 cm–1 correspond to Al–F stretching and SO42– bending [the E(ν2) mode] vibrations, as well as resonance modes involving these vibrations. The bands in the range of 160–230 cm–1 are attributed to UO22+ bending vibrations. Other Raman bands observed below 400 cm–1 correspond to lattice modes involving vibrations of the UO22+ and SO42– groups as a whole (acoustic modes).

Fig. 6. Raman spectrum of gurzhiite excited by 633 nm laser: in the 100–1250 cm–1 region (above) and in the 2500–3600 cm–1 region (below). The measured spectrum is shown by dots. The curve matched to the dots is a result of spectral fit as a sum of individual Voigt peaks shown below the curve.
As seen below, there is only one site of U in the structure. Thus, only one band in the region of 830 to 870 cm–1 would be expected (as it takes place in the IR spectrum). However, three Raman bands are observed for gurzhiite in this range. The most convincing explanation would be Fermi resonance with overtones of the bands at 448 and 461 cm–1 provided that these bands correspond to Al–F stretching vibrations. Otherwise (in the case of bending vibrations of SO42–) a positive anharmonic shift would be expected.
Chemical composition and chemical properties
Nine electron-microprobe analyses were carried out with a Cameca SX-100 electron microprobe in wavelength dispersive spectroscopy (WDS) mode with an accelerating voltage of 15 kV, a beam current on the specimen of 2 nA and a beam diameter of 8 μm. Peak counting times (CT) were 20 s for all elements; CT for each background was one-half of the peak time. The raw intensities were converted into concentrations using X-PHI (Merlet, Reference Merlet1994) matrix-correction software.
Hydrogen was analysed by gas chromatography of products of gurzhiite thermolysis at 1200°C in oxygen with a CHN Vario Micro cube analyzer (Elementar GmBH, Germany).
Analytical data and used standards are given in Table 1. Contents of other elements with atomic numbers higher than that of beryllium are below detection limits. The empirical formula based on both WDS and CHN analyses calculated on the basis of 21(O+F) apfu is Al0.92Zn0.05Fe3+0.03Na0.03U0.95S2.00O9.85F0.99⋅10.16H2O.
Table 1. Chemical composition of gurzhiite (wt.%).

* 27.14 wt.% H2O is calculated from 3.037 wt.% H determined by CHN-analysis.
S.D. – standard deviation
The ideal formula is Al(UO2)(SO4)2F⋅10H2O, which requires Al2O3 7.40, UO3 41.53, SO3 23.28, F 2.76, H2O 26.19, –O=F –1.16, total 100 wt.%.
Gurzhiite is soluble in water and dissolves in hydrochloric and nitric acids without gas evolution.
X-ray diffraction data
The powder X-ray diffraction (XRD) data (Table 2) were obtained using a DRON-2.0 diffractometer with FeKα radiation, Mn-filter and quartz used as an internal standard. The unit-cell parameters refined from the powder data using UNITCELL software by Holland and Redfern (Reference Holland and Redfern1997) are as follows: gurzhiite is triclinic, P $\bar{1}$ , a = 7.179(2), b = 11.728(2), c = 11.757(2) Å, α = 67.15(2), β = 107.76(2), γ = 89.97(2)°, V = 860.7(2) Å3 and Z = 2.
Table 2. Powder X-ray diffraction data (d in Å) of gurzhiite.

*For the calculated pattern only reflections with intensities ≥5 are given
The strongest reflections are given in bold
The single-crystal X-ray diffraction data were collected using a Supernova Rigaku-Oxford Diffraction diffractometer equipped with micro-source MoKα radiation (λ = 0.71073 Å; 50 kV, 0.8 mA) and a Pilatus 200K Dectris detector. The sample-to-detector distance was set to 68 mm. The data were collected by 1569 frames over 27 runs; the exposure time was 60 seconds per frame for a total time equal to 26 hours and 17 minutes. The data were processed by Crysalis Pro 41_64.113a software (Rigaku Oxford Diffraction). The triclinic unit-cell parameters determined from single-crystal data are as follows: a = 7.193(2), b = 11.760(2), c = 11.792(2) Å, α = 67.20(3)°, β = 107.76(3)°, γ = 89.99(3)° and V = 867.7(4) Å3 (Z = 2).
The crystal structure of gurzhiite was solved from single-crystal X-ray data using the intrinsic phasing algorithm of the program SHELXT (Sheldrick, Reference Sheldrick2015) and refined to R obs = 0.0565 and wR obs = 0.1098 for 3236 reflections with I > 3σ(I). The initially determined monoclinic cell with a = 20.683, b = 7.193, c = 11.760 Å, β = 97.290(4)° and V = 2 × 867.7 Å3 corresponds to I-centred symmetry. However, based on the metrics and space-group tests procedures implemented in Jana2020, which is the successor of the Jana2006 program (Petříček et al., Reference Petříček, Dušek and Palatinus2014), we concluded that the crystal studied is twinned and its true symmetry is triclinic, as indicated above. The monoclinic pseudo-cell with doubled volume results from the twinning due to metric merohedry (diffraction type I; Petříček et al., Reference Petříček, Dušek and Plášil2016). The twinned super-cell can be obtained via a mirror in (101), leading to a monoclinic I-centred cell mentioned above. No H atoms could have been successfully localised from the difference-Fourier maps. In line with the previously refined structure of straßmannite (Kampf et al., Reference Kampf, Plášil, Kasatkin, Nash and Marty2019), we have initially assigned the cation–anion distance of ~1.79 Å in the Al-centred tetrahedron, which is too short for Al–O or Al–${\rm O}_{{\rm H}_ 2{\rm O}}$ , to the Al–F bond. The results of the chemical study indicate that there should be nearly stoichiometric content of F (1 F apfu) which is in line with the structure refinement, taking into account that O9 is to be fully occupied by F (therefore designated as F9 further on). The rest of the bonds around Al sites are also somewhat shorter than the regular Al–O bonds. Thus, F may be distributed among those O sites. Nevertheless, the attempts to refine all of the ligands as mixed O/F sites did not improve the fit. Therefore the single F site was kept for the final model. Final refinement using anisotropic displacement parameters for the majority of remaining atoms in the structure converged with reasonable values of agreement (Table 3). The final fit also required restrictions on the U–O bond-lengths in uranyl, hence U–O1/O2 distances were restrained to 1.800(5) Å, as the refined values were slightly unrealistically short (~1.73 Å). We account for that as due to a complete overlap of the measured intensities of reflections due to twinning. Atom coordinates and isotropic/equivalent displacement parameters are given in Table 4 (anisotropic ones are listed in the crystallographic information file). Selected interatomic distances are listed in Table 5 and a bond-valence analysis, done following the procedure of Brown (Reference Brown2002) using bond-valence parameters by Gagné and Hawthorne (Reference Gagné and Hawthorne2015) and Brown and Altermatt (Reference Brown and Altermatt1985) (for the Al–F bond) is in Table 6. The crystallographic information file has been deposited with the Principal Editor of Mineralogical Magazine and is available as Supplementary material (see below).
Table 3. Summary of data collection conditions and refinement parameters for gurzhiite.

Table 4. Atom coordinates, isotropic and equivalent displacement parameters (in Å) for gurzhiite.

Table 5. Selected interatomic distances (in Å) in the crystal structure of gurzhiite.

Symmetry codes: (i) –x, –y–2, –z+1; (ii) –x, –y–1, –z+1; (iii) –x+2, –y–1, –z+2; (iv) –x–1, –y, –z.
Table 6. Bond-valence analysis (values given in the valence units, vu) of the crystal structure of gurzhiite.

Notes: Sum+H – the sum of the BV including assumed H bonds (considering the theoretical H-bond strengths of 0.8 or 0.2 vu for O atoms belonging to H2O molecules being donors of H bonds and O atoms – acceptors of H bonds, respectively, after Brown, Reference Brown2002); nH – theoretical number of the weak H bonds that could be accepted by the O atom; O+H – a character of the O atom which, however, has to accept at least one weak H bond to meet its bond-valence requirements.
Description of the crystal structure
The structure of gurzhiite contains a single U site, two S sites, two Al sites, one F and twenty O sites (Fig. 7). The U site is linked to seven O atoms forming a squat UO7 pentagonal bipyramid, where two short (~1.8 Å in length) apical bonds constitute the uranyl ion (Table 5). This is the most typical coordination for hexavalent uranium in the form of the uranyl ion, UO22+, particularly in uranyl sulfates. The UO7 bipyramids share four of their equatorial vertices (O3, O8, O10 and O12) with tetrahedrally coordinated sulfur atoms, forming thus four monodentate UO7–SO4 linkages. The remaining unshared equatorial vertex O21 of the uranyl bipyramid (Table 6) is occupied by the O atom of the H2O molecule forming hydrogen bonds with free vertices of the SO4 tetrahedra, the same as takes place in straßmannite (Kampf et al., Reference Kampf, Plášil, Kasatkin, Nash and Marty2019). The UO7 and SO4 polyhedra with attached water molecules form infinite [(UO2)(SO4)2(H2O)]2– chains running along [010]. Between the chains, there are two independent Al-based octahedra, Al1(H2O)6 and Al2F2(H2O)4. They are linked to the chains on either side via a complex network of assumed hydrogen bonds.

Fig. 7. Crystal structure of gurzhiite. (a) View down b and (b) viewed down a (perpendicular to the infinite UO7–SO4 chains). UO7 polyhedra yellow with black edges, SO4 tetrahedra light yellow without emphasised edges, Al-octahedra grey, O atoms of the H2O molecules in aqua, otherwise purely O atoms are in red and F in green; unit-cell edges outlined in black solid lines.
Chains found in gurzhiite (Fig. 8) are of the same topology as chains in the uranyl sulfates bobcookite, Na(H2O)2Al(H2O)6[(UO2)2(SO4)4(H2O)2]⋅8H2O (Kampf et al., Reference Kampf, Plášil, Kasatkin and Marty2015a), oppenheimerite, Na2(H2O)2[(UO2)(SO4)2(H2O)] (Kampf et al., Reference Kampf, Plášil, Kasatkin, Marty and Čejka2015b), svornostite, K2Mg[(UO2)(SO4)2]2⋅8H2O (Plášil et al., Reference Plášil, Hloušek, Kasatkin, Novák, Čejka and Lapčák2015), rietveldite, Fe(UO2)(SO4)2⋅5H2O (Kampf et al., Reference Kampf, Sejkora, Witzke, Plášil, Čejka, Nash and Marty2017), oldsite, K2Fe[(UO2)(SO4)2]2⋅8H2O (Plášil et al., Reference Plášil, Kampf, Ma and Desor2021), synthetic K2[(UO2)(SO4)2(H2O)](H2O) (Ling et al., Reference Ling, Sigmon, Ward, Roback and Burns2010), and synthetic Mn(UO2)(SO4)2(H2O)5 (Tabachenko et al., Reference Tabachenko, Serezhkin, Serezhkina and Kovba1979).

Fig. 8. Crystal structures of (a) gurzhiite and related uranyl sulfates (b–g): (b) bobcookite (Na-octahedra in green and Al octahedra in blue–grey); (c) oppenheimerite (Na as green balls); (d) synthetic Mn(UO2)(SO4)2(H2O)5; (e) svornostite (Mg in gold and K lavender); (f) rietveldite (Fe-octahedra green, mixed Fe-Zn octahedra in blue colour); (g) oldsite (Fe in green and K lavender). O atoms of the isolated H2O groups are in azure-blue, other O atoms are in red; H atoms were omitted for clarity. Unit-cell edges are outlined by black lines.
Discussion
Chemically, gurzhiite, Al(UO2)(SO4)2F⋅10H2O (Z = 2), is very similar to straßmannite, Al(UO2)(SO4)2F⋅16H2O (Z = 4) (Kampf et al., Reference Kampf, Plášil, Kasatkin, Nash and Marty2019), being the lower hydrate of the latter. Straßmannite was also found in Mine #2 of the Bykogorskoe deposit and reliably identified by semi-quantitative energy-dispersive spectroscopy analysis (Al, U, S and F with approximate ratio 1:1:2:1) and single-crystal XRD (monoclinic unit-cell with a = 11.011(2), b = 8.3103(15), c = 26.635(10) Å, β = 97.48(2)°, V = 2417(1) Å3). Thus, one can suppose that gurzhiite may form via dehydration of straßmannite. However, this transformation would be accompanied by a significant structural reorganisation as the straßmannite structure is based upon uranyl sulfate sheets, while gurzhiite is based upon uranyl sulfate chains. Usually, the mechanism/trend in hydrated oxysalts is that the structures of higher hydrates are based upon the clusters or chains (due to the depolymerising action of H2O), while the lower hydrates have sheet structures (c.f. Hawthorne and Sokolova, Reference Hawthorne and Sokolova2012). Therefore, we do not think that gurzhiite at the Bykogorskoe deposit formed from straßmannite. Noteworthy is that gurzhiite and straßmannite have been found at different levels of the Mine #2 of the Bykogorskoe deposit, i.e. at a substantial distance from each other, so they probably formed in a different underground environment (different humidity, oxidising conditions and pH).
From the point of the view of the structural complexity (sensu Krivovichev, Reference Krivovichev2013), straßmannite possesses a complex structure, with 699 bits/unit-cell (Gurzhiy and Plášil, Reference Gurzhiy and Plášil2019). Gurzhiite is less complex, having 482.43 bits/unit-cell [calculated by the program TOPOS including theoretical/dummy H atoms (Blatov et al., Reference Blatov, Shevchenko and Proserpio2014)], which is in line with the lower total atomic content of the unit cell as the structure is smaller. Notably, gurzhiite has a greater complexity per atom, 5.48 bits/atom, than 5.07 bits/atom in straßmannite.
Another interesting point is the fluorine content in gurzhiite. Fluorine, in general, is a very rare component of uranyl oxysalts. Gurzhiite is only the second (after straßmannite) uranyl sulfate from 57 and only the eighth (after albrechtschraufite, arsenuranospathite, chistyakovaite, nollmotzite, schröckingerite, straßmannite and uranospathite) uranyl oxysalt to contain F as a species-defining element. Most of these minerals also have essential Al. Earlier, Kampf et al. (Reference Kampf, Plášil, Kasatkin, Nash and Marty2019) noted the well-known affinity of Al for F and suggested that there were Al fluoride complexes in the solutions from which straßmannite and other Al–U–F-bearing minerals formed. In the case of gurzhiite, such a precursor could be an unidentified fluoride of Al, most likely a F-analogue or a variety of nordstrandite Al(OH)2F found in close association with the former.
Supplementary material
To view supplementary material for this article, please visit https://doi.org/10.1180/mgm.2022.34
Acknowledgements
We thank reviewers Sergey Krivovichev, Travis Olds and Nicolas Meisser, Structural Editor Peter Leverett and Principal Editor Stuart Mills for valuable comments. This study was funded by the Czech Science Foundation (GACR 20-11949S to J.P.) and by OP VVV project (Geobarr CZ.02.1.01/0.0/0.0/16_026/0008459 to R.Š.). The IR spectroscopy study, interpretation of the Raman spectrum, and analysis of H2O were performed in accordance with the state task of the Russian Federation, state registration No. ААAА-А19-119092390076-7.
Competing interests
The authors declare none.


