


More than one in five children in the United States will be exposed to violence by the time they reach adulthood (Finkelhor, Ormrod, & Turner, Reference Finkelhor, Ormrod and Turner2009; McLaughlin et al., Reference McLaughlin, Koenen, Hill, Petukhova, Sampson, Zaslavsky and Kessler2013). Exposure to violence is associated with myriad negative outcomes across the life span, including psychopathology (McLaughlin et al., Reference McLaughlin, Green, Gruber, Sampson, Zaslavsky and Kessler2012), social difficulties (Shonk & Cicchetti, Reference Shonk and Cicchetti2001), and poor academic functioning (Holt, Finkelhor, & Kantor, Reference Holt, Finkelhor and Kantor2007). Most prior research has focused on disruptions in emotional processing as a possible mechanism linking violence exposure to downstream negative outcomes (Hanson et al., Reference Hanson, Chung, Avants, Shirtcliff, Gee, Davidson and Pollak2010; McLaughlin, Busso, et al., Reference McLaughlin, Busso, Duys, Green, Alves, Way and Sheridan2014). Less is known about how violence exposure influences cognitive processes. Animal models demonstrate that experiences of stress influence prefrontal cortex (PFC) structure and function (Lupien, McEwen, Gunnar, & Heim, Reference Lupien, McEwen, Gunnar and Heim2009), and several studies have observed alterations in PFC structure among children who have experienced violence (Gold et al., Reference Gold, Sheridan, Peverill, Busso, Lambert, Alves and McLaughlin2016; Hanson et al., Reference Hanson, Chung, Avants, Shirtcliff, Gee, Davidson and Pollak2010). Considerably less research has examined the link between violence exposure and PFC function, particularly within emotionally salient contexts. Here, we investigate how exposure to violence in childhood influences neural systems supporting working memory (WM), a core cognitive process that underlies executive functions and relies heavily on PFC circuitry, with a task examining memory for emotional facial expressions.
WM is a core domain of executive functioning that is involved in many other higher order cognitive processes, including inhibition, planning, problem solving, and rule-based learning (Barrett, Tugade, & Engle, Reference Barrett, Tugade and Engle2004; Miyake & Friedman, Reference Miyake and Friedman2012). Conceptual models of the neurodevelopmental consequences of childhood adversity posit that experiences involving deprivation, or an absence of cognitive stimulation and enrichment in the early environment, should have particularly pronounced effects on cognitive development, including executive functioning and WM, and the frontoparietal networks that support these processes (McLaughlin, Sheridan, & Lambert, Reference McLaughlin, Sheridan and Lambert2014; Sheridan & McLaughlin, 2014). Behavioral studies support these predictions and have consistently found disruptions in WM for nonemotional information among individuals who have experienced forms of childhood adversity involving deprivation, such as institutional rearing (Tibu et al., Reference Tibu, Sheridan, McLaughlin, Nelson, Fox and Zeanah2016), poverty (Lipina et al., Reference Lipina, Segretin, Hermida, Prats, Fracchia, Camelo and Colombo2013), and low family socioeconomic status (SES; Sarsour et al., Reference Sarsour, Sheridan, Jutte, Nuru-Jeter, Hinshaw and Boyce2011). These behavioral differences are likely mediated by atypical development of neural structure and function following deprivation. Deprivation-related experiences, including poverty and institutional rearing, are associated with widespread reductions in cortical thickness and surface area (Mackey et al., Reference Mackey, Finn, Leonard, Jacoby-Senghor, West, Gabrieli and Gabrieli2015; McLaughlin, Sheridan, Winter, et al., Reference McLaughlin, Sheridan, Winter, Fox, Zeanah and Nelson2014; Noble et al., Reference Noble, Houston, Brito, Bartsch, Kan, Kuperman and Sowell2015); these reductions in cortical surface area and volume mediate the association between SES and performance on WM tasks (Noble et al., Reference Noble, Houston, Brito, Bartsch, Kan, Kuperman and Sowell2015). Functionally, deprivation related to low SES is associated with atypical recruitment in frontoparietal networks during WM tasks, including the middle frontal gyrus (MFG) and intraparietal sulcus (IPS; Finn et al., Reference Finn, Minas, Leonard, Mackey, Salvatore, Goetz and Gabrieli2016; Sheridan, Peverill, Finn, & McLaughlin, Reference Sheridan, Peverill, Finn and McLaughlin2017). In one of these studies, associations of SES with WM were observed after adjusting for violence exposure (Sheridan et al., Reference Sheridan, Peverill, Finn and McLaughlin2017). It is critical that these behavioral and magnetic resonance imaging (MRI) studies have all focused on “cold” cognitive, or nonemotional, forms of WM.
In contrast, studies of childhood experiences of threat (i.e., violence) and WM have produced mixed findings, with some studies finding poor WM ability following violence exposure after adjusting for co-occurring deprivation (DePrince, Weinzierl, & Combs, Reference DePrince, Weinzierl and Combs2009; Gould et al., Reference Gould, Clarke, Heim, Harvey, Majer and Nemeroff2012; Vasilevski & Tucker, Reference Vasilevski and Tucker2016), others reporting associations that fail to control for deprivation experiences known to be strongly linked to WM (Augusti & Melinder, Reference Augusti and Melinder2013), and some finding no association between violence exposure and WM (Twamley, Hami, & Stein, Reference Twamley, Hami and Stein2004). Given the high degree of overlap between experiences of threat and deprivation (McLaughlin, Sheridan, & Lambert, Reference McLaughlin, Sheridan and Lambert2014), studies measuring and accounting for these exposures are necessary to better characterize the distinct and overlapping associations with WM. For example, a recent study from our lab found that parental education is strongly associated with spatial WM and superior parietal cortex recruitment during encoding after controlling for violence exposure, but violence exposure exhibits no association with WM performance or neural recruitment after adjusting for parental education (Sheridan et al., Reference Sheridan, Peverill, Finn and McLaughlin2017).
One possible explanation for these discrepancies is that violence exposure primarily influences WM performance in the context of emotional information, particularly in the presence of emotional cues that signal potential threat. This is consistent with theoretical conceptualizations of violence exposure as representing an environmental threat that exists along a continuum from witnessing violence to being directly victimized (McLaughlin, Sheridan, & Lambert, Reference McLaughlin, Sheridan and Lambert2014; Sheridan & McLaughlin, Reference Sheridan and McLaughlin2014); experiences along this continuum should have strong influences on social information processing in the presence of salient emotional cues, particularly those involving potential threat (McLaughlin & Lambert, Reference McLaughlin and Lambert2016). Studies have consistently shown that children who have experienced or witnessed violence exhibit preferential attention and heightened perception to socially threatening cues, such as angry faces (Pollak, Cicchetti, Hornung, & Reed, Reference Pollak, Cicchetti, Hornung and Reed2000; Pollak & Tolley-Schell, Reference Pollak and Tolley-Schell2003; Swartz, Graham-Bermann, Mogg, Bradley, & Monk, Reference Swartz, Graham-Bermann, Mogg, Bradley and Monk2011) and a variety of other information processing biases that facilitate the rapid identification of threat-related information in the environment (Lambert et al., Reference Lambert, Sheridan, Sambrook, Rosen, Askren and McLaughlin2017; McLaughlin & Lambert, Reference McLaughlin and Lambert2016). Thus, WM might be particularly influenced by violence exposure when applied in the context of emotionally salient cues, particularly threat cues (i.e., angry faces). However, it is unclear whether information processing biases for threatening information would facilitate or disrupt WM performance among youth who have experienced violence. One possibility is that violence exposure would produce heightened memory for threat-related stimuli. Consistent with this, a recent study shows that adults exposed to violence as children have WM deficits for happy, but not angry, faces (Cromheeke, Herpoel, & Mueller, Reference Cromheeke, Herpoel and Mueller2014). Alternatively, heightened emotional reactivity to threat cues and generalization of threat responses to other stimulus types (e.g., neutral cues) is well documented in children exposed to violence (Lambert et al., Reference Lambert, Sheridan, Sambrook, Rosen, Askren and McLaughlin2017; McLaughlin & Lambert, Reference McLaughlin and Lambert2016; McLaughlin, Peverill, Gold, Alves, & Sheridan, Reference McLaughlin, Peverill, Gold, Alves and Sheridan2015), which could interfere with WM for threat-related stimuli or emotional stimuli more broadly. To our knowledge, no research has examined WM for emotionally salient stimuli, or the neural systems that support this process, among children who have experienced violence.
We do so in the present study. We investigate whether childhood violence exposure influences behavioral performance and neural activation during an emotional WM task. We examined this question by adapting a delayed match to sample WM task for emotional faces previously used in studies of adults (Braunlich, Gomez-Lavin, & Seger, Reference Braunlich, Gomez-Lavin and Seger2015; LoPresti et al., Reference LoPresti, Schon, Tricarico, Swisher, Celone and Stern2008). We expected that children and adolescents who experienced violence would perform worse on the WM task compared to youth without violence exposure, particularly when the emotional expression was neutral or happy. In contrast, based on work showing enhanced attention to threatening information among violence-exposed youths (Pollak et al., Reference Pollak, Cicchetti, Hornung and Reed2000; Pollak & Tolley-Schell, Reference Pollak and Tolley-Schell2003), we anticipated that youth who experienced violence would perform as well as children who had never experienced violence on trials involving angry faces. In addition, we expected that violence exposure would be associated with reduced activation during encoding in areas that support WM, including the MFG and IPS, specifically on happy and neutral trials, and that these neural differences would be a mechanism linking violence exposure to poor task performance on happy and neutral trials. Finally, we evaluated whether associations between violence exposure and WM persisted after controlling for family SES, as measured by parental education, and youth psychopathology.
Method
Participants
A sample of 66 participants aged 6 to 19 years (M = 13.58 years, SD = 3.25 years; 32 male) without MRI contraindications (e.g., orthodontic braces) participated. The sample was recruited from schools, after-school and prevention programs, medical clinics, and the general community in Seattle, Washington, between February 2014 and February 2015. Recruitment efforts aimed to recruit a sample with variation in violence exposure. To do so, we recruited from neighborhoods with high levels of violent crime, clinics that serve a predominantly low-SES catchment area, and agencies that work with families who have experienced violence (e.g., domestic violence shelters and programs for parents mandated to receive intervention by Child Protective Services). Approximately half (n = 32) were exposed to violence and half (n = 34) were gender- and age-matched controls. Participants in the control group had no violence exposure but were not excluded for exposure to other forms of trauma, such as accidents and injuries.
Eight participants (3 male, mean age: 10.23, SD = 3.26) were excluded from analyses due to below chance performance (i.e., <50% accuracy). One participant (female, 15 years) was excluded due to an incidental finding, and 3 participants (2 male, mean age: 8.57, SD = 2.09) did not complete the task in the scanner. The final analytic sample included 54 participants (n = 26 with violence exposure). See Table 1 for the sociodemographic characteristics of the final sample as a function of violence exposure.
Table 1. Distribution of sociodemographics and psychopathology by violence exposure

Note: Internalizing and externalizing symptoms were measured by the Youth Self-Report of the Child Behavior Checklist.
Procedure
The Institutional Review Board at the University of Washington approved all procedures. Participants were compensated, and written informed consent was obtained from legal guardians, while youths provided written assent.
Measures
Violence exposure
Violence exposure was defined using the DSM-5 (American Psychiatric Association, 2013) definition of trauma and included physical or sexual abuse, witnessing chronic domestic violence, and direct exposure to other violence (e.g., physically assaulted by a stranger). Violence exposure was assessed with the Childhood Experiences of Care and Abuse (CECA) interview (Bifulco, Brown, Lillie, & Jarvis, Reference Bifulco, Brown, Lillie and Jarvis1997), the Childhood Trauma Questionnaire (CTQ; Bernstein, Ahluvalia, Pogge, & Handelsman, Reference Bernstein, Ahluvalia, Pogge and Handelsman1997), and the University of California at Los Angeles Post-Traumatic Stress Disorder Reaction Index (PTSD-RI) trauma screen (Steinberg, Brymer, Decker, & Pynoos, Reference Steinberg, Brymer, Decker and Pynoos2004). The CECA assesses caregiving experiences, including exposure to physical and sexual abuse (i.e., coded as present or absent); we modified the interview to ask additional questions about witnessing domestic violence (i.e., directly observing violence directed at a caregiver). Interrater reliability for reports of violence exposure is excellent, and validation studies suggest high agreement between siblings on reports of violence (Bifulco et al., Reference Bifulco, Brown, Lillie and Jarvis1997). The CTQ is a 28-item scale that assesses the frequency of childhood physical and sexual violence and has good convergent and discriminant validity (Bernstein et al., Reference Bernstein, Ahluvalia, Pogge and Handelsman1997) and demonstrated good reliability within the present sample (α = 0.83). The child- and parent-report versions of the 13-item PTSD-RI trauma screen assessed for other violence exposure (e.g., victimization outside the home).
We used the CECA, CTQ, and PTSD-RI trauma screen to create a dichotomous indicator of violence exposure as our primary independent variable. Participants who reported physical abuse, sexual abuse, witnessing more than two incidents of domestic violence, directly experiencing other violence, or who had a score on the CTQ physical or sexual abuse subscales above a validated threshold (Walker et al., Reference Walker, Unutzer, Rutter, Gelfand, Saunders, VonKorff and Katon1999) were classified as exposed to violence. We additionally created continuous indicators of maltreatment frequency using the CTQ physical and sexual abuse subscales (i.e., how often each participant experienced abuse-related violence) and a violence severity score reflecting the number of discrete types of violence exposure each participant experienced.
Psychopathology
Internalizing and externalizing symptoms were reported by youth on the Youth Self Report of the Child Behavior Checklist (Achenbach, Reference Achenbach1991). The Child Behavior Checklist scales are among the most widely used measures of youth emotional and behavioral problems and use extensive normative data to generate age-standardized estimates of symptom severity.
WM task
Participants completed a WM task (Figure 1) using a delayed match to sample design with emotional faces. This design is similar to studies examining WM for faces in adults (LoPresti et al., Reference LoPresti, Schon, Tricarico, Swisher, Celone and Stern2008). All stimuli were faces drawn from a standardized stimulus set (Tottenham et al., Reference Tottenham, Tanaka, Leon, McCarry, Nurse, Hare and Nelson2009). Stimuli were neutral, happy, and angry faces, distributed evenly across trials and presented in a counterbalanced order across participants. Participants were instructed to encode the faces and their emotional expressions.

Figure 1. (Color online) Delayed match to sample emotional working memory task. Participants were presented with a face embedded in a realistic scene and instructed to hold the face in memory over a variable delay period. Participants were told to indicate “yes” or “no” with a button press whether the cue matched the probe on both emotional expression and identity.
The task consisted of two runs of 50 trials. Each trial involved an encoding (2000 ms), delay (1000–5000 ms), and retrieval (2000 ms) phase and an intertrial interval (ITI) of 500 ms (67% of trials) or 2000 ms (33% of trials). Each actor was presented 6–7 times for each facial expression. During encoding, facial stimuli were embedded in realistic background scenes to make encoding more similar to real-world facial encoding and to allow us to examine context encoding for a separate study that involved a memory test for implicitly encoded contextual information outside of the scanner (Lambert et al., Reference Lambert, Sheridan, Sambrook, Rosen, Askren and McLaughlin2017). During the retrieval phase, an image of a face without a background scene was presented (probe), and participants were asked to indicate whether the probe face was identical to the encoding face in terms of both identity and emotional expression. On one-third of trials, the probe face presented matched the encoding face (i.e., was the same actor showing the same emotion) and on the other two-thirds of trials, the probe did not match the encoding face in either identity (1/3) or emotion (1/3). Subjects completed two runs of the task, with the exception of one subject who completed only one run.
Image acquisition and processing
Before undergoing scanning, children 12 years and younger and any older children exhibiting anxiety about the scan were trained to minimize head movements in a mock scanner. They watched a movie with a head-mounted motion tracker that stopped playing if a movement of over 2 mm occurred. This method has been shown to significantly reduce head motion once children are in the scanner (Raschle et al., Reference Raschle, Zuk, Ortiz-Mantilla, Sliva, Franceschi, Grant and Gaab2012). In addition, in the scanner we used an inflatable head-stabilizing pillow to restrict movement.
Scanning was performed on a 3T Phillips Achieva scanner at the University of Washington Integrated Brain Imaging Center using a 32-channel head coil. T1-weighted multiecho MPRAGE volumes were acquired (repetition time = 2530 ms, echo time = 1640–7040 μs, flip angle = 7 degrees, field of view = 256 mm2, 176 slices, in-plane voxel size = 1 mm3). Blood oxygenation level dependent (BOLD) signal during functional runs was acquired using a gradient-echo T2*-weighted EPI sequence. Thirty-two 3-mm thick slices were acquired parallel to the AC-PC line (repetition time = 2000 ms, echo time = 30 ms, flip angle = 90 degrees, bandwidth = 2300, echo spacing = 0.5, field of view = 256 × 256, matrix size = 64 × 64). Prior to each scan, four images were acquired and discarded to allow longitudinal magnetization to reach equilibrium.
Functional MRI (fMRI) preprocessing
Preprocessing and statistical analysis of fMRI data was performed in a pipeline using Make, a software development tool designed for building executables from source files that can be used to create neuroimaging workflows that rely on multiple software packages (Askren et al., Reference Askren, McAllister-Day, Koh, Mestre, Dines, Korman and Madhyastha2016). Simultaneous motion and slice-time correction was performed in NiPy (Roche, Reference Roche2011). Spatial smoothing with a Gaussian kernel (6-mm full width at half-maximum) was performed in FSL (Jenkinson, Beckmann, Behrens, Woolrich, & Smith, Reference Jenkinson, Beckmann, Behrens, Woolrich and Smith2012). Data were inspected for artifacts, and volumes with motion >2 mm or >3 SD change in signal intensity were excluded from analysis using volume-specific covariates of no interest. Six rigid-body motion regressors were included in person-level models. All but two subjects (one male, 12 years and one female, 9 years) had very little motion; those with the highest motion had fewer than 10% of volumes with framewise displacement outliers across both runs, with the next highest being 3.6% of volumes. A component-based anatomical noise correction method (Behzadi, Restom, Liau, & Liu, Reference Behzadi, Restom, Liau and Liu2007) was used to reduce noise associated with physiological fluctuations. Person- and group-level models were estimated in FSL. Following estimation of person-level models, the resulting contrast images were normalized into standard space, and anatomical coregistration of the functional data with each participant's T1-weighted image was performed using surface-based registration in FreeSurfer version 5.3 (Dale, Fischl, & Sereno, Reference Dale, Fischl and Sereno1999), which provides better alignment than other methods in children (Ghosh et al., Reference Ghosh, Kakunoori, Augustinack, Nieto-Castanon, Kovelman, Gaab and Fischl2010). Normalization was implemented in Advanced Normalization Tools software, version 2.1.0 (Avants et al., Reference Avants, Tustison, Song, Cook, Klein and Gee2011).
Statistical analysis
WM performance
Behavioral performance on the emotional WM task was assessed using d′, which was calculated using the following formula:
 $$d^{\prime} = z\left( \hbox{hit rate} \right) - z\left(\hbox{false alarm rate} \right)\comma$$
where z is the standardized score as a measure of the sensitivity to detect mismatches. To examine WM performance as a function of emotion type and violence exposure, we conducted a 3 × 2 repeated measures analysis of variance (ANOVA) with emotion (angry, happy, neutral) as a within-subjects factor and group (violence exposed, control) as a between-subjects factor with d′ serving as the dependent variable.
fMRI
FMRI data processing was performed using FEAT (FMRI Expert Analysis Tool) Version 6.00, part of FSL (FMRIB's Software Library, http://www.fmrib.ox.ac.uk/fsl). Regressors were created by convolving a boxcar function of phase duration with the standard double-gamma hemodynamic response function for each phase of the task (encoding, delay, and retrieval). A general linear model was constructed for each participant. Higher level analysis was carried out using FLAME1 (FMRIB's Local Analysis of Mixed Effects; Woolrich, Reference Woolrich2008). Individual-level estimates of BOLD activity were submitted to group-level random effects models of encoding, delay, and retrieval periods, each compared to baseline (ITI). Whole-brain analyses were conducted using only correct trials. Based on recent simulation work suggesting cluster-level correction in widely used fMRI software packages leads to increased probability of false-positive results (Eklund, Nichols, & Knutsson, Reference Eklund, Nichols and Knutsson2016), we applied a conservative approach to cluster-level correction available that does not elevate risk of false positive findings in recent simulations, while also not being overly conservative and producing false negatives in event-related designs (see Eklund et al., Reference Eklund, Nichols and Knutsson2016). Specifically, we applied cluster-level correction in FSL (z > 2.3, p < .01) to our models run in FSL FLAME. We examined differences in BOLD response during contrasts of interest as a function of violence exposure in whole-brain analysis. Results were then projected onto the cortical surface for visualization purposes using Connectome Workbench (Marcus et al., Reference Marcus, Harms, Snyder, Jenkinson, Wilson and Glasser2013).
Finally, to determine whether group differences varied across the stimulus emotion type we conducted a repeated-measures ANOVA examining an Emotion (angry, happy, neutral) × Group (violence exposed, control) interaction. Because FSL does not have the functionality to perform a within-subjects ANOVA, we conducted this analysis in AFNI using the 3dLME function. Preprocessed individual-level contrasts were converted for use in AFNI, and the results from 3dLME were cluster-corrected using the 3dClustSim tool in AFNI.
Region of interest (ROI) analysis
ROI analyses examining brain–behavior associations were conducted on all trials to ensure behavioral variability. ROIs were created by masking functional activation during a contrast of interest (e.g., encoding > ITI) in the entire sample with an anatomical mask from the Harvard–Oxford cortical atlas in FSL. We created ROIs for three regions that were recruited during the task across the entire sample, including the MFG and IPS, which have been previously shown to be recruited during WM and to correlate with WM performance (Curtis & D'Esposito, Reference Curtis and D'Esposito2003; Soto, Rotshtein, & Kanai, Reference Soto, Rotshtein and Kanai2014), and STS due to associations with facial processing and social cognition (Hein & Knight, Reference Hein and Knight2008). Parameter estimates were extracted for these ROIs for each participant during the encoding, delay, and retrieval periods. We conducted linear regression to determine whether the frequency or severity of violence exposure was associated with BOLD signal in those regions; we adjusted for age as analyses with continuous measures of violence exposure were not group matched for age. In addition, we examined whether activation in these ROIs explained the association between violence exposure and d′ using standard tests of statistical mediation. We tested the significance of indirect effects using a bootstrapping approach that provides confidence intervals for the indirect effect (Hayes, Reference Hayes2013).
Sensitivity analyses
We conducted sensitivity analyses for each behavioral, whole-brain, and ROI analysis controlling for SES (highest parent educational attainment) and current internalizing and externalizing psychopathology symptoms to evaluate whether associations of violence exposure with neural recruitment and task performance were the result of confounding by SES or psychopathology.
Results
WM performance
We found main effects of both emotion, F (2, 104) = 4.83, p = .01, partial η2 = 0.08, and group, F (1, 52) = 6.37, p = .02, partial η2 = 0.12, on WM performance. Specifically, performance was lower on neutral trials than happy (p = .003) and angry (p = .02) trials, and violence-exposed participants performed worse overall compared to those without violence exposure (Table 2). However, these main effects were qualified by a significant Emotion × Group interaction, F (2, 104) = 3.46, p = .04, partial η2 = 0.06 (Figure 2), whereby violence-exposed participants performed worse than participants with no history of violence exposure on happy (p = .02, Cohen d = 0.66) and neutral (p = .003, Cohen d = 0.83) trials, but only performed marginally worse on angry trials (p = .10, Cohen d = 0.46). When comparing differences in performance across emotion trials within each group, youth with no violence exposure showed no differences in performances across emotion type (ps > .43, Cohen ds < 0.10) whereas violence-exposed youth demonstrated relatively worse performance on neutral compared to angry (p = .001, Cohen d = 0.46) and happy (p = .007, Cohen d = 0.30) trials.

Figure 2. Delayed match to sample emotional working memory task performance. There was a significant Emotion × Group interaction whereby violence exposed youth performed worse (d') on happy and neutral, but not angry, trials compared to control youth. Error bars represent standard error.
Table 2. Working memory performance overall and across emotion type in the total sample and as a function of group

Neural recruitment
Whole-brain neural recruitment in full sample
To examine task-related BOLD activation, we performed whole-brain general linear model analyses in the entire sample for the encoding, delay, and retrieval periods, each compared to ITI (see online-only supplemental Table S.1 and Figure 3).

Figure 3. (Color online) Significant clusters during the delayed match to sample emotional working memory task in the entire sample during encoding, delay, and retrieval periods. See online-only supplementary Table S.1 for details.
Encoding
The contrast of encoding > ITI showed activation in the frontoparietal cortex including the bilateral MFG/inferior frontal sulcus and IPS. This analysis also revealed bilateral activation in the dorsal anterior cingulate cortex, striate and extrastriate cortex, and inferior temporal cortex, including the fusiform and parahippocampal gyri. Finally, this contrast revealed activation bilaterally in the posterior hippocampal cortex, which is consistent with encoding of spatially complex information.
Delay
The contrast of delay > ITI demonstrated activation in the prefrontal cortex including the MFG/inferior frontal sulcus, anterior insula, frontal pole, and dorsal anterior cingulate cortex. In addition, it revealed activation within the bilateral STS and anterior IPS.
Retrieval
The contrast of probe > ITI revealed activation bilaterally in the MFG/inferior frontal sulcus, IPS, frontal pole, anterior cingulate cortex, anterior insula, posterior cingulate cortex, precuneus, striate cortex, and inferior temporal cortex, including the fusiform gyrus and STS. Subcortically, this contrast revealed significant recruitment of the thalamus, caudate, putamen, pallidum, and cerebellum.
Violence exposure and neural recruitment
The omnibus test for Emotion × Group revealed no significant clusters in whole-brain analysis. As such, all remaining analyses were conducted in FSL as previously described and examined group differences collapsed across emotion type.
During encoding, participants with no history of violence exposure had greater BOLD signal than children with violence exposure in two clusters (Table 3; Figure 4). These included the left precentral gyrus/MFG and right postcentral gyrus/IPS extending into the right precentral gyrus. BOLD activation in the left MFG was negatively associated with violence severity (β = −0.30, p = .04), but not frequency of exposure to violence (β = −0.18, p = .22). BOLD activation in the right IPS was marginally negatively associated with violence severity (β = −0.27, p = .06), but not frequency of exposure to violence (β = −0.21, p = .14). No group differences were found during the delay period.
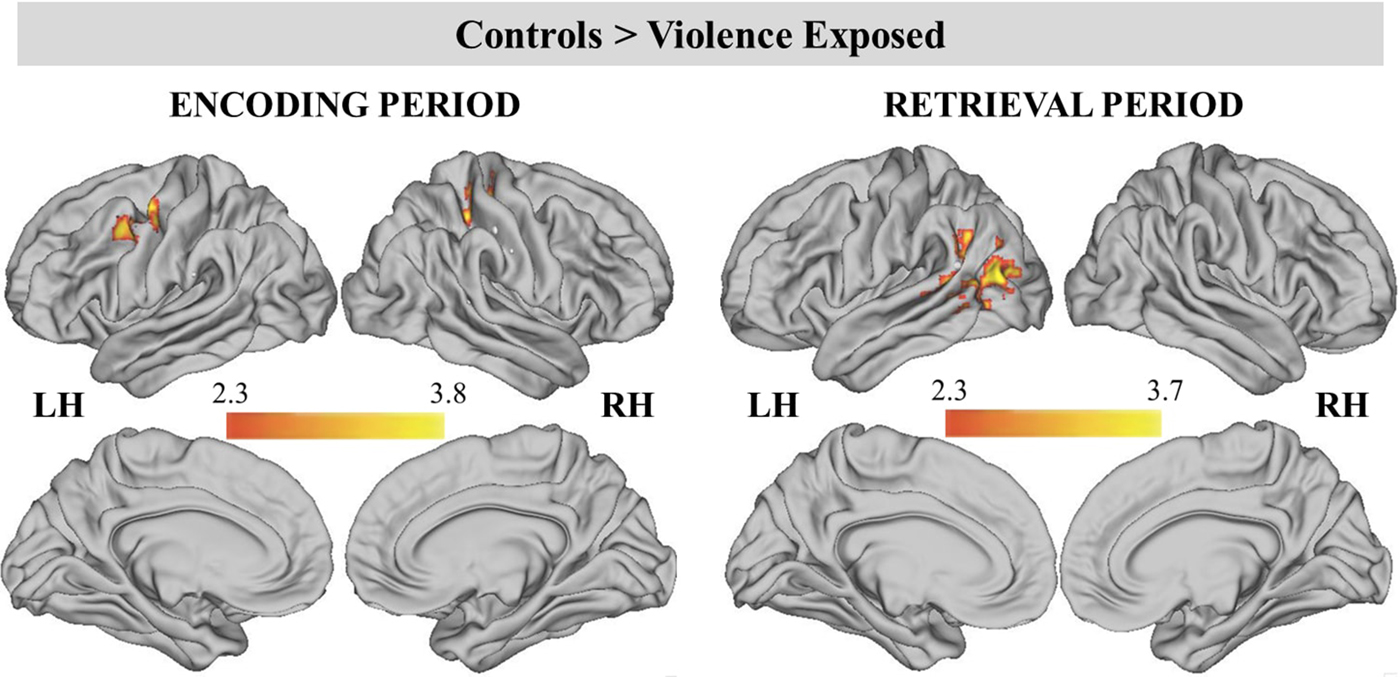
Figure 4. (Color online) Significant clusters during encoding and retrieval periods for the contrast of controls > violence exposed. Cluster-level correction applied in FSL, z > 2.3 was the primary threshold, and p < .01 was the cluster-level threshold.
Table 3. Whole-brain analysis by group (control > violence exposed)

Note: Significantly different clusters activated during encoding (any facial cue > ITI) and retrieval (any facial probe > ITI) periods for participants exposed to violence versus control participants. Cluster-level correction applied in FSL, z > 2.3 was the primary threshold, and p < .01 was the cluster-level threshold.
During the retrieval period, control participants exhibited greater BOLD signal than violence-exposed children in one large cluster that encompassed the left lateral occipital cortex/temporal parietal junction (TPJ), left STS, and left angular gyrus. Both violence frequency (β = −0.31, p = .02) and severity (β = −0.45, p = .001) were negatively associated with left STS BOLD activation.
Violence-exposed participants did not exhibit greater BOLD signal than control participants in any clusters across encoding, delay, and retrieval periods.
Brain–behavior associations
We conducted ROI analyses to investigate whether the associations between violence exposure and emotional WM performance were mediated by reduced BOLD signal in the left MFG and right IPS during encoding and left STS during the retrieval period (i.e., regions that were significantly task active in the entire sample and demonstrated group differences as a function of violence exposure in whole-brain analysis). Only regions that were task active in the entire sample were examined, as ROIs were defined by masking the contrast of interest in the full sample with a structural mask to avoid “double-dipping” by defining ROIs solely based on whole-brain group differences (Vul, Harris, Winkielman, & Pashler, Reference Vul, Harris, Winkielman and Pashler2009; see Methods section for details on ROI definition). While all three ROIs were initially examined simultaneously within the mediation model, the right IPS during encoding did not significantly mediate the association between violence exposure and WM performance and was removed from the model. In the final model, violence exposure predicted left MFG BOLD signal during encoding (b = −0.49, p = .02), which in turn predicted left STS BOLD signal during retrieval (b = 0.51, p = .002). Higher activation in both the left MFG during encoding (b = .33, p = .10) and the left STS during retrieval (b = 0.28, p = .11) were marginally associated with WM performance (overall d′), and the association between violence exposure and WM performance was reduced to nonsignificance in the final model (b = −0.34, p = .24). The indirect effect of violence exposure on WM performance through reduced BOLD signal was significant for the left MFG during encoding and the left STS during the retrieval period: indirect effect = –0.07, 95% confidence interval [–0.22, –0.008].
Sensitivity analyses
We conducted sensitivity analyses controlling for highest parental education and internalizing and externalizing symptoms across behavioral, whole-brain group comparisons, and brain–behavior analyses. The Emotion × Group interaction in predicting WM performance remained significant after adjustment for potential confounders, F (2, 90) = 3.22, p < .05.
Group differences (controls > violence-exposed) in the left MFG and right IPS during encoding were no longer significant in whole-brain analyses after controls for family SES and psychopathology were included, although a significant cluster emerged in the left IPS (see online-only supplementary Table S.2 and Figure S.1). Violence severity was no longer associated with left MFG recruitment during encoding (β = −0.13, p = .42).
The results were largely unchanged during the retrieval period, with a large cluster encompassing the TPJ and STS persisting, and additional clusters in the right MFG and right IPS emerging. The association between violence frequency and left STS recruitment during retrieval reduced to nonsignificance once controlling for confounders (β = −0.22, p = .18), while the association of violence severity with the left STS remained (β = −0.30, p = .04). Finally, the indirect effect of violence exposure on WM performance through reduced BOLD signal in the left MFG during encoding and the left STS during retrieval remained marginally significant: indirect effect = –0.05, 90% confidence interval [–0.20, –0.0004]. Together, these findings indicate that family SES and co-occurring psychopathology are not fully explaining the associations of violence exposure with WM performance or neural recruitment.
Discussion
Little research has examined how violence exposure influences neural recruitment during WM, particularly for emotional stimuli. Here, we show that children who have been exposed to violence have worse WM for happy and neutral faces than youth who have never experienced violence, but exhibit similar WM ability for angry faces. Violence exposure was associated with reduced neural recruitment in regions known to be involved in WM during encoding, including the MFG and IPS, as well as regions involved in facial processing and social cognition during retrieval, including the TPJ and STS, independent of stimulus emotion type. Reduced BOLD signal in the MFG and STS mediated the association between violence exposure and poor WM performance.
WM behavioral performance varied as a function of violence exposure and emotion type. Specifically, children who experienced violence performed worse on happy and neutral trials, but relatively better on angry trials, compared to control youth. These effects were medium to large (Cohen ds = 0.66–0.83) and robust when controlling for internalizing and externalizing psychopathology and SES, suggesting that patterns in behavioral performance were not solely due to confounders known to be associated with violence exposure and WM. In addition, we found that violence-exposed youth performed relatively worse on neutral trials compared to angry and happy trials, though these effects were small (Cohen ds = 0.30–0.46). While caution is needed when interpreting null findings, these behavioral results are consistent with extensive evidence documenting patterns of preferential information processing and heightened salience of threat cues among children who have experienced violence (see McLaughlin, Reference McLaughlin2016; McLaughlin & Lambert, Reference McLaughlin and Lambert2016, for a review). Such patterns are likely adaptive for children being raised in environments characterized by legitimate danger. Exposure to violence may increase the salience of anger and facilitate information processing for angry faces due to the relevance of anger in others as a signal of potential threat in the environment. Much of the existing work on information processing in youth exposed to violence has focused on perceptual processing of facial emotion and attention (Pollak & Tolley-Schell, Reference Pollak and Tolley-Schell2003; Shackman, Shackman, & Pollak, Reference Shackman, Shackman and Pollak2007) with little work examining WM specifically. Here we show that this attentional bias can influence other forms of information processing, including WM. This pattern is also broadly consistent with findings of poor spatial WM for happy, but not angry, faces in adult women with a history of child abuse (Cromheeke et al., Reference Cromheeke, Herpoel and Mueller2014). Of note, Cromheeke et al. contrasted responses to happy and angry faces with neutral faces (i.e., women with an abuse history performed worse on happy compared to neutral trials), whereas our findings show better WM performance for happy and angry faces when compared to neutral faces among violence-exposed youth. It is possible the discrepant findings are due to the tendency for youth to perceive neutral faces as more emotionally ambiguous than adults (Marusak, Zundel, Brown, Rabinak, & Thomason, Reference Marusak, Zundel, Brown, Rabinak and Thomason2016; Thomas et al., Reference Thomas, Drevets, Whalen, Eccard, Dahl, Ryan and Casey2001). This emotional ambiguity might have resulted in greater cognitive effort being required to determine the emotional expression on neutral faces, interfering with memory performance. Greater research is needed to explore how emotional WM varies across development following exposure to violence and other forms of adversity.
Youth with a history of violence exposure showed reduced neural activation relative to controls in regions associated with WM including the left MFG and right IPS during encoding. Furthermore, reduced activation in the left MFG during encoding mediated the association between violence exposure and poor WM performance. Group differences during encoding remained significant in the IPS even after controlling for family SES and the presence of internalizing and externalizing psychopathology. The MFG and IPS are integral to the control processes necessary for WM, such as encoding and maintaining representations of visual stimuli (Curtis & D'Esposito, Reference Curtis and D'Esposito2003), and increases in MFG and IPS activation are associated with improved WM performance across development (Geier, Garver, Terwilliger, & Luna, Reference Geier, Garver, Terwilliger and Luna2009; Scherf, Sweeney, & Luna, Reference Scherf, Sweeney and Luna2006). Conceptual models highlight the potential harmful effects of stress on PFC development and function (Lupien et al., Reference Lupien, McEwen, Gunnar and Heim2009), which has been posited to contribute to impairment in academic and cognitive functioning following violence exposure (DePrince et al., Reference DePrince, Weinzierl and Combs2009; Holt et al., Reference Holt, Finkelhor and Kantor2007). Yet, few studies have examined these assertions empirically in developmental studies of humans. The pattern of findings in the present study supports the theory that violence exposure influences neural systems underlying WM when the stimuli to be remembered are emotional in nature and that reductions in neural recruitment in frontoparietal regions account for emotional WM deficits associated with violence exposure.
Reduced neural recruitment in regions associated with facial processing and social cognition during the retrieval period, including the left STS, was observed in youth with a history of violence exposure relative to controls. These differences were unchanged when controlling for psychopathology and SES. Furthermore, reduced activation in the left STS during the retrieval period mediated the association between violence exposure and WM performance. The STS is associated with facial processing and social cognition (Deen, Koldewyn, Kanwisher, & Saxe, Reference Deen, Koldewyn, Kanwisher and Saxe2015; Hein & Knight, Reference Hein and Knight2008), and greater STS recruitment has been specifically linked to the processing of changeable facial features, such as emotional expressions (Haxby, Hoffman, & Gobbini, Reference Haxby, Hoffman and Gobbini2000). The ability to perceive and remember facial expressions is thought to facilitate social communication (Haxby, Hoffman, & Gobbini, Reference Haxby, Hoffman and Gobbini2002) and related neural systems (i.e., STS), and behavioral responses are likely impacted by interpersonal stress (Nolte et al., Reference Nolte, Bolling, Hudac, Fonagy, Mayes and Pelphrey2013). For example, Nolte et al. observed reduced activation in the left STS and subsequent disruptions in social cognitive ability (specifically identifying mental state when only observing an individual's eyes) following an interpersonal stress induction in adults. This is consistent with behavioral studies showing delayed social cognition development among maltreated children (Cicchetti, Rogosch, Maughan, Toth, & Bruce, Reference Cicchetti, Rogosch, Maughan, Toth and Bruce2003). The present study extends these findings by highlighting reduced STS recruitment as a potential mechanism linking violence exposure to poorer WM for emotional faces.
Although we found an Emotion × Group interaction predicting WM performance, we did not find a similar interaction in neural response across emotion types. Given our relatively small sample size, this may be a result of lack of power and should be interpreted with caution. Alternatively, this pattern could suggest a general reduction in neural recruitment during WM as opposed to reduced recruitment specifically in response to emotional WM. Future research examining neural responses during emotional and nonemotional WM among larger samples of children with and without violence exposure are needed before firm conclusions can be drawn about whether recruitment of neural systems underlying WM vary as a function of violence exposure differentially across various emotional stimuli.
The limitations of the current study include, first, a cross-sectional design that does not allow us to determine the temporal direction between reductions in neural recruitment and disruptions in emotional WM ability. Second, as noted above, the relatively small sample size may have impacted the ability to find group differences in neural recruitment as a function of emotion type. Given that behavioral performance varied as a function of emotion type in the violence-exposed group, it would be useful to study these processes among larger samples of children and adolescents and with nonemotional stimuli to better compare neural recruitment in emotional versus nonemotional contexts. Third, we did not adjust for intelligence (IQ) within our models. While some previous studies in the WM literature have included a measure of intelligence as a covariate, more recently it has been demonstrated that including IQ as a covariate in cognitive research is inappropriate and leads to anomalous findings due to the high degree of statistical overlap between IQ and other types of cognition (Dennis et al., Reference Dennis, Francis, Cirino, Schachar, Barnes and Fletcher2009), including WM. It is hard to imagine what the construct of WM even represents after removing variance associated with IQ (Miller & Chapman, Reference Miller and Chapman2001). Fourth, while the control and violence-exposed groups did not statistically differ on racial/ethnic makeup, the control group did not include any African American youth, which could limit generalizability of our findings. Fifth, the present study utilized a task-based measure of WM ability; it will be important to establish whether neural and behavioral measures of emotional WM impacts functional outcomes like academic performance and symptoms of psychopathology.
Violence exposure is associated with WM performance and neural function in emotionally salient contexts. Violence-exposed youths performed worse than children never exposed to violence on WM for happy and neutral, but not angry, emotional faces. In addition, violence exposure was associated with reduced neural recruitment in regions associated with WM, facial processing, and social cognition, and this reduced neural activation explained disruptions in WM for emotional faces. Overall, these findings suggest disruptions in neural and behavioral emotional WM ability may contribute to poorer academic and cognitive functioning observed among youth with a history of violence exposure.
Supplementary Material
To view the supplementary material for this article, please visit https://doi.org/10.1017/S0954579417001638.


