


Introduction
The ability of the foetus to mount an appropriate cardiovascular (CV) response to episodes of reduced nutrient supply (e.g. oxygen or substrates) is of great importance to its effective redistribution of substrates to vital organs. This may affect immediate survival and have consequences for foetal growth and development.
Foetal hypoxaemia during late gestation results in rapidReference Giussani, McGarrigle and Spencer1 and sustainedReference Richardson, Korkola and Asano2 redistribution of foetal organ blood supply, which is dependent on the carotid chemoreflex response. Earlier studies indicated that the CV response of the late gestation foetal sheep to hypoglycaemia, induced by foetal insulin infusion, is variable, possibly due to the concomitant hyperinsulinaemia.Reference Stonestreet, Boyle and Papparella3, Reference Stonestreet, Boyle and Papparella4 Recent work from our group has now shown that the late gestation foetal CV response to acute hypoglycaemia, without foetal hyperinsulinaemia, resembles in part the response to hypoxia with a decrease in blood flow to the periphery (as measured in the femoral artery and skin).Reference Burrage, Braddick and Cleal5 Although targeted towards maximizing short-term survival in poor intrauterine conditions, this response may alter organ (including vascular) growth and development with important consequences for adult CV and metabolic control. Indeed, ovine foetuses exposed to undernutrition during late gestation have raised blood pressureReference Edwards and McMillen6 and differential organ growth.Reference Burrage, Green and Moss7
A foetal CV response to hypoglycaemia during late gestation is important, since during this period of development, the foetus will be exposed to other superimposed CV challenges, such as umbilical compression leading to periods of foetal hypoxia. Intermittent cord occlusion is reported in 2%–10% of foetal heart rate (HR) recordings of near-term human foetuses.Reference Dawes, Lobb and Mandruzzato8 Most foetuses can cope with such challenges, but if this is combined with hypoglycaemia, there may be a cumulative effect on CV function, which could be detrimental to the foetus. Indeed, there is evidence to suggest that prevailing hypoglycaemia of undefined aetiology can alter the CV and endocrine responses to intermittent umbilical cord occlusion (UCO).Reference Gardner, Fletcher and Bloomfield9
The aim of this study was to characterise further the effect of acute foetal hypoglycaemia (induced by maternal insulin infusion) on late gestation foetal CV function and to establish the effects of foetal hypoglycaemia on the CV and endocrine response to a superimposed UCO.
Methods
All procedures were carried out in accordance with the regulations of the UK Home Office Animals (Scientific Procedures) Act, 1986.
Animals
Welsh Mountain ewes (n = 7) of uniform body condition score and age were group housed on wheat straw, with free access to water, and fed a complete pelleted diet (89.2% dry matter as fed, 10.7 MJ/kg dry matter (metabolizable energy) and 14.8% protein: adjusted to gestational age (dGA)10 from −16 dGA. The oestrous cycle of groups of 3–4 ewes was synchronized by withdrawing vaginal medroxyprogesterone acetate impregnated sponges (Veramix, Upjohn Ltd, Crawley, UK) 12 days after insertion. A Welsh Mountain ram was introduced for 3 days, and 0 dGA was taken as the first day on which an obvious raddle mark was observed.
Surgical preparation
At 119 dGA, general anaesthesia was induced by thiopentone sodium (10 mg/kg, i.v.; Link Pharmaceuticals, UK) and maintained by 2% halothane (Concord Pharmaceuticals Laboratory Ltd, UK) in O2 (1 l/min). A midline incision was made in the lower abdominal wall, and the foetal head, chest and proximal portion of the umbilical cord were exteriorized through an incision in the uterine wall. Polyvinyl catheters (1.0 mm ID, 2.0 mm OD, Portex Ltd, Hythe, UK) filled with heparinized saline (50 U/ml. Heparin sodium: Leo Pharmaceuticals, UK; Saline 0.9%: 3S-Healthcare, UK) were placed in the left jugular vein, right carotid artery, amniotic cavity and bladder (non-heparinized). Three stainless-steel electrodes were sutured to the foetal chest for electrocardiogram (ECG) recording, and an inflatable occluder cuff (OCHD16; In Vivo Metric, USA) was positioned around the proximal portion of the umbilical cord and secured to the abdominal skin. The volume required for complete occluder cuff inflation was determined at surgery. The uterine and abdominal incisions were closed, and the catheters were exteriorized through the maternal flank and secured to the ewe’s back in a plastic pouch. A catheter filled with heparinized saline was placed in a maternal jugular vein for administration of drugs and blood sampling.
At surgery, antibiotics were administered to the: (1) ewe (oxytetracycline hydrochloride (Terramycin) topically to incision sites, Pfizer, Eastleigh, Northants, the United Kingdom; Betamox i.m., (150 mg/kg amoxicillin; Norbrook Laboratories Ltd, UK); Crystapen i.v., (600 mg) Britannia Pharmaceuticals Ltd, Redhill, Surrey, UK; Gentamicin i.v. (40 mg) Mayne Pharmaceuticals Plc, Royal Leamington Spa, Warickshire, UK); (2) foetus (Crystapen i.v. (300 mg)); and (3) amniotic cavity (Crystapen (300 mg) and Gentamicin (40 mg)). Gentamicin doses were repeated on post-operative days 1 and 2, and half doses of crystapen were administered daily for 4–5 post-operative days. Vascular and amniotic catheters were flushed daily with heparinized saline, and vascular catheters were kept patent with a continuous infusion of heparinized saline (foetal: 0.01 ml/h; ewe: 1 ml/h).
Foetal monitoring
Foetal carotid artery and amniotic pressures (Capto AS, N-3193, Horten, Norway/NL 108, Digitimer Ltd, Welwyn Garden City, Herts, UK) and ECG (NL 100/104/125) data were captured (sampling rate 1000 samples per second, Maclab/8, ADInstruments Pty Ltd, Castle Hill, Australia) and recorded (Chart, ADInstruments, Chalgrove, Oxon, UK). Amniotic pressure was subtracted from blood pressure to correct for heart height.
Experimental Protocol
An i.v. saline infusion was given to each ewe on day 125 of gestation, and then on day 126 of gestation, the same ewe received an i.v. insulin infusion (porcine, Novo Nordisk, UK; 5 IU/ml in maternal heparinized saline; 30 s at 0.5 IU/kg/min and 0.01 IU/kg/min thereafter). Foetal mean arterial pressure (MAP) and HR were monitored continuously before (from −60 min) and after (until 215 min) the onset of each infusion to the ewe (Fig. 1). From 75 min of infusion, angiotensin II (Ang II, Sigma-Aldrich Co, UK) i.v. boluses (1, 2.5, 5 and 10 μg) were administered at 15 min intervals (following return of blood pressure to baseline) to generate a dose–response curve. At 145 min, a 90-s UCO was carried out by complete inflation of the occluder cuff (∼4 ml saline) and followed by a 30-min recovery period. At 185 min, an i.v. bolus of phenylephrine (PE; 75 μg) was administered to the foetus to alter HR and assess baroreflex function.

Fig. 1 Experimental protocol. The experiment involved continuous foetal cardiovascular monitoring, maternal and foetal blood sampling for blood gas analysis (↑) and urine sampling (diagonal striped boxes) during baseline (white boxes) and maternal insulin or saline infusion (grey shading). Angiotensin II boluses (1, 2.5, 5 and 10 μg) were given from 75 min, a 90-s umbilical cord occlusion (UCO) was given at 145 min and a phenylephrine (PE) bolus (75 μg) was given at 185 min.
Maternal (0.5 ml) and foetal femoral arterial (0.25 ml) blood was collected at predetermined intervals (Fig. 1) into heparinized syringes for glucose and blood gas measurement. At 0, 60 and 150 min, maternal and foetal blood was collected for measurement of insulin (0.5 ml in lithium heparin), creatinine (0.5 ml in lithium heparin), adrenaline and noradrenaline (0.5 ml in EDTA) and cortisol and adrenocorticotropic hormone (ACTH) (0.5 ml in EDTA). A foetal arterial blood sample (1.5 ml in EDTA) was taken at 60 min for measurement of plasma Ang II concentration.
The bladder catheter was opened and allowed to drain under gravity into a sterile container from time point −60 to −30 min to minimize variability in the bladder volume at the onset of the protocol. Urine was then collected over the set-time intervals (Fig. 1), and the volume was recorded. A unit of 2 ml of urine was retained from each period, for creatinine assay, and the remainder was returned to the amniotic cavity after sterilization through a syringe-end filter (0.2 m pore size, Sartorius Ministart, Fisher Scientific, UK).
Biochemical analysis
Substrates and metabolites
Plasma glucose and oxygen partial pressure (pO2), carbon dioxide partial pressure (pCO2) pH and lactate in arterial blood were measured using a blood gas analyser (ABL700, Radiometer, Copenhagen, Denmark) and were corrected for temperature (39°C).
Hormones
Insulin was measured in single 25 μl plasma samples by a commercially available ELISA (DRG Sheep Insulin; ImmunoDiagnostic Systems Ltd, Tyne and Wear, UK).Reference Burrage, Green and Moss7 The range of the assay was 0.1–2.5 μg/l, and the inter- and intra-assay coefficients of variation for the insulin assay were 8% and 5%, respectively.
Cortisol (μg/dl) was measured in single 10 μl plasma samples by a solid-phase, competitive chemiluminescent enzyme immunoassay (DPC Immulite analyser (LKC05) DPC Ltd, Gwynedd, UK), with an incubation cycle of 30 min.Reference Burrage, Green and Moss7 The sensitivity of the assay was 0.2 μg/dl and the intra- and inter-assay coefficients of variation were 4.64% for the value 12.83 μg/dl and 7.93% for the value 2.94 μg/dl. ACTH (pg/ml) was measured in a single 75-μl plasma samples by a sequential immunometric assay (DPC Immulite system (LKAC5) DPC Ltd, Gwynedd, UK) with two incubation cycles of 30 min.Reference Burrage, Green and Moss7 The sensitivity of this assay was 9 pg/ml, and the intra- and inter-assay coefficients of variation were 1.05% for the value 47.83 pg/ml and 4.56% for the value 32.65 pg/ml.
Adrenaline and noradrenaline were measured in a single 300-μl plasma samples (Endocrine Unit, Southampton General Hospital) using a commercially available combined 125I RIA kit (2 Cat RIA, LDN, Germany).Reference Burrage, Green and Moss7 For adrenaline, the sensitivity of the assay was 2.5 pg/ml, and the inter-assay coefficient of variation was 15.5% at 225 pg/ml and 15.3% at 1125 pg/ml. For noradrenaline, the sensitivity of the assay was 12.5 pg/ml and the inter-assay coefficient of variation was 23.6% at 1125 pg/ml and 14.9% at 5625 pg/ml.
Creatinine was measured in a single plasma and urine 500 μl samples (Dr J. Jackson, The University of Southampton) using a reaction-rate method based on the Jaffe reaction. The assay used the Konelab creatinine reagent kit on a Kone 20 auto-analyser (Labmedics, Salford, UK) according to the manufacturer’s instructions.
Plasma Ang II was measured in duplicate (by S. B.) using a radioimmunoassay (RIA).Reference McPherson, Luo and Brown11 Briefly, plasma in EDTA was transferred to 8 m urea (1 ml plasma: 1.5 ml urea) to block enzymatic activity for both generation and degradation of Ang II, then snap frozen until extraction. For extraction of Ang II, 80% methanol was added to the urea/plasma solution to precipitate protein, the supernatant was quantitatively dried in a Speed-Vac, and the recovered material resuspended in saline and passed through an activated Sep-Pak C-18 column. Angiotensin peptides (Ang II, III and IV) were eluted with 80% methanol, dried overnight, reconstituted in RIA buffer and measured (pg/ml) using a commercial RIA kit (Phoenix Pharmaceuticals Inc., CA). The intra- and inter-assay coefficients of variation were 6.5 ± 2.6 and 9.6 ± 5.6%.
Data analysis
A summary measures approach to data analysis was used, whereby serial measurements are reduced to a certain feature of physiological relevance before statistical analysis. (1) Urine volume was averaged (ml/min) over each collection interval (see Fig. 1); and glomerular filtration rate (GFR) was calculated (urine creatinine (g/l)/Plasma creatinine (g/l) × URINE volume (ml/min)); (2) the blood pressure trace was divided into 1 min (or 10 s for the Ang II and UCO challenges) windows, and the average MAP and HR for each window was calculated using Chart software. Resting MAP and HR were calculated for baseline (−60 to 0 min), following infusion (60–75 min) and following the Ang II challenge (135–145 min); (3) the change in MAP between baseline (5-min period pre-bolus) and maximum MAP following each Ang II bolus was plotted against Ang II dose creating a dose–response curve. These data were summarized as area under the curve (AUC) calculated using the trapezium rule; (4) the change in MAP and HR between baseline (135–145 min) and 50 s into the UCO was summarized as AUC; (5) during baseline (2-min period pre-PE) and after the PE injection (until the maximum arterial pressure had been reached) the R–R interval of the ECG waveform following each systolic blood pressure (SBP) peak was measured. R–R interval was plotted against SBP, and the baroreflex sensitivity was derived from the slope of the steepest portion of each curve. R–R interval data were corrected to 0% and 100% (average of three lowest and highest R–R intervals, respectively) and plotted against SBP. The baroreflex operating point was determined as the SBP that produced 50% of the response.
Statistics
Data are expressed as mean ± s.e.m. All animals were used for all parameters measured. All statistical analyses were performed using SPSS (SPSS, Chicago, USA), and statistical significance was accepted when P < 0.05. Renal data, plasma hormones and metabolites, and resting MAP and HR were analysed for each experiment (saline and insulin) separately using one-way anova with bonferroni correction or Kruskall–Wallis with Dunn’s multiple comparison test, if the groups had unequal variance. Ang II, UCO and baroreflex response differences between saline and insulin experiments were analysed using a paired student’s t-test.
Results
Insulin infusion
MINS increased maternal (Fig. 2a) and reduced foetal (Fig. 2c) plasma insulin at 60 min. Maternal (Fig. 2b) and foetal (Fig. 2d) plasma glucose was significantly below the baseline at 60 min following MINS. Maternal and foetal plasma ACTH, cortisol, adrenaline and noradrenaline levels did not change during MINS (Table 1). Foetal arterial pO2, pH, pCO2 and lactate did not change during MINS (Fig. 3). MINS had no effect on foetal urine flow rate and GFR (Table 1C). Foetal HR decreased from baseline (−60 to 0 min) following MINS (60–75 min; Fig. 4b).
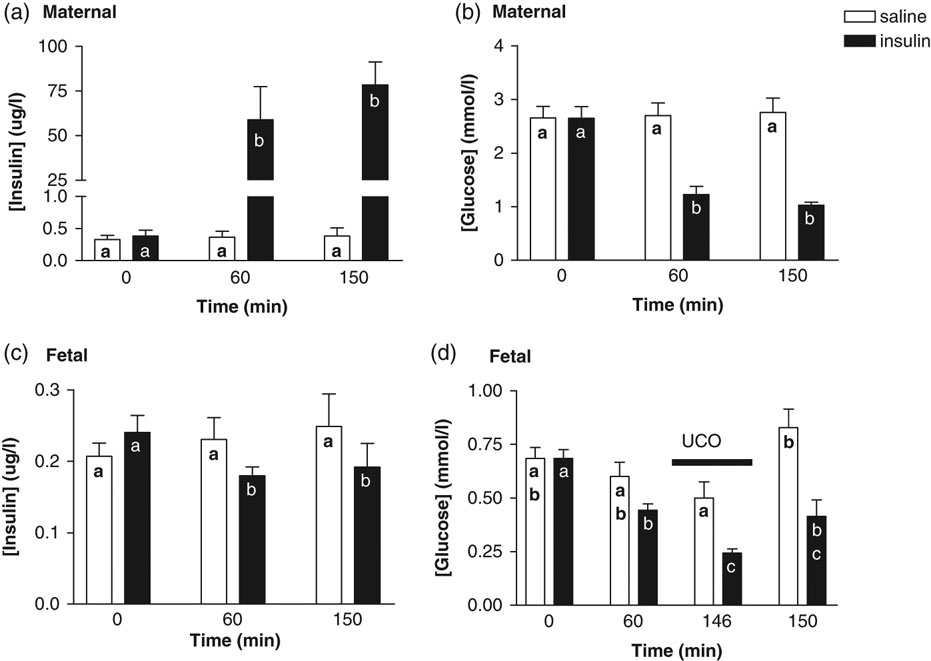
Fig. 2 Insulin and glucose response to insulin infusion and cord occlusion. Maternal (a) and foetal (c) plasma insulin concentrations, and maternal (b) and foetal (d) plasma glucose concentrations at baseline (0 min), during a saline or insulin infusion (60 min), 1 min into (time 146 min) and 5 min after (time 150 min) the start of a 90-s umbilical cord occlusion. Values mean ± s.e.m. Values containing the same letter are not significantly different from one another; P < 0.05, one-way ANOVA with bonferoni correction.
Table 1 Maternal and foetal plasma hormone and foetal renal response to hypoglycaemia and cord occlusion

Values mean ± s.e.m.P < 0.05, value significantly increased compared to time point 0 min (*) and both 0 min and 60 min (**), Kruskal–Wallis with Dunn’s multiple comparison test.

Fig. 3 Foetal Oxygen, carbon dioxide, pH and lactate response to hypoglycaemia and cord occlusion. Foetal arterial blood pO2 (a), pH (b), pCO2 (c) and lactate (d) levels at baseline (0 min), during a saline or insulin infusion (60 min), 1 min into (146 min) and 5 min after the start of (150 min) a 90-s umbilical cord occlusion. Values mean ± s.e.m. Values containing the same letter are not significantly different from one another; P < 0.05, one-way ANOVA with bonferoni correction.

Fig. 4 Foetal mean arterial blood pressure and heart rate. Mean arterial pressure (a) and heart rate (b) during baseline (−10 to 0 min), following a saline or insulin infusion (60–75 min) and following the Ang II challenge period (135–145 min). Values mean ± s.e.m. Values containing the same letter are not significantly different from one another; P < 0.05, one-way ANOVA with bonferoni correction.
Cord occlusion
During MINS, a 90-s UCO led to a further decrease in foetal glucose (Fig. 2d) 1 min into the occlusion. Maternal cortisol and adrenaline increased 5 min after the start of the UCO during MINS only (Table 1A). Foetal plasma ACTH, adrenaline and noradrenaline (Table 1B) increased 5 min after the start of the UCO to a similar extent in the MSAL and MINS experiment, whereas foetal plasma cortisol increased during MINS only (Table 1B). A 90-s cord occlusion led to a decrease in pO2 and pH 1 min into the occlusion, an increase in lactate 5 min after the occlusion to a similar extent in both the MSAL and MINS experiments (Fig. 3). A 90-s cord occlusion had no effect on foetal urine flow rate and GFR in both the MSAL and MINS experiments (Table 1C). The increase in foetal MAP (AUC) during the first 50 s of a 90-s cord occlusion was significantly greater during MINS compared with MSAL (Fig. 5). There was a tendency for the decrease in HR (AUC) during a 90-s cord occlusion to be greater during MINS compared with MSAL (P = 0.06, Fig. 5).

Fig. 5 Cardiovascular response to umbilical cord occlusion. Mean arterial pressure (a) and heart rate (b) response during the first 50 s of a 90-s umbilical cord occlusion (AUC) following saline or insulin infusion. Values mean ± s.e.m. *P < 0.05 (∼P = 0.06), AUC different; paired t-test.
Angiotensin II and CV responses
There was no difference in plasma Ang II at 60 min between MSAL (27.4 ± 2.31 pg/ml) and MINS (26.6 ± 2.20 pg/ml) experiments. Increasing doses of Ang II caused a progressive increase in MAP response. The area under the dose–response curve was not different between MSAL (205.5 ± 18.8 μg·mmHg) and MINS (219.9 ± 22.9 μg·mmHg) experiments. Foetal HR was increased in the post-Ang II period (135–145 min) compared with the pre-Ang II base line (60–75 min) in both MINS and MSAL experiments (Fig. 4b).
Baroreflex function
Foetal baroreflex sensitivity was reduced, but operating point was unaltered, during MINS infusion compared with MSAL (Fig. 6).

Fig. 6 The effect of hypoglycaemia on foetal baroreflex function. Sensitivity (a) and operating point (b) of the foetal baroreflex response to a bolus of phenylephrine during maternal saline or insulin infusion. Values mean ± s.e.m. A significant difference indicated by different letters, P < 0.05, paired t-test.
Discussion
In addition to our earlier observations of increased foetal peripheral vascular resistance and decreased HR, we have now shown a decrease in baroreflex sensitivity during foetal hypoglycaemia. Foetal hypoglycaemia also resulted in increased CV responsiveness to UCO.
Maternal insulin infusion resulted in a decrease in maternal (54%) and foetal (37%) plasma glucose concentration, which was comparable to that achieved in a study investigating hypoglycaemia in ewes and foetuses following late gestation underfeeding; 45% and 58%, respectively.Reference Leury, Chandler and Bird12 This decrease is greater than the 25% decrease in glucose that initiates the counter regulatory hormone response to hypoglycaemia in humans. Decreased foetal insulin levels, as well as a small, but significant, reduction in foetal HR occurred within 60 min of insulin infusion. The foetal redistribution of blood flow recorded in an earlier study using the same challengeReference Burrage, Braddick and Cleal5 and the decrease in HR observed during hypoglycaemia in this study are consistent with a redistribution of nutrient resources away from the periphery, and are reminiscent of some features of the foetal CV response to hypoxaemia.Reference Giussani, Spencer and Moore13, Reference Peeters, Sheldon and Jones14 The role of the carotid body is well established in the rapid CV response to hypoxaemia during foetal life,Reference Giussani, Riquelme and Moraga15, Reference Giussani, Spencer and Moore16 and has also been shown to respond to variations in glucose levels,Reference Pardal and Lopez-Barneo17–Reference Alvarez-Buylla and Alvarez-Buylla19 and to participate in glucoregulationReference Alvarez-Buylla and de Alvarez-Buylla20, Reference Koyama, Coker and Stone21 in adult animals. Thus, while the mechanism underlying the decreased HR response to hypoglycaemia is uncertain, it may involve increased vagal activity to the heart through a carotid chemoreflex mechanism.
Maternal insulin infusion induced foetal hypoglycaemia and reduced foetal baroreflex sensitivity, but not its operating point, whereby for a given increase in blood pressure (following PE administration), the baroreflex-mediated decrease in HR was smaller. Although not investigated in this study, hypoglycaemia may be one mechanism that mediates a resetting of the baroreflex. This idea is consistent with studies in which altered baroreflex function was associated with a previous period of undernutrition in the first half of gestation.Reference Hawkins, Steyn and Ozaki22 The mechanism by which this occurs is uncertain, but there was no evidence of changes to the RAS or renal function, other factors implicated in baroreflex functionReference Polson, Dampney and Boscan23 during hypoglycaemia.
In this study, a single superimposed brief UCO challenge was imposed. The aim being to establish how the prevailing nutritional environment effects the foetal response to an UCO.
UCO resulted in a rapid increase in MAP and decrease in HR as reported previously,Reference Green, Kawagoe and Homan24 and these responses were augmented by maternal insulin infusion. This suggests that the usually harmless late-gestation UCO may become detrimental to current or long-term CV function, if in combination with a prior undernutrition induced CV adaptation. Carotid chemoreceptors are implicated in the rapid fall in foetal HR and increased peripheral vascular resistance during hypoxia.Reference Giussani, Spencer and Moore25 Thus, during hypoglycaemia, the increased MAP response to UCO could be due to increased chemoreceptor activity. If this were the case, it could lead to long-term CV alterations. Indeed, an enhanced chemoreflexReference Somers, Mark and Abboud26 is seen in adults with hypertension (although it cannot be determined whether this is a cause or consequence of the hypertension).
Earlier work in foetal sheep suggested that UCO can impact upon foetal HPA function.Reference Green, Kawagoe and Fraser27 In this study, increased foetal plasma cortisol levels occurred following the UCO, but only during maternal insulin infusion induced foetal hypoglycaemia. This may contribute to the increased MAP response to UCO during maternal insulin infusion. A period of elevated foetal cortisol may also have long-term effects on the foetus, as cortisol has potent actions on cellular differentiation and development and alters the trajectory of organ maturation.Reference Liggins28 Prenatal glucocorticoid exposure has also been shown to affect glucose–insulin homoestasis in the adult.Reference Nyirenda, Lindsay and Kenyon29
Conclusion
In conclusion, this study suggests that maternal insulin infusion and the associated maternal and foetal hypoglycaemia alters foetal chemoreflex, baroreflex and HPA-axis activity. These alterations in CV function during periods of low glucose, although small, may become more biologically significant when the foetus has to face a challenge to the CV system. Indeed, this study showed an increased CV responsiveness to compression of the umbilical cord; a likely occurrence during late gestation in human pregnancy.Reference Dawes, Lobb and Mandruzzato8 Our findings are important in understanding how the foetus responds to undernutrition in utero and may help studies aimed at identifying those at risk from CV disease in later life.
Acknowledgements
This study was supported by The Echo UK Charity and BBSRC, and M. A. H. is supported by the BHF. We are grateful to the biological research facilities at the University of Southampton and the Royal Veterinary College for their expert animal care.
Statement of Interest
None.


