INTRODUCTION
The oldest-old (individuals aged 90 or older) are the fastest growing segment of the population. In the United States, the population of 90+ individuals is expected to triple by 2050, reaching 8.1 million people (United Nations Department of Economic and Social Affairs Population Division, 2017). Oldest-old individuals are at high risk of developing dementia (Corrada, Brookmeyer, Paganini-Hill, Berlau, & Kawas, Reference Corrada, Brookmeyer, Paganini-Hill, Berlau and Kawas2010) and the ability to identify cognitive changes in this high-risk group is essential. However, distinguishing individuals with normal cognition from those with impaired cognition remains challenging because of the scarcity of appropriate test norms for this age group. Moreover, available test norms for cognitively normal oldest-old are limited by small sample sizes, small numbers of tests, or tests that are infrequently used by psychologists (Legdeur et al., Reference Legdeur, Binnekade, Otten, Badissi, Scheltens, Visser and Maier2017).
The present work addresses this gap by providing neuropsychological test norms that will help distinguish cognitively normal oldest-old from those with cognitive impairment [cognitive impairment with no dementia (CIND) and dementia]. Our earlier publication (Whittle et al., Reference Whittle, Corrada, Dick, Ziegler, Kahle-Wrobleski, Paganini-Hill and Kawas2007) provided test norms to differentiate oldest-old without dementia (normal and CIND) from those with dementia. Inclusion of CIND participants in our previous normative publication resulted in lower means and larger variances of the normative values compared with norms derived from cognitively normal participants alone, and limited the ability to differentiate cognitively normal from mildly impaired individuals.
Here, we report test norms derived from one of the largest well-characterized cohorts of the oldest-old, The 90+ Study. Importantly, these new norms span a comprehensive battery of widely used cognitive tests (Rabin, Paolillo, & Barr, Reference Rabin, Paolillo and Barr2016). We developed norms by using a cross-sectional approach to determining cognitive status of the normative group, including individuals with normal cognition at baseline, although they may have later developed cognitive impairment (Sliwinski, Lipton, Buschke, & Stewart, Reference Sliwinski, Lipton, Buschke and Stewart1996). Using clinical diagnostic criteria we excluded individuals with CIND (Graham et al., Reference Graham, Rockwood, Beattie, Eastwood, Gauthier, Tuokko and McDowell1997) and dementia (DSM-IV) (American Psychiatric Association, 1994) from the normative group.
METHODS
Study Procedures
We report results from a subset of participants of The 90+ Study, an ongoing longitudinal study of aging and dementia in people aged 90 or older. Participants of The 90+ Study were recruited from two groups: (1) survivors of the Leisure World Cohort Study (LWCS) (Paganini-Hill, Ross, & Henderson, Reference Paganini-Hill, Ross and Henderson1986), a health survey study in the 1980s of the residents of Leisure World, a retirement community in Orange County, California, who were aged 90 or older on or after January 1, 2003, when enrollment into The 90+ Study commenced, and (2) 90+ residents of Orange County, California, who lived within a 2-hr drive of the study location, and joined the study through open recruitment (Melikyan et al., Reference Melikyan, Greenia, Corrada, Hester, Kawas and Grill2018).
Eligible individuals could participate in The 90+ Study at any of four levels: (1) in-person, (2) over the telephone, (3) through an informant, (4) LWCS participants who died before they themselves could participate in The 90+ Study were included if an informant provided information on medical, family history, and daily functioning. In-person participants undergo comprehensive semi-annual evaluations that include medical and family history, daily functioning, neurological examination, and neuropsychological testing. Based on participant’s choice, visits are done at the study office or at home. We travel across the United States to test participants who have moved after enrollment.
The study was approved by the University of California Irvine’s Institutional Review Board and all participants provided signed informed consent. Research was completed in accordance with the Helsinki Declaration.
Participants
Inclusion and exclusion criteria
This study reports on a subset of The 90+ Study participants who had at least one in-person evaluation and were determined by neurological examiners to have normal cognition at the first in-person evaluation. There were no other inclusion/exclusion criteria.
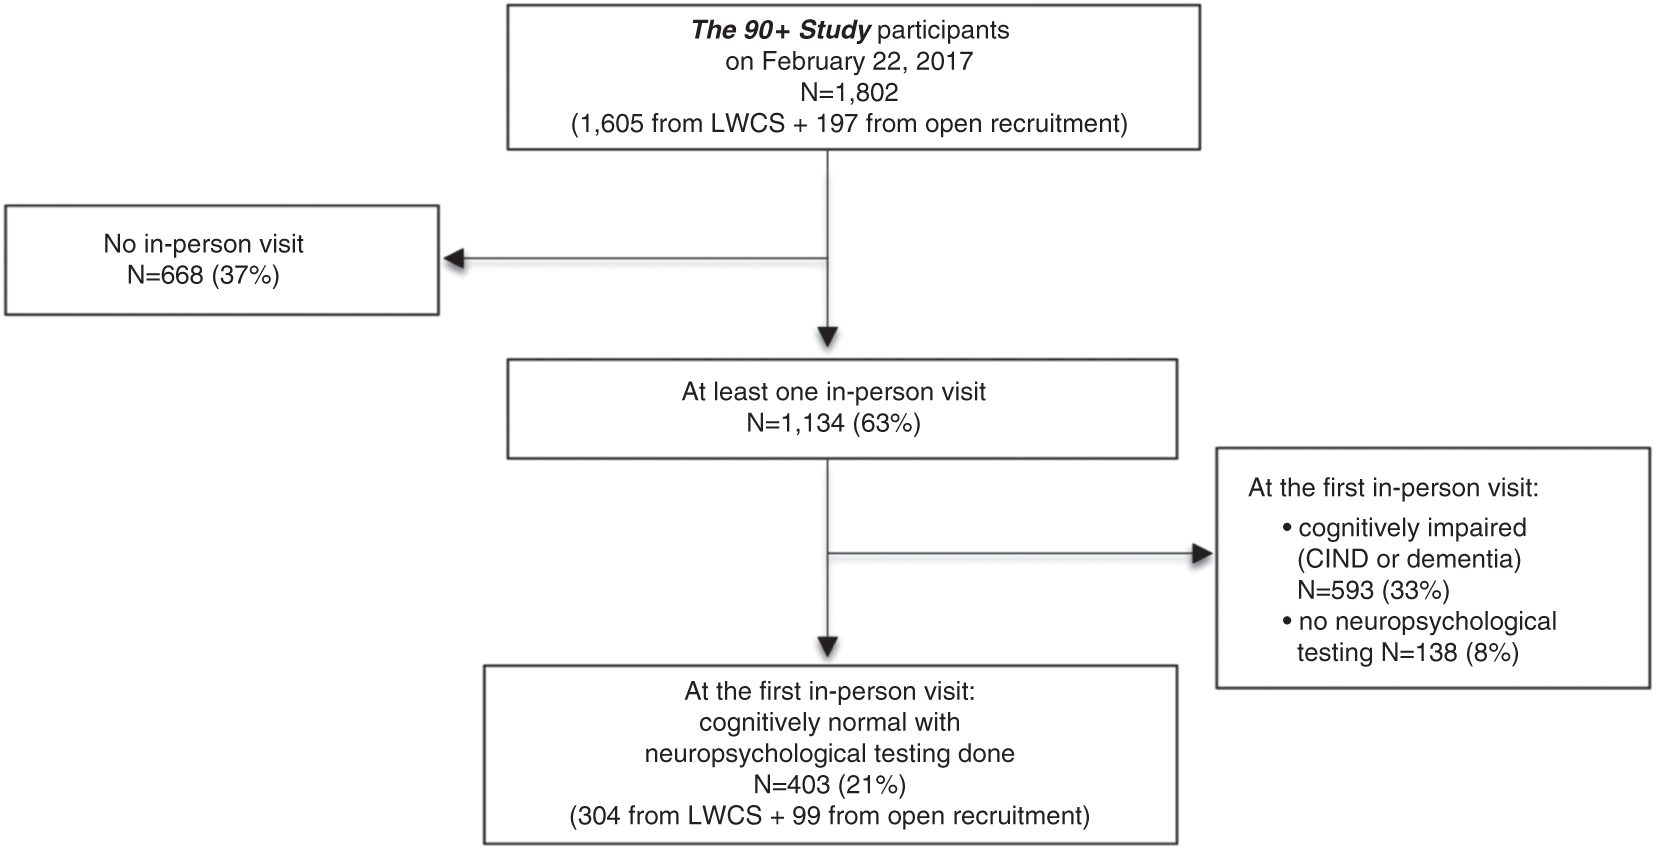
Of the 1,802 participants of The 90+ Study as of February 22, 2017 (Figure 1), 1134 (63%) had an in-person visit. Of these, 593 were classified as having CIND/dementia at the first in-person evaluation and an additional 138 had no neuropsychological testing done leaving 403 for analysis. These 403 individuals include 159 cognitively normal participants included in our previous publication (Whittle et al., Reference Whittle, Corrada, Dick, Ziegler, Kahle-Wrobleski, Paganini-Hill and Kawas2007).
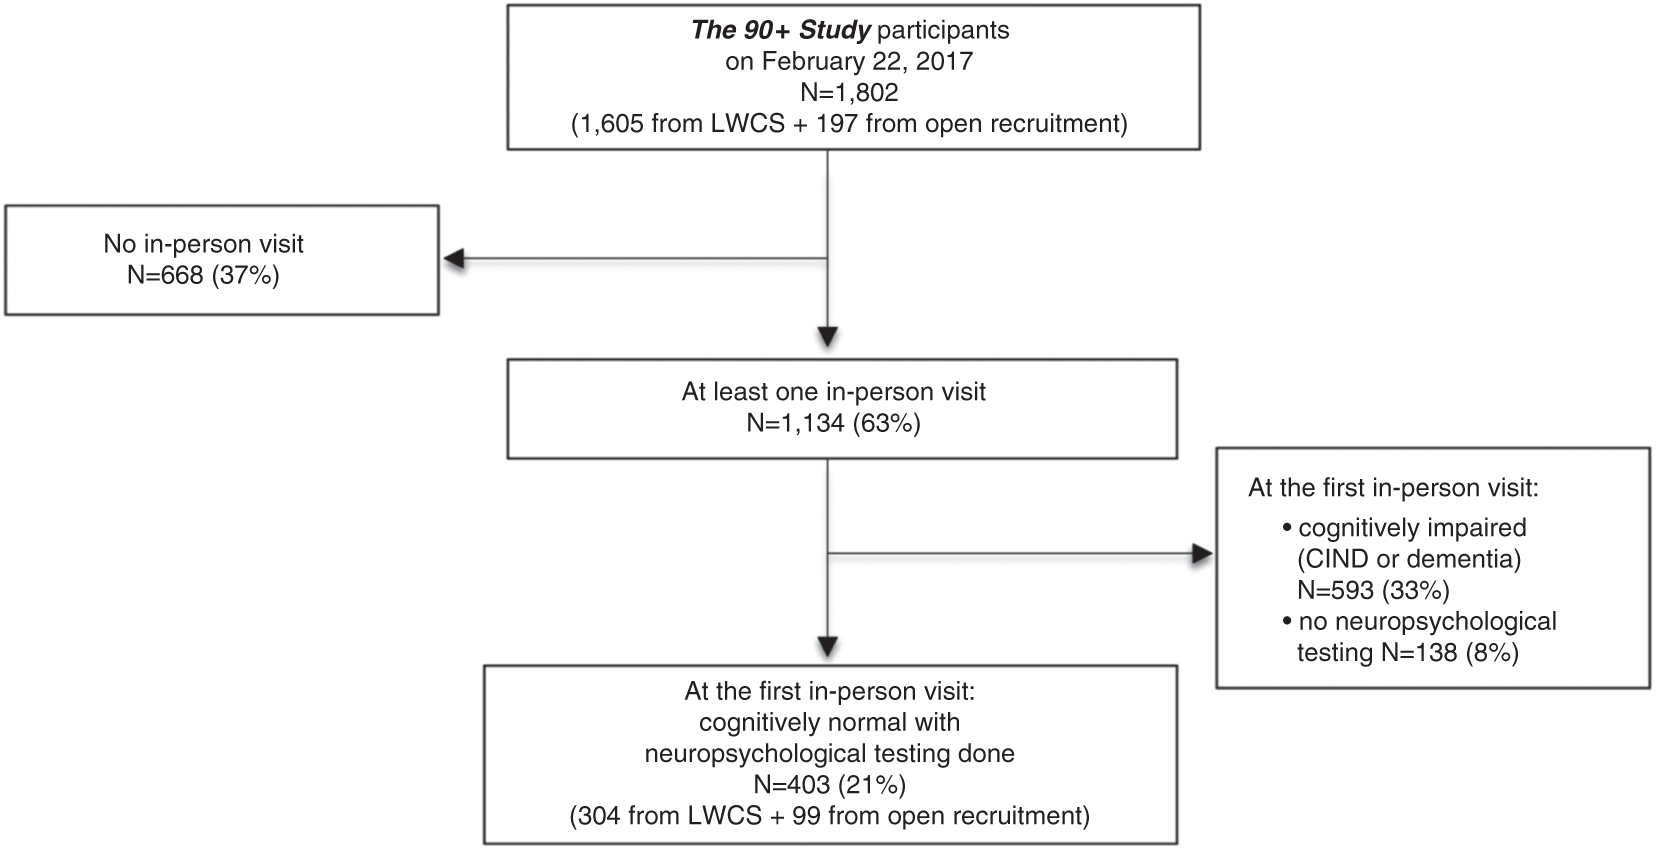
Fig. 1 Flowchart of participant inclusion. LWCS=Leisure World Cohort Study. All percentages are calculated from the total 90+ Study cohort (N=1802).
Data Collection Instruments
Background information and history
We collected information on demographics, medical history (participants were asked: “Have you ever been diagnosed with cardiovascular, cancer, psychiatric, neurological, or metabolic disorders?”), current mediations, living situation, and instrumental activities of daily living (IADL). Information on subjective cognitive decline was not collected.
Neuropsychological test battery
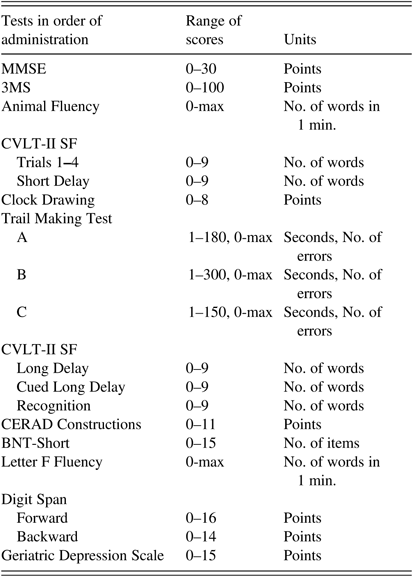
A neuropsychological test battery of 11 tests indexed language, word list memory, executive function, attention and working memory, psychomotor speed, visual-spatial functions, construction; a questionnaire indexed symptoms of depression. The tests indexed different levels of cognitive ability while minimizing excessive floor and ceiling effects. Tests were administered in the order shown in Table 1 to maximize completion rates of the same tests in oldest-old participants who have high rates of incomplete testing due to fatigue. The average time to complete the entire battery was approximately 1 hour. Psychometrists, individuals with at least Bachelor’s degree in psychology or related field and trained by a licensed neuropsychologist (M.B.D.), administered the tests in a standardized way.
Table 1 Neuropsychological test battery in the order of administration
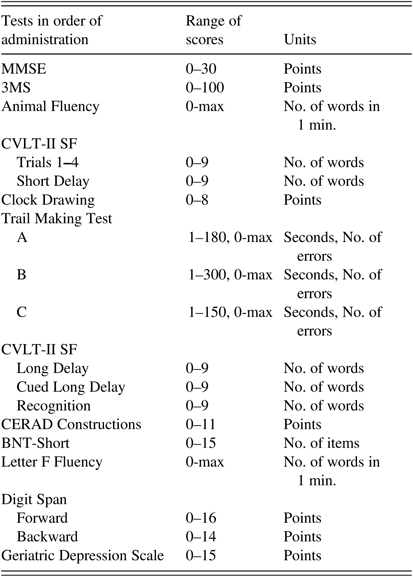
Note. MMSE=Mini-Mental State Examination; 3MS=Modified Mini-Mental State Examination; CVLT-II SF=California Verbal Learning Test-II, Short Form; CERAD=The Consortium to Establish a Registry for Alzheimer’s Disease; BNT-Short=Boston Naming Test, Short Form (15 items).
Participants were asked to wear their eyeglasses and hearing aids during testing. In case of inability to complete a test due to sensory or motor impairment, a missing code indicated the reason for non-completion. Modifications, such as pairing printed and auditory stimuli and using enlarged boldface font for written information, were made to help compensate for sensory impairments. All test results, whether or not the whole battery was completed, were analyzed. Participants who did not complete the entire test battery were not excluded from analyses.
Cognitive screening tests included Modified Mini-Mental State Examination (3MS) (Teng & Chui, Reference Teng and Chui1987) and Mini-Mental Status Examination (MMSE) (Folstein, Folstein, & McHugh, Reference Folstein, Folstein and McHugh1975). Most MMSE items are incorporated in the 3MS, and the addition of two items (which floor the participant is on and writing a sentence) to the 3MS made it possible to derive a total score for both tests. Two minor changes were made to the standard administration procedures: (1) the three to-be-remembered words were printed on three separate cards in 90-size font and shown one at a time while the examiner simultaneously repeated the words aloud, (2) the 60-s Animal Fluency test (Morris et al., Reference Morris, Heyman, Mohs, Hughes, van Belle, Fillenbaum and Clark1989) was substituted for the 3MS 30-s task of naming four-legged animals.
Language was indexed using confrontational object naming, category (animals), and letter (F) (Gladsjo, Schuman, Miller, & Heaton, Reference Gladsjo, Schuman, Miller and Heaton1999; Heaton, Miller, Taylor, & Grant, Reference Heaton, Miller, Taylor and Grant2004) fluencies. Object naming was indexed with the 15-item version of the Boston Naming Test (BNT-Short) (Fastenau, Denburg, & Mauer, Reference Fastenau, Denburg and Mauer1998) to reduce administration time and fatigue. To avoid confusion with similar-sounding letters, a large “F” printed in 200-size font on a card was presented as a prompt.
Word list memory was indexed with California Verbal Learning Test - Second Edition, Short Form (CVLT-II SF) (Delis, Kramer, Kaplan, & Ober, Reference Delis, Kramer, Kaplan and Ober2000). Our modification was to present the words both verbally and visually (one at a time) during the four learning trials. A Short Delay Free Recall was administered following a 30-s interference task of counting backward from 100 by ones. After approximately 10 min of nonverbal tasks, the Long Delay Free Recall was administered and tests of cued-recall and yes/no recognition administered immediately thereafter.
Executive functioning and attention were indexed using the Trail Making Tests (TMT) Parts A and B using standard administration procedures (Reitan & Wolfson, Reference Reitan and Wolfson1993). Completion time limit was 180 s for TMT A and 300 s for TMT B.
Working memory was indexed using Digit Span Forwards and Backwards from the Wechsler Adult Intelligence Scale-III (Wechsler, Reference Wechsler1997). The administration and scoring followed standard procedures.
Psychomotor speed was indexed using a short and less tiring instrument developed by our group that is similar to the original Delis–Kaplan Executive Functioning System (D-KEFS) TMT Part C (Delis, Kaplan, & Kramer, Reference Delis, Kaplan and Kramer2001). Using the stimulus page from TMT Part A, we removed the numbers leaving the empty circles that we connected with a dotted line. We reversed the Part A starting and ending points, so that the Part A ending point (i.e., location of number 25) became the beginning position and the Part A starting point (i.e., location of the number 1) became the ending position. The participant’s task was to trace over the dotted line, connecting the circles as quickly as possible using a marker. Completion time limit was 150 s.
Visual-spatial and constructional abilities were indexed using the Clock Drawing test and the Consortium to Establish a Registry for Alzheimer’s Disease (CERAD) Construction Test. In the Clock Drawing test, the participant was asked to fill in a pre-drawn, 4-inch-diameter circle with numbers to represent a clock face and then to draw the hands at “ten after eleven.” In the CERAD Construction Test the participant was asked to copy circle, four-sided diamond, intersecting rectangles, and cube.
Symptoms of depression were characterized using the Geriatric Depression Scale (GDS) (Yesavage et al., 1982-Reference Yesavage, Brink, Rose, Lum, Huang, Adey and Leirer1983).
More detailed information on testing procedures and scoring is provided in Supplementary Materials.
Cognitive status assessment and diagnosis
Cognitive status was determined using: (1) a structured neurological examination; (2) the MMSE, 3MS, and Animal Fluency Test; (3) the Clinical Dementia Rating (CDR) scale (Morris, Reference Morris1993); and (4) the Functional Activities Questionnaire (FAQ) (Pfeffer, Kurosaki, Harrah, Chance, & Filos, Reference Pfeffer, Kurosaki, Harrah, Chance and Filos1982). Participants were categorized based on the clinical diagnostic criteria as: (1) dementia, according to the Diagnostic and Statistical Manual of Mental Disorders, 4th edition (DSM-IV) (American Psychiatric Association, 1994), that is, impaired performance on MMSE or 3MS subtests indexing at least two cognitive domains and inability to perform at least one IADL; (2) CIND, that is, impaired performance on MMSE or 3MS subtests or some difficulty in performing IADLs due to cognition, but not meeting criteria for a dementia diagnosis (Graham et al., Reference Graham, Rockwood, Beattie, Eastwood, Gauthier, Tuokko and McDowell1997); or (3) normal cognition, that is, no substantial impairment on any cognitive domain (from subtests of MMSE, 3MS, or CDR) and no functional difficulties due to cognitive loss (from FAQ or CDR). Only individuals with normal cognition at their first in-person evaluation were included in the normative group.
Neurological examiners performed the cognitive status assessment and determined diagnostic classification at the end of the evaluation. No consensus diagnosis was used. Neurological examiners were physicians or nurse practitioners trained on the application of CIND and DSM-IV dementia diagnostic criteria by a licensed geriatric neurologist (C.K.).
We report norms on MMSE, 3MS, and animal fluency, that were used in determination of cognitive status, for two reasons: (1) these test scores were not the only criterion for cognitive diagnosis, another being performance in IADLs; (2) these tests are frequently used in aging and dementia settings and have low non-completion rates, making their norms useful.
If 4 or fewer scores on MMSE or 12 or fewer scores on 3MS were missing due to sensory, motor, or other difficulties, proportional scores were computed: proportional MMSE score=((30*MMSE total)/(30-MMSE number of missing points)), proportional 3MS score=((100*3MS total)/(100-3MS number of missing points)). This calculation assumes that the score obtained without completing all items would be proportionally equal to the score that would have been obtained if all items had been completed. The fewer scores missing, the more accurately the proportional score represents the theoretical total score; therefore, cutoffs for the number of missing items were established. If more than 4 scores in the MMSE or more than 12 scores in the 3MS were missing, proportional scores were not computed.
Data Analysis
Means, standard deviations, and percentiles (5, 10, 25, 50, 75, 90, and 95 percentiles) are reported for each test. For ease of use and comparison, norms are provided for the same age groups as in our previous report (Whittle et al., Reference Whittle, Corrada, Dick, Ziegler, Kahle-Wrobleski, Paganini-Hill and Kawas2007): 90–91, 92–94, and ≥95 years. The effect of age was assessed by regression analysis with age as a continuous variable. The age-adjusted independent effects of sex, education [the same categories as in our previous work (Whittle et al., Reference Whittle, Corrada, Dick, Ziegler, Kahle-Wrobleski, Paganini-Hill and Kawas2007): high school or less, some college to college graduate, at least some graduate school were used for consistency and ease of comparison], and GDS score (<4 vs. ≥4) were assessed by multivariable regression analyses. Effect sizes are reported using Cohen’s d (Cohen, Reference Cohen1988). To compare characteristics among the age groups, we used Fisher’s exact tests for categorical variables and t tests and analyses of variance for continuous variables. SAS version 9.4 (SAS Institute Inc., Cary, NC) was used for statistical analyses.
The study provides age norms, norms by sex and education for the tests with significant sex/education effects after adjusting for age, and missing data. Norms for men and women separately and optional scores (performance on subtests and training samples, cued responses, and errors) are provided in the Supplementary Material (Supplementary Tables 1–7).
RESULTS
Group Demographics and Health
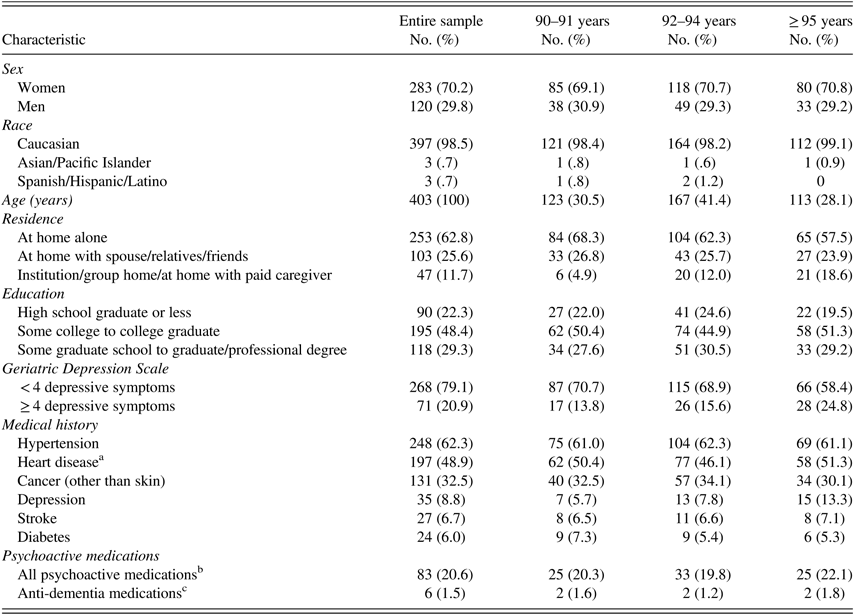
The sample of 403 cognitively normal participants (283 women and 120 men) has an average age of 94 years (range, 90–102 years) (Table 2). Most participants were Caucasian (98.5%), well-educated (78% were educated beyond high school), and lived by themselves (63%). Education did not differ significantly among the three age groups (90–91, 92–94, ≥95) (p=.79, Fisher’s exact test).
Table 2 Characteristics of study participants
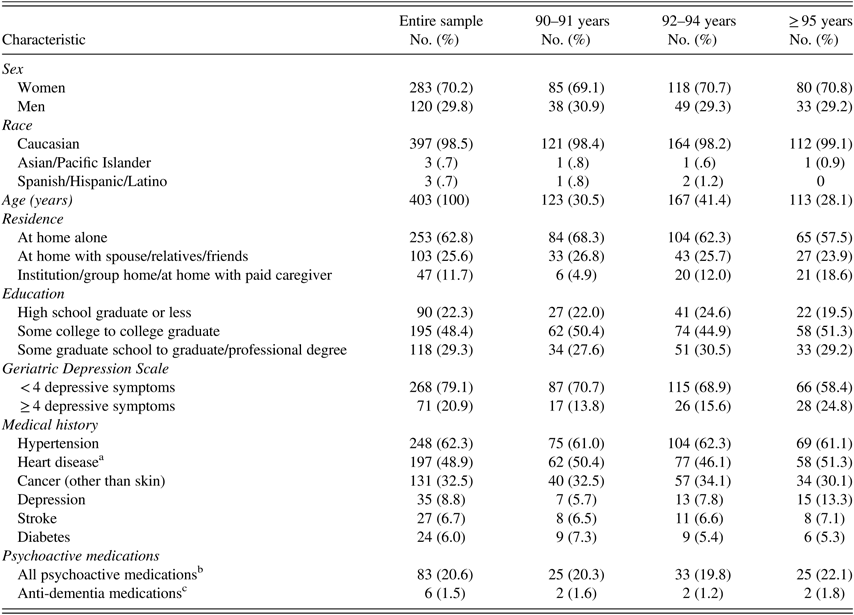
Note. All percentages are column percentages out of total sample of 403 participants.
a Heart disease includes: coronary artery disease, myocardial infarction, atrial fibrillation or other arrhythmias, heart valve disease, and congestive heart failure.
b All psychoactive medications include: narcotic analgesics, general anesthetics, anxiolytics, sedatives, hypnotics, CNS stimulants, antidepressants, antipsychotics, anti-parkinsonian, and anti-dementia medications.
c Anti-dementia medications include: cholinesterase inhibitors and/ or NMDA antagonist.
The most frequent health problems were history of hypertension (62%), heart disease (49%), and non-skin cancer (33%), with no significant differences in prevalence among the three age groups (p=.52, Fisher’s exact test). Although 9% of participants reported receiving a diagnosis of depression, over 20% had an elevated depression score (GDS ≥ 4). The proportion of participants with GDS ≥ 4 increased significantly with age (F(1,233)=5.68; p=.02). Reporting a diagnosis of depression also increased with age, although not significantly (p=.11, Fisher’s exact test).
At the time of testing 83 (21%) participants reported taking psychoactive medications (narcotic analgesics, general anesthetics, anxiolytics, sedatives, hypnotics, CNS stimulants, antidepressants, antipsychotics, antiparkinsonian) or anti-dementia medications (cholinesterase inhibitors or NMDA antagonist). Use of psychoactive medication was not significantly different among the three age groups (p=.88, Fisher’s exact test). Only 6 (1.5%) participants were taking anti-dementia medications with no difference among the three age groups (p=.11, Fisher’s exact test).
Effects of Age and Age-Adjusted Effects of Education, Sex, and Depressive Symptoms on Test Scores
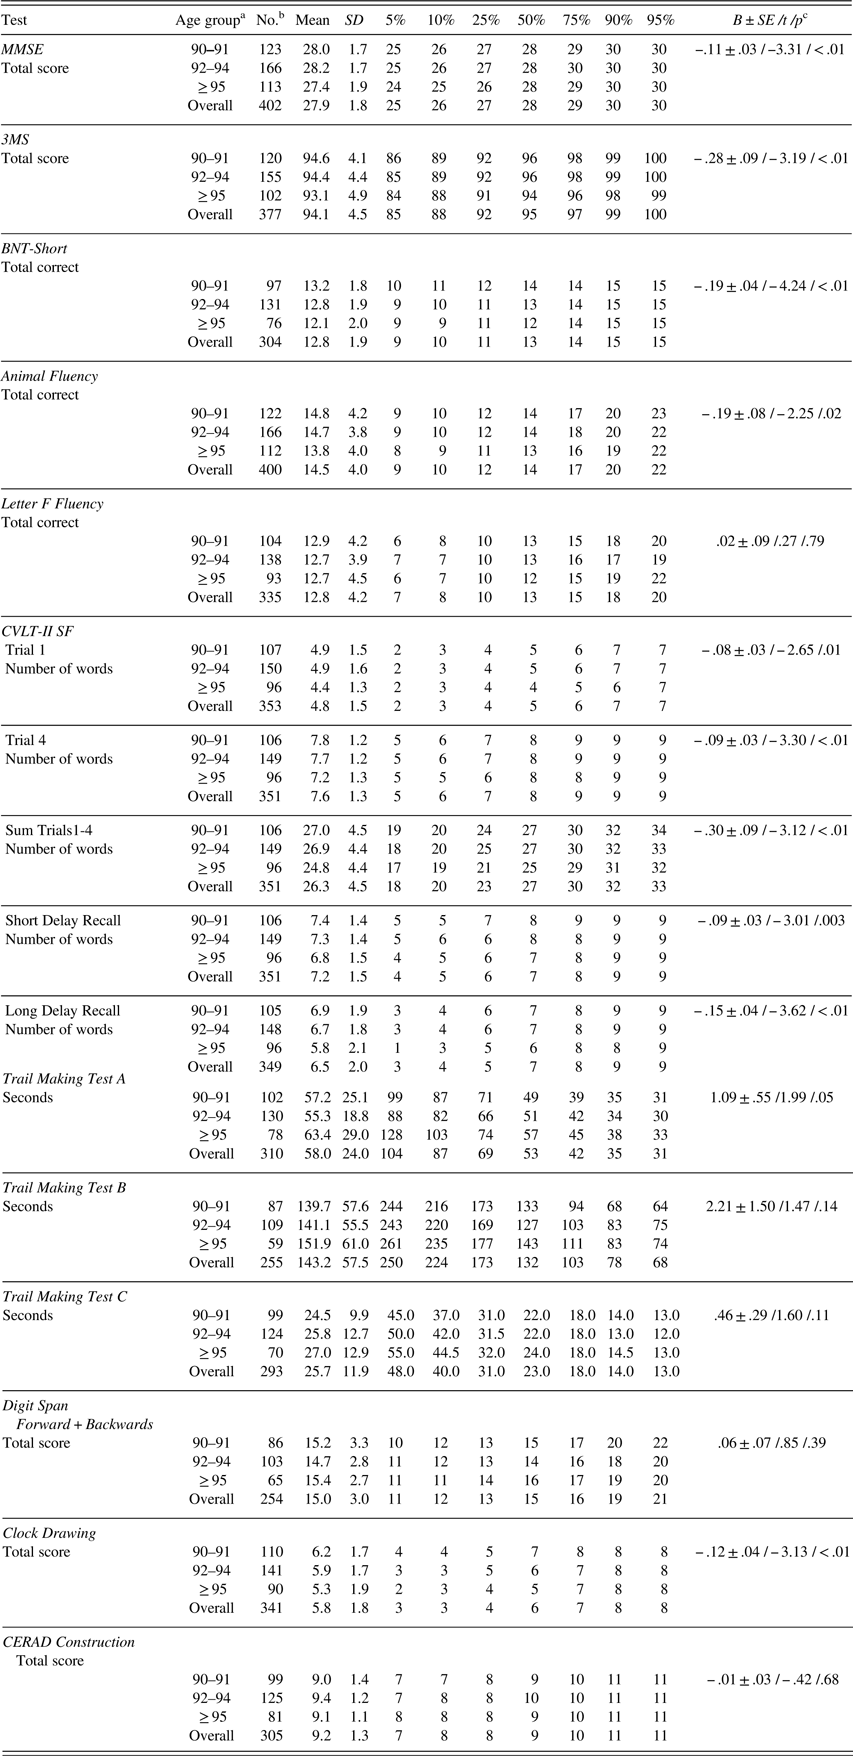
With increasing age, total scores on MMSE, 3MS, BNT-Short number of spontaneous correct responses (henceforth listed as BNT-Short for brevity), animal fluency, free recall trials (including short and long delays) in CVLT-II SF, TMT A, and clock drawing test were significantly lower (Table 3).
Table 3 Raw neuropsychological test scores (mean, SD, percentiles) by age group
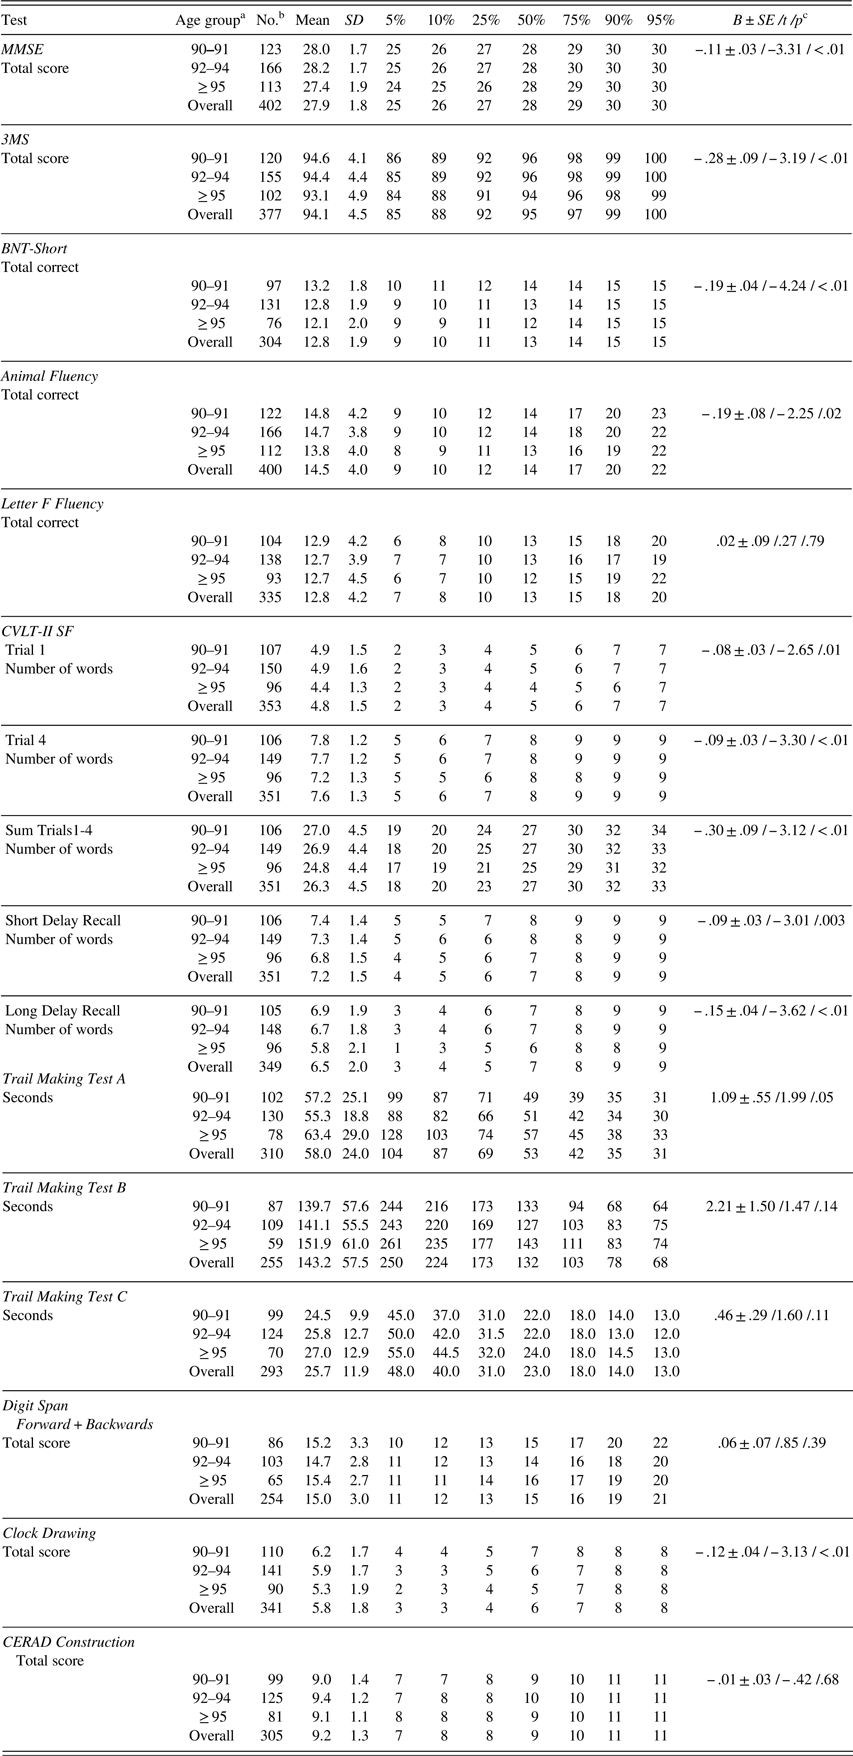
Note. MMSE=Mini-Mental State Examination; 3MS=Modified Mini-Mental State Examination; BNT-Short=Boston Naming Test, Short Form (15 items); CVLT-II SF=California Verbal Learning Test-II, Short Form; CERAD=The Consortium to Establish a Registry for Alzheimer’s Disease. MMSE and 3MS were used in determination of cognitive status.
a In years.
b Number of participants does not always total 403 as not all the participants completed all the tests.
c B±SE /t /p=parameter estimate±standard error /t-value /p-value from linear regression analysis with age as a continuous variable.
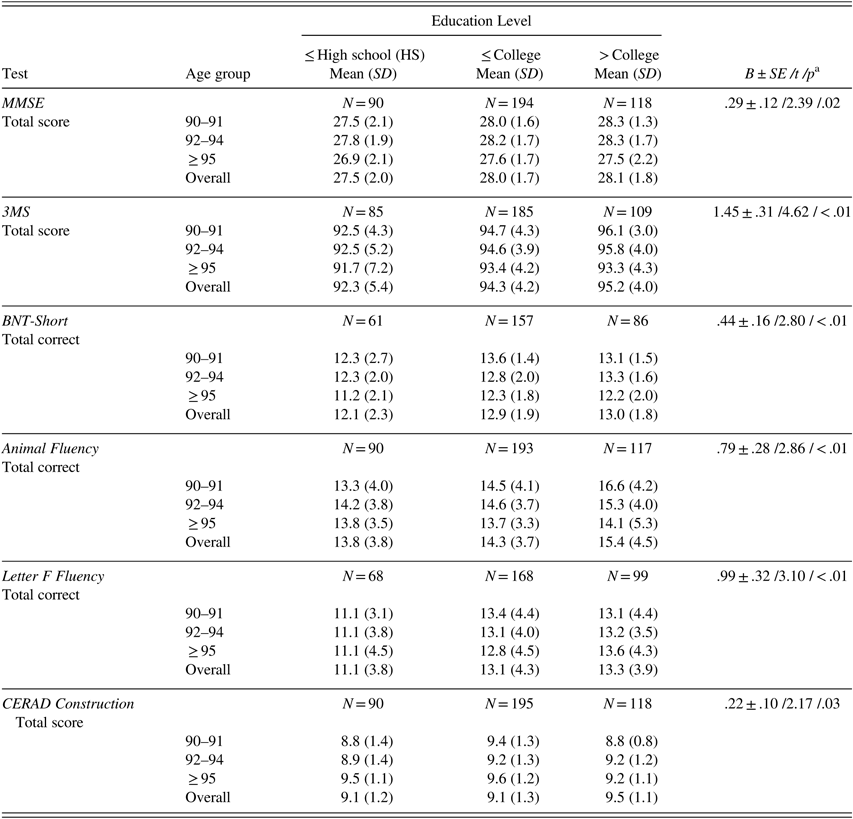
After adjusting for age, individuals with more education scored significantly higher than those with less education on MMSE, 3MS, BNT-Short, animal and letter F fluencies, and CERAD Construction (Table 4).
Table 4 Raw neuropsychological test scores (mean, SD) by age group for different education levels
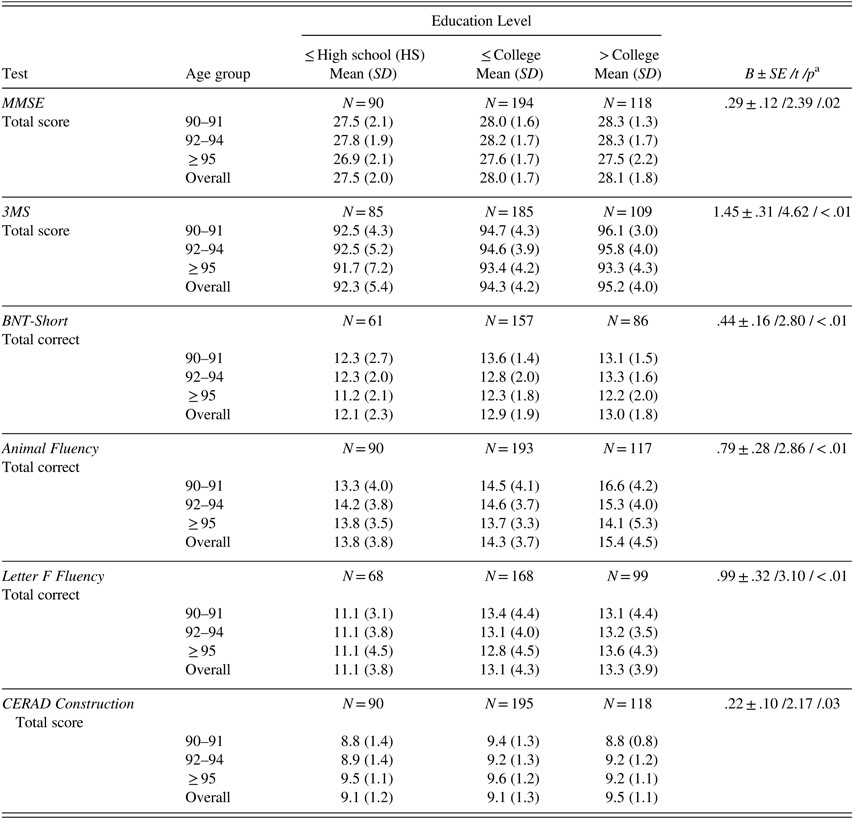
Note. Scores are provided only for tests for which education level significantly contributed to test performance after controlling for age. MMSE=Mini-Mental State Examination; 3MS=Modified Mini-Mental State Examination; BNT-Short=Boston Naming Test, Short Form (15 items).
a B±SE /t /p=parameter estimate±standard error /t-value /p-value from linear regression analysis with age as continuous and education as categorical variable (high school or less, some college to completed college, some graduate school to completed graduate school).
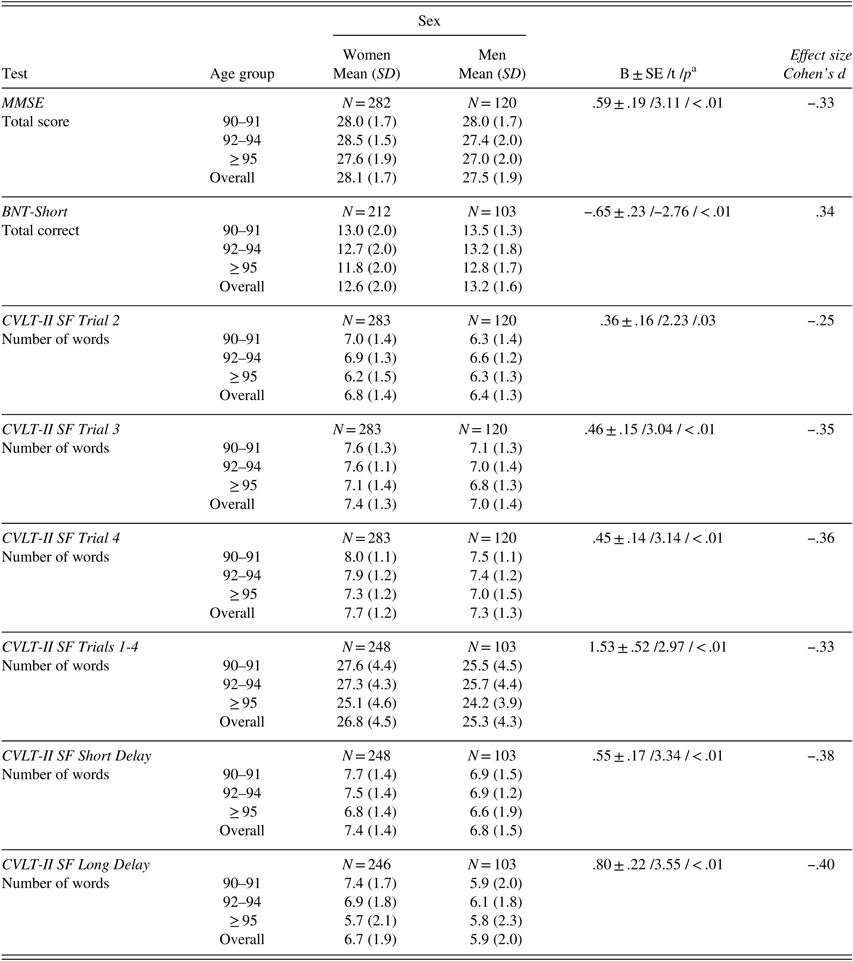
After adjusting for age, men scored higher than women on BNT-Short, whereas women scored significantly higher than men on the MMSE and CVLT-II SF (Trials 2, 3, 4, Sum of Trials 1–4, short- and long-delay free recall). Effect sizes as measured by Cohen’s d were small to medium (.25 to .36) (Table 5).
Table 5 Raw neuropsychological test scores (mean, SD) by age group for women and men
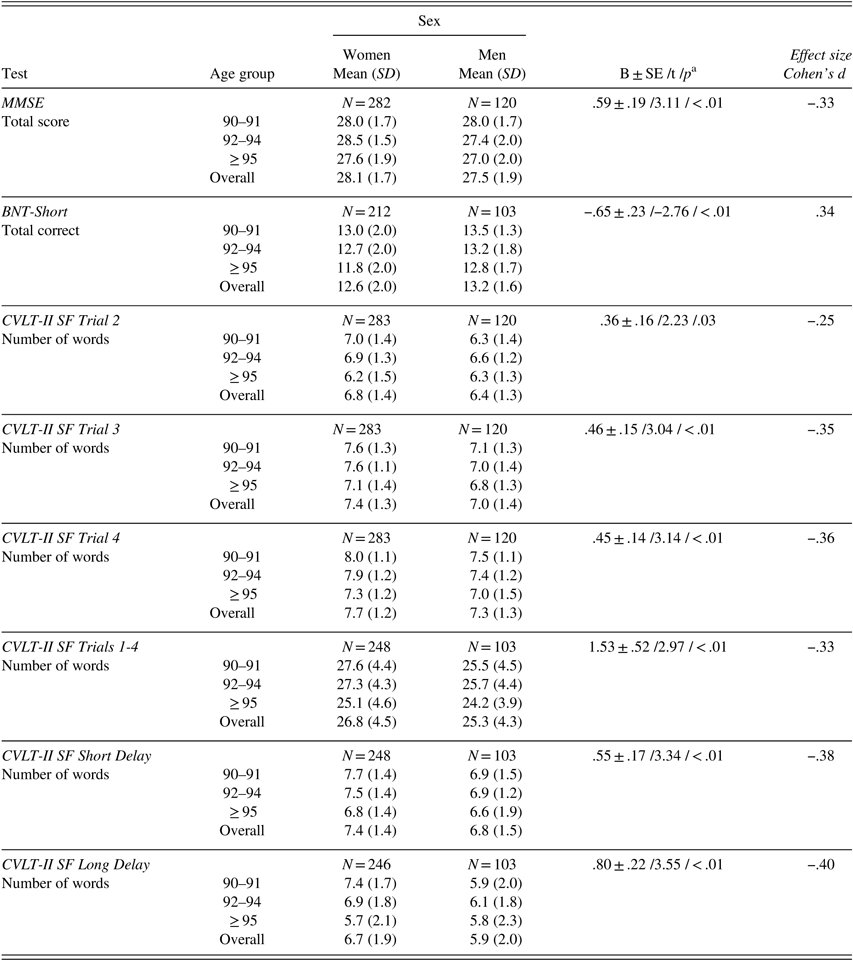
Note. Scores provided only for tests for which gender significantly contributed to test performance after controlling for age. MMSE=Mini-Mental State Examination; BNT-Short=Boston Naming Test, Short Form; CVLT-II SF=California Verbal Learning Test-II, Short Form.
a B±SE /t /p – parameter estimate±standard error /t-value /p-value from linear regression analysis with age as continuous and sex as categorical variable.
A higher GDS score was significantly associated with lower scores on 3MS, BNT-Short, animal and letter F fluencies, CVLT-II SF Trial 4, short- and long-delay free recall, and TMT A (results not shown).
Adjustment for education did not alter the effects of sex and GDS score on test scores.
Comparison of Participants Who Did and Did Not Complete All the Tests
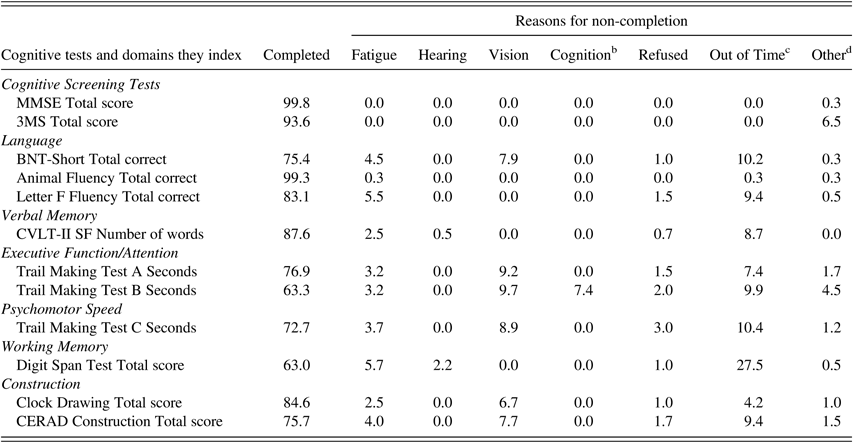
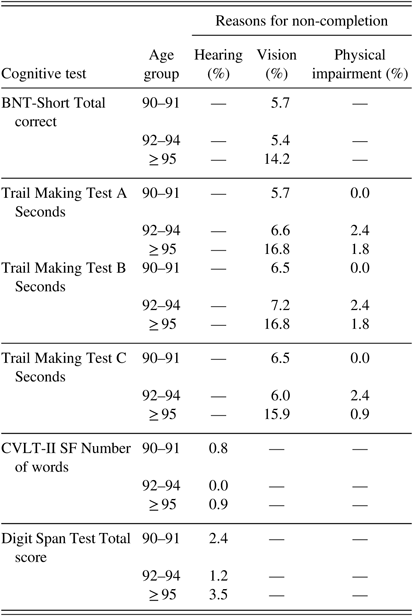
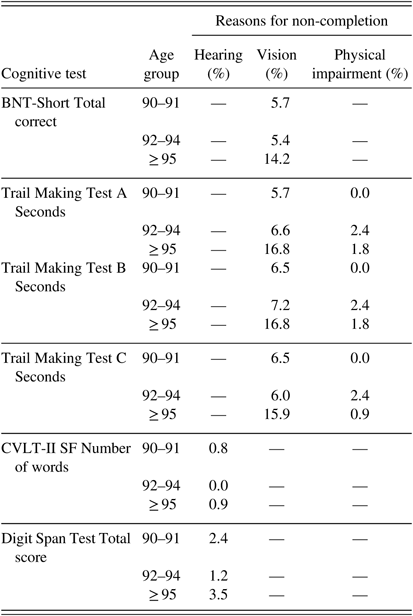
Not all participants completed all tests, primarily due to fatigue, sensory impairments, or time constraints (Table 6). Hearing problems accounted for non-completion in 0.8–3.5% of participants (depending on the test), but the non-completion rate did not differ among the three age groups (p=.33, Fisher’s exact test) (Table 7). Non-completion due to motor symptoms (such as tremor) significantly increased with age from 0% in the 90–91 group to 1–2.4% in the two older age groups (p<.01, Fisher’s exact test). Vision impairment accounted for approximately 6% of non-completion in the two younger groups and significantly increased to approximately 16% in the ≥95 age group (p=.01, Fisher’s exact test).
Table 6 Percent of participants a who completed and did not complete each neuropsychological test and reasons for non-completion
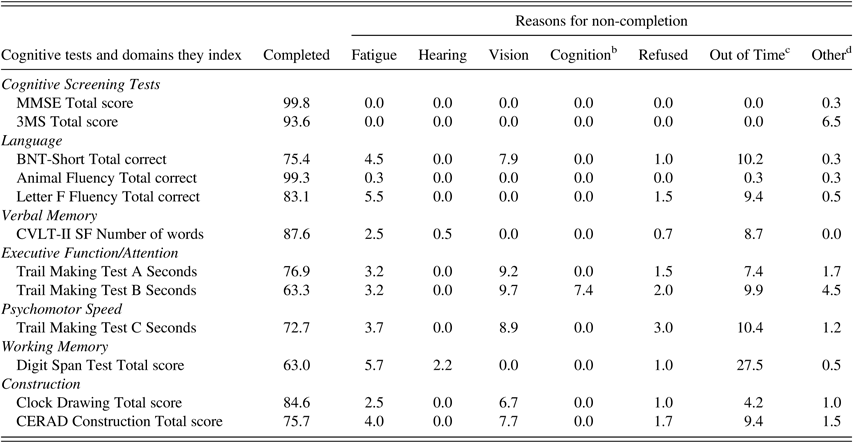
Note. MMSE=Mini-Mental State Examination; 3MS=Modified Mini-Mental State Examination; BNT-Short=Boston Naming Test, Short Form (15 items); CVLT-II SF=California Verbal Learning Test-II, Short Form; CERAD=The Consortium to Establish a Registry for Alzheimer’s Disease.
a Percent of participants out of the total 403 participants in the study sample.
b Could not understand instructions, became confused, forgot instructions.
c Ran out of time for the entire neuropsychological assessment, not individual test.
d Equipment error, tester error, other physical impairment of participant, e.g., tremor, alternate test given, quit after starting.
Table 7 Percent of participants who did not complete tests due to sensory or motor impairment by age group a
Note. BNT-Short=Boston Naming Test, Short Form (15 items); CVLT-II SF=California Verbal Learning Test-II Short Form.
a Percent of participants out of the total 403 in the study sample.
On the cognitive screening tests, 363 participants (90%) completed all MMSE items and 39 participants (10%) had 1–4 missing scores. The average MMSE score for participants who completed all items (mean=27.9; SD=1.7) did not differ from the proportional MMSE score computed for participants with 1–4 missing scores (mean=27.4; SD=2.2; t(43)=1.54; p=.13). All 3MS items were completed by 362 participants (96%); 15 participants (4%) had 1–12 missing scores. The average 3MS score for participants who completed all 3MS items (mean=94.2; SD=4.4) was higher than the proportional 3MS score computed for participants with 1–12 missing scores (mean=91.3; SD=5.6; t(375)=2.49; p=.01).
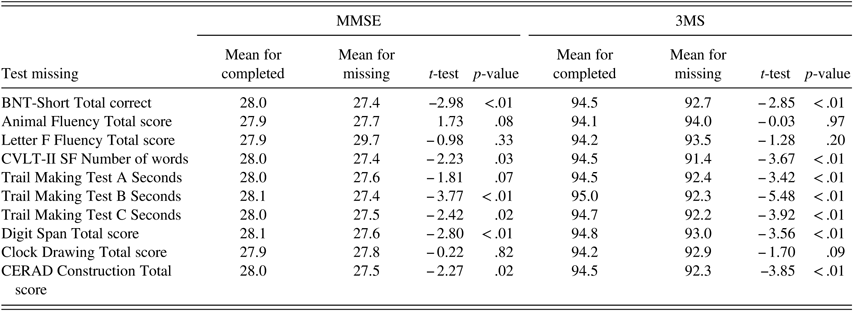
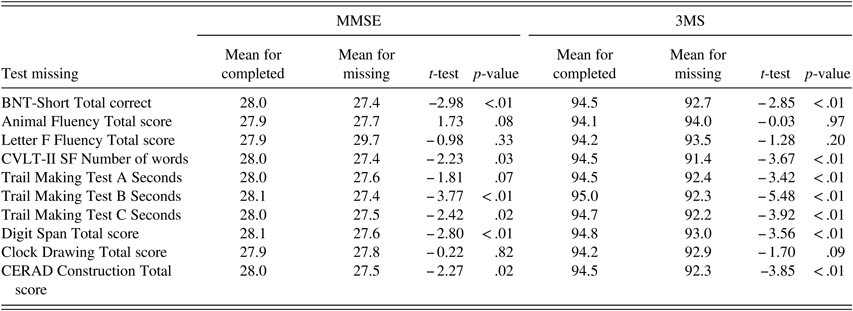
Within the entire testing battery, completion rates were high for tests administered first: MMSE (>99%), 3MS (94%), and Animal Fluency (99%). In comparison, tests administered toward the end of the battery were least likely to be completed: TMT B (63%) and Digit Span Test (63%). MMSE and 3MS scores were significantly higher among those who completed compared with those who did not complete select neuropsychological tests (BNT-Short, CVLT, TMT B and C, Digit Span, CERAD for MMSE and 3MS; TMT A also for 3MS) (Table 8).
Table 8 Raw MMSE and 3MS scores for participants who completed and did not complete specific neuropsychological tests
Note. BNT-Short=Boston Naming Test, Short Form (15 items); CVLT-II SF=California Verbal Learning Test-II Short Form; CERAD=The Consortium to Establish a Registry for Alzheimer’s Disease.
DISCUSSION
This report extends the available neuropsychological test norms for cognitively normal individuals aged 90 or older. We report norms by age group, sex, and education, which, along with symptoms of depression, influence test performance. These norms allow differentiation of cognitively normal individuals from those with cognitive impairment (CIND or dementia). In contrast, the norms in our earlier publication (Whittle et al., Reference Whittle, Corrada, Dick, Ziegler, Kahle-Wrobleski, Paganini-Hill and Kawas2007) were helpful in distinguishing between oldest-old with dementia and those without dementia (cognitively normal and CIND).
Consistent with our previous publication (Whittle et al., Reference Whittle, Corrada, Dick, Ziegler, Kahle-Wrobleski, Paganini-Hill and Kawas2007) and other reports (Dore, Elias, Robbins, Elias, & Brennan, Reference Dore, Elias, Robbins, Elias and Brennan2007; Elias, Elias, D’Agostino, Silbershatz, & Wolf, Reference Elias, Elias, D’Agostino, Silbershatz and Wolf1997; Harada, Natelson Love, & Triebel, Reference Harada, Natelson Love and Triebel2013), the current analysis shows that performance on screening measures and on tests indexing attention, language, verbal memory, and construction declines significantly with advancing age. Age-related change in cognitive performance including decline in speeded aspects of activity (Eckert, Keren, Roberts, Calhoun, & Harris, Reference Eckert, Keren, Roberts, Calhoun and Harris2010), failure to suppress irrelevant information (Dumas & Hartman, Reference Dumas and Hartman2008), and decreased use of strategies to improve learning and memory (Davis et al., Reference Davis, Klebe, Guinther, Schroder, Cornwell and James2013) is thought to be associated with structural and functional brain changes in older adults (Hafkemeijer et al., Reference Hafkemeijer, Altmann-Schneider, de Craen, Slagboom, van der Grond and Rombouts2014; Liu et al., Reference Liu, Yang, Xia, Zhu, Leak, Wei and Hu2017). Counter to our previous report (Whittle et al., Reference Whittle, Corrada, Dick, Ziegler, Kahle-Wrobleski, Paganini-Hill and Kawas2007), the current sample showed no age effect on TMT B or Digit Span Backwards. In The 90+ Study group and others (Rasmusson, Zonderman, Kawas, & Resnick, Reference Rasmusson, Zonderman, Kawas and Resnick1998) CIND explains larger proportion of variance in test performance than age.
In the current sample, education, sex, and symptoms of depression contributed to test performance independently of age. Similarly to others (Au et al., Reference Au, Seshadri, Wolf, Elias, Elias, Sullivan and D’Agostino2004; Dore et al., Reference Dore, Elias, Robbins, Elias and Brennan2007; Elias et al., Reference Elias, Elias, D’Agostino, Silbershatz and Wolf1997; Ganguli et al., Reference Ganguli, Snitz, Lee, Vanderbilt, Saxton and Chang2010; Saykin et al., Reference Saykin, Gur, Gur, Shtasel, Flannery, Mozley and Mozley1995), we found an effect of education on cognitive screening tests and on tests that index naming, verbal fluency and construction. As education is implicated in cognitive reserve, slower age-related cognitive decline, and overall test-wiseness (de Azeredo Passos et al., Reference de Azeredo Passos, Giatti, Bensenor, Tiemeier, Ikram, de Figueiredo and Barreto2015; Gasquoine, Reference Gasquoine2009; Stern, Reference Stern2012), it can contribute to test performance.
In the current group, men scored significantly higher than women on the test indexing naming, but lower on the cognitive screening tests and verbal memory. Higher scores on the naming test in men than women have been reported previously, with no consensus on the mechanisms of these differences. Factors that have been explored include IQ and white matter changes (Hall, Vo, Johnson, Wiechmann, & O’Bryant, Reference Hall, Vo, Johnson, Wiechmann and O’Bryant2012). Although men in our group were slightly more educated than women, education did not explain sex differences in test performance. Higher performance of women than men on cognitive screening tests and tests indexing verbal memory has been demonstrated previously and ascribed to different approaches to encoding and learning in men and women or hormonal factors (Gale, Baxter, Connor, Herring, & Comer, Reference Gale, Baxter, Connor, Herring and Comer2007; Hogervorst, Rahardjo, Jolles, Brayne, & Henderson, Reference Hogervorst, Rahardjo, Jolles, Brayne and Henderson2012; Rosselli, Tappen, Williams, & Salvatierra, Reference Rosselli, Tappen, Williams and Salvatierra2006). Although the observed effect sizes of sex differences in test performance were not large, use of sex-specific norms is recommended when available.
The well-documented association of elevated scores on depression measures with lower cognitive performance (Koenig, Bhalla, & Butters, Reference Koenig, Bhalla and Butters2014; Morimoto & Alexopoulos, Reference Morimoto and Alexopoulos2013) was observed in our group on cognitive screening tests and on tests that index memory, verbal fluency, and attention. This could be related to poor effort, underlying subclinical dementia, or disruption in structural and functional brain integrity due to factors such as cerebrovascular pathology (Weisenbach, Boore, & Kales, Reference Weisenbach, Boore and Kales2012).
The prevalence of self-reported health problems in our group is similar to other reports for the oldest-old (Lee, Go, Lindquist, Bertenthal, & Covinsky, Reference Lee, Go, Lindquist, Bertenthal and Covinsky2008; Nosraty, Sarkeala, Hervonen, & Jylhä, Reference Nosraty, Sarkeala, Hervonen and Jylhä2012). We found no differences among the three age groups, which agrees with reports of no age change or a decline with age in nonagenarians and centenarians (Kheirbek et al., Reference Kheirbek, Fokar, Shara, Bell-Wilson, Moore, Olsen and Llorente2017; Selim et al., Reference Selim, Fincke, Berlowitz, Miller, Qian, Lee and Kazis2005). Therefore, decline in test performance with age cannot be ascribed to differential impact of health problems in our three age groups.
The prevalence of psychoactive medication use in our group was similar to that reported in other studies of the oldest-old (Blumstein, Benyamini, Chetrit, Mizrahi, & Lerner-Geva, Reference Blumstein, Benyamini, Chetrit, Mizrahi and Lerner-Geva2012; Wastesson, Parker, Fastbom, Thorslund, & Johnell, Reference Wastesson, Parker, Fastbom, Thorslund and Johnell2012). We observed no age difference in intake which is consistent with other reports (Wastesson et al., Reference Wastesson, Parker, Fastbom, Thorslund and Johnell2012). Therefore, we cannot ascribe the decline in test performance with age to the differential impact of psychoactive medication.
The decline in test scores with age may be related to neurodegeneration, as discussed above, but also to sensory or motor impairments. Indeed, in our sample, test non-completion due to visual or motor impairments increased with age. Cross-sectional and longitudinal studies report increased prevalence and risk of cognitive impairment in individuals with sensory impairments (Maharani et al., Reference Maharani, Dawes, Nazroo, Tampubolon and Pendleton2018; Mitoku, Masaki, Ogata, & Okamoto, Reference Mitoku, Masaki, Ogata and Okamoto2016).
Scores in this study are generally comparable with other reports on cognitively normal oldest-old (Boeve et al., Reference Boeve, McCormick, Smith, Ferman, Rummans, Carpenter and Petersen2003; Fine, Kramer, Lui, Yaffe, & Study of Osteoporotic Fractures [SOF] Research Group, Reference Fine, Kramer, Lui and Yaffe2012; Iacono et al., Reference Iacono, Resnick, O’Brien, Zonderman, An, Pletnikova and Troncoso2014; Ivnik, Malec, Smith, Tangalos, & Petersen, Reference Ivnik, Malec, Smith, Tangalos and Petersen1996; Miller et al., Reference Miller, Himali, Beiser, Murabito, Seshadri, Wolf and Au2015; National Alzheimer’s Coordinating Center, 2017; Tombaugh, Kozak, & Rees, Reference Tombaugh, Kozak and Rees1999; Weintraub et al., Reference Weintraub, Besser, Dodge, Teylan, Ferris, Goldstein and Morris2018; Zubenko, Zubenko, Maher, & Wolf, Reference Zubenko, Zubenko, Maher and Wolf2007). As expected, our scores are consistently higher than in studies of non-demented oldest-old that included both normal individuals and those with mild forms of cognitive impairment (Brayne, Gill, Paykel, Huppert, & O’Connor, Reference Brayne, Gill, Paykel, Huppert and O’Connor1995; Carrión-Baralt, Meléndez-Cabrero, Schnaider Beeri, Sano, & Silverman, Reference Carrión-Baralt, Meléndez-Cabrero, Schnaider Beeri, Sano and Silverman2009; Cherry et al., Reference Cherry, Brown, Marks, Galea, Volaufova, Lefante and Jazwinski2011; Elias et al., Reference Elias, Dore, Goodell, Davey, Zilioli, Brennan and Robbins2011; Iacono et al., Reference Iacono, Resnick, O’Brien, Zonderman, An, Pletnikova and Troncoso2014; Pioggiosi, Berardi, Ferrari, Quartesan, & De Ronchi, Reference Pioggiosi, Berardi, Ferrari, Quartesan and De Ronchi2006; Steen, Sonn, Hanson, & Steen, Reference Steen, Sonn, Hanson and Steen2001; Wahlin et al., Reference Wahlin, Bäckman, Mäntylä, Herlitz, Viitanen and Winblad1993; Whittle et al., Reference Whittle, Corrada, Dick, Ziegler, Kahle-Wrobleski, Paganini-Hill and Kawas2007). This is most likely due to the inclusion of individuals with mild forms of cognitive impairment in other studies as well as possible age and education differences between cohorts. Reports on centenarians and near centenarians provide lower test scores compared with our group, which could be due to higher age and the possible inclusion of cognitively impaired individuals in other cohorts (Beker et al., Reference Beker, Sikkes, Hulsman, Schmand, Scheltens and Holstage2018; Davey et al., Reference Davey, Dai, Woodard, Miller, Gondo, Johnson and Centenarian2013, Reference Davey, Elias, Siegler, Lele, Martin, Johnson and Poon2010; Ganz et al., Reference Ganz, Beker, Hulsman, Sikkes, Bank, Scheltens and Holstege2018; Hagberg, Bauer Alfredson, Poon, & Homma, Reference Hagberg, Bauer Alfredson, Poon and Homma2001; Jopp, Park, Lehrfeld, & Paggi, Reference Jopp, Park, Lehrfeld and Paggi2016; Miller et al., Reference Miller, Mitchell, Woodard, Davey, Martin, Poon and Siegler2010).
Compared with the oldest-old population in the United States (He & Muenchrath, Reference He and Muenchrath2011), our sample differs little by sex (70% vs. 74% female), has a higher proportion of Caucasians (98.5% vs. 88%) and is much more highly educated (78% vs. 28% having more than a high school education). Although our group is not representative of other races, Caucasians are currently the overwhelming majority of the oldest-old in the United States, which makes our work relevant for most U.S. oldest-old at the present time. Our greater proportion of Caucasians is likely related to the ethnic composition of the recruitment area and highlights challenges associated with recruitment of underrepresented racial groups (Zhou et al., Reference Zhou, Elashoff, Kremen, Teng, Karlawish and Grill2017). Our sample does not adequately represent cultural parameters, approximated by race, that are critical for test performance (Harris & Llorente, Reference Harris and Llorente2005). Therefore, applicability of present norms to other racial and ethnic groups is limited. In the absence of appropriate norms, it is advisable to use norms from samples most closely matching characteristics of a test-taker and to be aware of the sources of variation of test performance in different cultural groups (Ardila, Reference Ardila2007).
We report norms by sex and education for cognitively unimpaired oldest-old. Although in older adults quality of education (measured by reading level) (Manly, Jacobs, Touradji, Small, & Stern, Reference Manly, Jacobs, Touradji, Small and Stern2002) or IQ score (Steinberg, Bieliauskas, Smith, Langellotti, & Ivnik, Reference Steinberg, Bieliauskas, Smith, Langellotti and Ivnik2005) is more closely associated with neuropsychological test performance than level of education, we believe that by stratifying norms by education level we likely accounted for some environmental and individual characteristics related to quality of education and IQ.
Like the majority of previously reported neuropsychological test norms, the present norms were derived from a group of participants whose cognitive status was determined cross-sectionally at the baseline evaluation. Despite our best attempt to exclude individuals with cognitive difficulties by applying clinical diagnostic criteria, a weakness of the cross-sectional approach is that individuals who go on to develop dementia may still be included into the normative sample (Sliwinski et al., Reference Sliwinski, Lipton, Buschke and Stewart1996). In contrast, deriving norms from individuals who are cognitively normal at baseline and remain normal for several years minimizes the inclusion of individuals with preclinical dementia. This longitudinal approach to cognitive status determination likely provides greater sensitivity for the detection of cognitive impairment (Masur, Sliwinski, Lipton, Blau, & Crystal, Reference Masur, Sliwinski, Lipton, Blau and Crystal1994; Sliwinski et al., Reference Sliwinski, Lipton, Buschke and Stewart1996). While attractive, this approach has several drawbacks, including the limited life expectancy in the oldest-old. However, given the potential advantages of longitudinally determined norms, we plan to explore their utility for the oldest-old.
Strengths and Limitations
This study has several notable strengths. First, we report data on one of the largest well-characterized groups of cognitively normal 90+ year olds. The large sample size made it possible to provide norms by sex and education in each of the three relatively narrow age groups. In most cases, our cell size is 50 or more participants, a desirable number for stable estimate of population mean (D’Elia, Satz, & Schretlen, Reference D’Elia, Satz and Schretlen1989). Most, but not all (Ivnik et al., Reference Ivnik, Malec, Smith, Tangalos and Petersen1996), normative reports collapse individuals aged 90 and older into one age group or have much smaller cell sizes. With no upper age limit, we have a wider age range than age-restricted studies (Boeve et al., Reference Boeve, McCormick, Smith, Ferman, Rummans, Carpenter and Petersen2003). Second, this study, like some (Davey et al., Reference Davey, Elias, Siegler, Lele, Martin, Johnson and Poon2010; Iacono et al., Reference Iacono, Resnick, O’Brien, Zonderman, An, Pletnikova and Troncoso2014; Ivnik et al., Reference Ivnik, Malec, Smith, Tangalos and Petersen1996; Pioggiosi et al., Reference Pioggiosi, Berardi, Ferrari, Quartesan and De Ronchi2006; Tombaugh et al., Reference Tombaugh, Kozak and Rees1999; Wahlin et al., Reference Wahlin, Bäckman, Mäntylä, Herlitz, Viitanen and Winblad1993; Weintraub et al., Reference Weintraub, Besser, Dodge, Teylan, Ferris, Goldstein and Morris2018), but not all (Au et al., Reference Au, Seshadri, Wolf, Elias, Elias, Sullivan and D’Agostino2004; Elias et al., Reference Elias, Dore, Goodell, Davey, Zilioli, Brennan and Robbins2011; Fine et al., Reference Fine, Kramer, Lui and Yaffe2012) normative publications, is based on data from a study specifically designed as a cognitive aging study and uses tests well suited for the oldest-old. The tests are relatively short and involve modifications of procedures and stimuli to accommodate the sensory deficits and reduced stamina that often confound cognitive testing in old age. Third, norms are reported for tests indexing a wide range of cognition and are most frequently used by neuropsychologists. Fourth, we provide more detailed normative information, including several percentile ranges, than the majority of publications on the topic. Fifth, the detailed description of our testing procedures and scoring system facilitates data replication and tests usage. Sixth, every effort was made to collect as much testing data as possible by testing participants in their homes including traveling to other states. Seventh, cognitive status determination was based on clinical diagnostic criteria applied by trained clinicians (and not on self-report or a screening measure cutoff score) ensuring that only individuals with normal cognition were included.
We acknowledge several limitations. First, our sample represents mostly well-educated Caucasians, which limits the applicability of reported norms. Second, not all participants completed the entire test battery. Had those tests been completed, they might have affected the reported normative values. Supporting this, our analysis showed lower scores in the cognitive screening tests in individuals who did not complete individual tests compared with those who did. One of the reasons for test non-completion might be that some of the tests were more challenging than others. While we chose tests of various levels of difficulty to assess a wide range of cognitive abilities, other projects may benefit from a limited battery to decrease frustration, provide more valid results, and increase completion rates. Third, fixed, compared to counterbalanced, test order did not allow us to account for potential effects of the order of test administration. For instance, anxiety at the beginning and fatigue at the end of the testing may impact test performance, as may order effects such that tests administered earlier might facilitate or halt performance on subsequent tests (Franzen, Smith, Paul, & MacInnes, Reference Franzen, Smith, Paul and MacInnes1993; Llorente, Sines, Rozelle, Turcich, & Casatta, Reference Llorente, Sines, Rozelle, Turcich and Casatta2000). Despite the disadvantages, in The 90+ Study we elected to use a fixed order to ensure high completion rates of at least a few tests, given that fatigue is a major reason for test non-completion in the oldest-old. Fourth, although we strived to make our test battery comprehensive, we did not index all possible domains (e.g., fine motor skills or visual memory) to keep the battery short. Fifth, we report norms on the MMSE, 3MS, and Animal Fluency, even though these tests were used as criteria for normal cognition. We report these norms because the tests are frequently used in aging and dementia settings and their norms for the oldest-old are much needed, but the users need to be aware of the potential circularity. Sixth, the number of centenarians is limited in our group, therefore, we combined them with those aged 95 and older. We hope to provide norms for centenarians in the future as more 90+ Study participants survive to this age.
CONCLUSIONS
Cross-sectional test norms derived from a group of cognitively normal individuals aged 90+ are instrumental in differentiating cognitively normal from impaired oldest-old. To our knowledge, this is one of the few reports on cognitive test norms derived from a large and well-characterized group of oldest-old individuals without cognitive impairment.
ACKNOWLEDGMENTS
The authors do not have any conflicts of interest to disclose. This work was supported by the National Institute on Aging (C.H.K., M.M.C., Z.A.M., A.P-H., C.W. grant R01AG021055; MBD, grant P50 AG016573). The authors thank the participants and their relatives, testers, examiners and staff of The 90+ Study.
Supplementary Materials
To view supplementary material for this article, please visit https://doi.org/10.1017/S1355617719000122


