INTRODUCTION
The last interglacial, the Eemian (roughly equivalent to Marine Isotope Stage 5e, ca. 130–115 ka ago), was a time when certain regions of the world experienced a warmer-than-present climate. While studies from temperate central Europe suggest that the Eemian was climatically rather stable, experiencing only minor short-term variability (Cheddadi et al., Reference Cheddadi, Mamakowa, Guiot, de Beaulieu, Reille, Andrieu, Granoszewski and Peyron1998; Kühl et al., Reference Kühl, Litt, Schölzel and Hense2007; Rioual et al., Reference Rioual, Andrieu-Ponel, de Beaulieu, Reille, Svobodova and Battarbee2007; Bińka et al., Reference Bińka, Nitychoruk and Dzierżek2011), records from northern Europe and the North Atlantic region have registered pronounced Eemian climate changes, seen as cooling and aridity pulses (Cortijo et al., Reference Cortijo, Duplessy, Labeyrie, Leclaire, Duprat and Van Wearing1994; Seidenkrantz et al., Reference Seidenkrantz, Kristensen and Knudsen1995; Fronval and Jansen, Reference Fronval and Jansen1996; Björck et al., Reference Björck, Noe-Nygaard, Wolin, Houmark-Nielsen, Jørgen Hansen and Snowball2000; Bauch et al., Reference Bauch, Kandiano, Helmke, Andersen, Rosell-Mele and Erlenkeuser2011; Irvalı et al., Reference Irvalı, Ninnemann, Galaasen, Rosenthal, Kroon, Oppo, Kleiven, Darling and Kissel2012; Galaasen et al., Reference Galaasen, Ninnemann, Irval, Kleiven, Rosenthal, Kissel and Hodell2014). Due to glacial erosion at high latitudes, Eemian sequences are rare at boreal sites in northern Europe. An excecption to this is the thick and continuous Eemian lake sediment sequence from Sokli, northeast Finland. This sedimentation basin was formed through the action of ice and water working along a fracture zone bisecting the Sokli Carbonatite Massif (SCM), a carbonatite-alkaline intrusion in the crystalline Precambrian Shield (Vartiainen, Reference Vartiainen1980).
Palynological analysis first proposed an Eemian age for the diatom gyttja deposit found between 25 and 16 m of depth at Sokli (Ilvonen, Reference Ilvonen1973). The bracketing glaciofluvial sands and gravel (28.5 and 25 m) and fluvial sands (16 to 13 m) were later dated by thermoluminescence (TL) and infrared stimulated luminescence (IRSL) to>ca. 110 ka and<ca. 150–180 ka, respectively (Helmens et al., Reference Helmens, Räsänen and Johansson2000, Reference Helmens, Bos, Engels, Van Meerbeeck, Bohncke, Renssen and Heiri2007). Additional optically stimulated luminescence (OSL) dating of the upper fluvial sands revealed an age>ca. 95 ka (Alexanderson et al., Reference Alexanderson, Eskola and Helmens2008). While an absolute chronology for this sequence is unavailable, previous studies have divided the lake development into five main phases: glacio-lacustrine, early-, early mid-, late mid-, and late-Eemian (Plikk et al., Reference Plikk, Helmens, Fernandez-Fernandez, Kylander, Löwemark, Risberg, Salonen, Väliranta and Weckström2016). Superimposed on these phases are two abrupt climate change events (Helmens et al., Reference Helmens, Salonen, Plikk, Engels, Väliranta, Kylander, Brendryen and Renssen2015; Plikk et al., Reference Plikk, Helmens, Fernandez-Fernandez, Kylander, Löwemark, Risberg, Salonen, Väliranta and Weckström2016). The earlier event reveals a cooling similar to that seen in the north Atlantic Ocean (Bauch et al., Reference Bauch, Kandiano, Helmke, Andersen, Rosell-Mele and Erlenkeuser2011; Irvalı et al., Reference Irvalı, Ninnemann, Galaasen, Rosenthal, Kroon, Oppo, Kleiven, Darling and Kissel2012; Galaasen et al., Reference Galaasen, Ninnemann, Irval, Kleiven, Rosenthal, Kissel and Hodell2014). Occurring after full interglacial conditions were reached, the “Tunturi event” saw summer temperatures drop 2–4°C over a time frame of 500–1000 yr. Similarly, the later event implies cooler and drier conditions at Sokli (Helmens et al., Reference Helmens, Salonen, Plikk, Engels, Väliranta, Kylander, Brendryen and Renssen2015; Plikk et al., Reference Plikk, Helmens, Fernandez-Fernandez, Kylander, Löwemark, Risberg, Salonen, Väliranta and Weckström2016).
Reconstructing past paleoenvironmental change using postglacial lake sediments must consider a lake’s natural development, or ontogeny, as well as the external climate signal we are often trying to capture. Studies in boreal landscapes on late-glacial/Holocene and recent timescales suggest a common pattern towards natural oligotrophication over time. After ice retreat, the catchment is stabilized through the gradual build-up of soils and colonization by vegetation. In boreal regions, this vegetation typically transitions from Betula to more acidic Pinus and Picea conifer species (Donner, Reference Donner1995). The growing catchment vegetation also retains more nutrients, making them unavailable for lake biota. Soluble minerals in the soils and exposed bedrock surfaces (e.g., apatite, biotite, and hornblende) are weathered and base cations are consumed, leading to the loss of alkalinity in the lake water. There is an influx of increasingly acidic water to the lake as soil organic matter (SOM) and dissolved organic carbon (DOC) in the catchment increase. These effects can be further enhanced by the inhibition of groundwater recharge by hardened soil horizons; this reduces contact with the bedrock and soils, and resultant leaching of base cations, and increases flow through humic-rich soils (Ford, Reference Ford1990; Pienitz et al., Reference Pienitz, Smol and MacDonald1999; Engstrom et al., Reference Engstrom, Fritz, Almendinger and Juggins2000; Fritz et al., Reference Fritz, Engstrom and Juggins2004; Boyle, Reference Boyle2007; Fritz and Anderson, Reference Fritz and Anderson2013; Law et al., Reference Law, Anderson and McGowan2015).
In contrast to the pattern commonly seen at boreal sites, previous studies based on biological proxies (diatoms, pollen, biogenic silica [BSi], total organic carbon [TOC], and chironomids) show that the lake at Sokli becomes increasingly eutrophic over time (Helmens et al., Reference Helmens, Salonen, Plikk, Engels, Väliranta, Kylander, Brendryen and Renssen2015; Plikk et al., Reference Plikk, Helmens, Fernandez-Fernandez, Kylander, Löwemark, Risberg, Salonen, Väliranta and Weckström2016). Within the literature, there is a discussion as to the relative importance of abiotic and biotic processes to lake development. Most studies, however, have been restricted to lakes in base cation-poor and mixed terrains (e.g., Whitehead et al., Reference Whitehead, Charles, Jackson, Smol and Engstrom1989; Ford, Reference Ford1990; Pienitz et al., Reference Pienitz, Smol and MacDonald1999; Engstrom et al., Reference Engstrom, Fritz, Almendinger and Juggins2000; Fritz et al., Reference Fritz, Engstrom and Juggins2004; Law et al., Reference Law, Anderson and McGowan2015) or modeling exercises (Boyle, Reference Boyle2007). Sokli differs from a typical boreal lake in that it sits in the base cation-rich SCM, providing us with an alternative geological, and therefore abiotic, setting in which to examine postglacial boreal lake ontogeny. The elemental chemistry of the sediments is controlled by the interplay between the geology, hydrology, and biology of the lake and its catchment as well as external climate changes. We use Principal Component Analysis (PCA) and supporting ratio and correlative tools (e.g., Kylander et al., Reference Kylander, Ampel and Wohlfarth2011; Ljung et al., Reference Ljung, Holmgren, Kylander, Sjolte, Van der Putten, Kageyama, Porter and Björck2015) from a high-resolution XRF core scanning dataset to reveal detail about processes relevant to lake ontogeny such as soil development/erosion, nutrient and base cation supply, and productivity. We then place these processes into context by comparing with previously published proxy data and attempt to understand what factors control the unusual lake ontogeny at Sokli.
MATERIALS AND METHODS
Sampling site
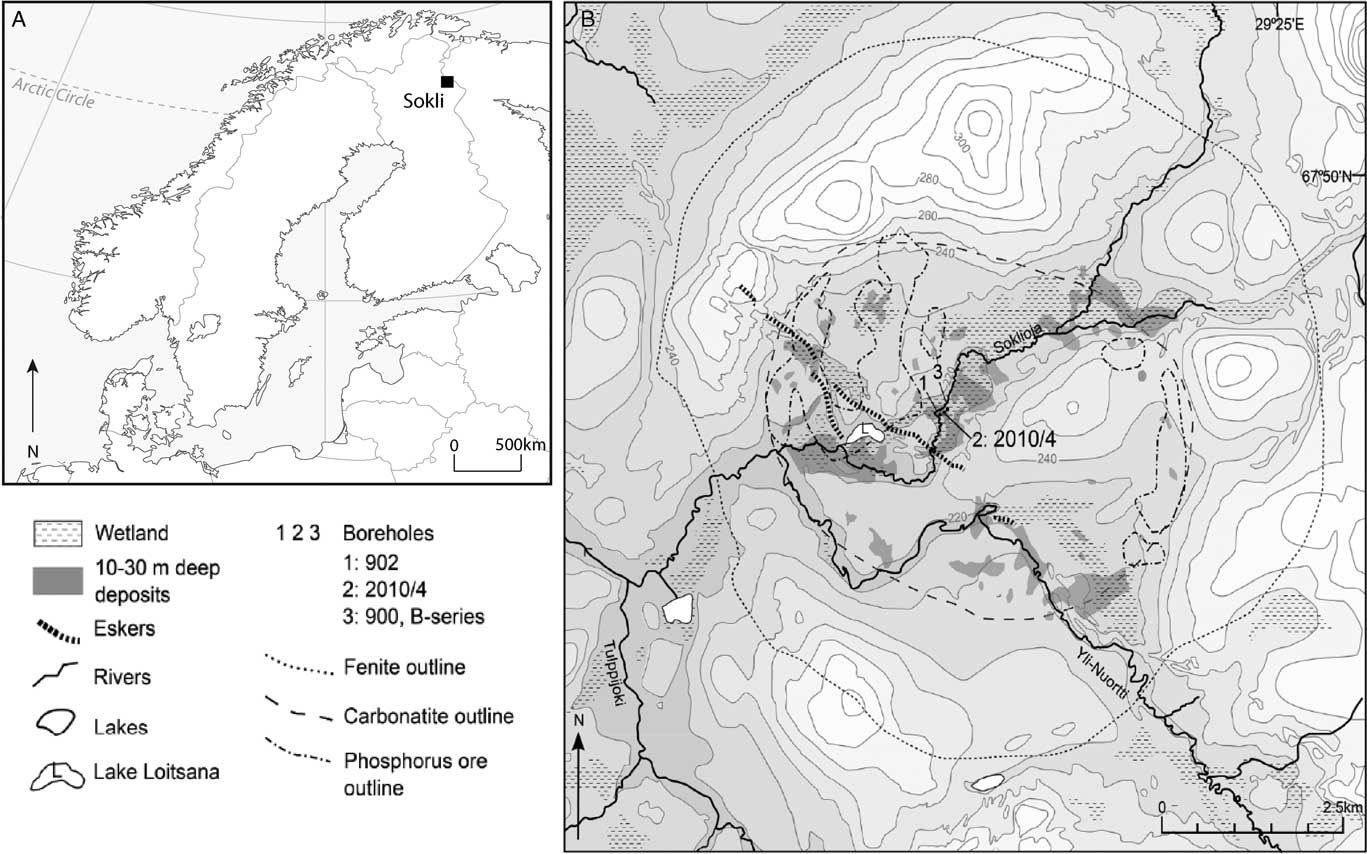
Sokli (67°48' N, 29°18'E), surface elevation 220 m asl, is situated in the SCM located in northeast Finland (Fig. 1A). The present-day climate around Sokli is cold boreal, with a mean annual temperature of 1°C and annual precipitation averages between 500–550 mm yr-1 (Drebs et al., Reference Drebs, Nordlund, Karlsson, Helminen and Rissanen2002). The vegetation is northern boreal forest and mires are widespread in the area. Soils in the region are generally composed of acidic podzols.

Figure 1 Location of the study site in northern Finland (A). The Sokli Eemian paleolake sits in the Sokli Carbonatite Massif (SCM), a carbonatite-alkaline complex surrounded by crystalline Precambrian Shield. The work presented here is from Borehole 2 (B).
The carbonate-rich magma intrusion of the SCM penetrated through the crystalline Precambrian Shield about 350 Ma ago. Today, the deeply eroded carbonatite intrusion forms a circular depression, ca. 5 km in diameter, surrounded by a hilly ring of fenites (up to 320 m asl) (Fig. 1B). Dispersed residual phosphorous deposits can be found across the carbonatite bedrock (Talvitie et al., Reference Talvitie, Lehmuspelto and Vuotovesi1981). The deeper part of the depression is now infilled with sedimentary deposits, the thickest of which are found in a string of hollows extending along a northeast-southwest-trending fracture valley that crosses the SCM. The sequence studied here is from the Sokli 2010/4 borehole, which was retrieved by percussion drilling in March 2010 by the Geological Survey of Finland.
Sample analysis
All sediment cores were described in the laboratory after retrieval. Prior to any sub-sampling, the sediments were scanned at the SLAM Lab at the Department of Geological Sciences, Stockholm University, using an ITRAX XRF Core Scanner from Cox Analytical Systems (Gothenburg, Sweden). Analyses were made using a Mo tube set at 30 kV and 45 mA with a step size of 2.5 mm and a dwell time of 60 s. Based on analytical performance (counting statistics above background), reliable data were acquired for Si, S, K, Ca, Ti, Mn, Fe, Rb, Sr, and Zr. All data presented here are normalized to the (incoherent+coherent) scattering to remove various instrumental effects and then smoothed using a 5-point running mean to capture the main shifts. Full analytical details of BSi, TOC, siliceous microfossil, and pollen analyses can be found in Plikk et al. (Reference Plikk, Helmens, Fernandez-Fernandez, Kylander, Löwemark, Risberg, Salonen, Väliranta and Weckström2016).
Statistical methods
Data interpretation was aided by PCA, which was made using JMP 9.0.0 software in correlation mode using a Varimax rotation. Before analysis all data were converted to Z-scores calculated as (Xi - Xavg) /Xstd, where Xi is the normalized elemental peak areas, and Xavg and Xstd are the series average and standard deviation, respectively, of the variable Xi. This was done to avoid scaling effects and to obtain average-centered distributions (Eriksson et al., Reference Eriksson, Johansson, Kettaneh-Wodl and Wold1999). All principal components (PCs) with Eigenvalues above 1 were extracted. To reduce the amount of data manipulation when making correlations between data of different resolution, a single XRF core scanning data point was selected for matching TOC, TIC, and BSi sample depths.
RESULTS
Stratigraphy
The sediment between 25 and 16 m is mainly composed of diatom gyttja, which is divided into 13 units based on the stratigraphy and sediment properties. Due to the open core head during drilling, several cores were compressed but this was corrected for in the stratigraphic column presented here. Note that this compression may have affected the visibility of some laminations, namely in Units C, F, G, and H. Details of the compressed sections are given in Plikk et al. (Reference Plikk, Helmens, Fernandez-Fernandez, Kylander, Löwemark, Risberg, Salonen, Väliranta and Weckström2016).
The lowermost Unit A (25.00–23.41 m) consists of partly laminated brown gyttja with thin yellowish laminations (Fig. 2–4, 6). In Unit B (23.41–23.33 m), laminations stop and the diatom gyttja becomes distinctly more silty. The beginning of Unit C (23.33–21.50 m) is composed of silty diatom gyttja. Laminations disappear in the diatom gyttja between 22.75–22.25 m. Partly laminated brown gyttja is found above this layer, which is replaced again by a homogenous diatom gyttja. Unit D (21.50–21.00 m) consists of dark brown gyttja with thin yellowish laminae and 1-cm- thick dark bands every 5–10 cm. In the upper part of the unit (21.20–21.00 m), the thin laminae become slightly distorted. In Unit E (21.00–20.73 m), the diatom gyttja is vaguely laminated and slightly reddish. The sediment was disturbed during coring between 20.73–20.50 m and is not considered. Unit F (20.50–19.86 m) has light brown gyttja with less distinct and more sporadic laminations. The laminations disappear with the transition to Unit G (19.86–19.50 m). Instead, this unit consists of darker brown homogeneous gyttja. Unit H (19.50–17.41 m) consists of brown homogeneous gyttja, although dark laminations were observed during coring. In Unit I (17.41–17.33 m), the gyttja once again becomes silty. In Unit J (17.33–17.07 m), the homogeneous brown gyttja is spotted with light yellow granules. Unit K (17.07–16.75 m) shows a gradual transition into a light grey-reddish spotted diatom gyttja. Unit L (16.75–16.58 m) is the last unit consisting of brown homogeneous diatom gyttja. Unit M (16.58–16.00 m) consists of ca. 10-cm-thick layers of brown gyttja with small yellowish spots intercalated with five 2–3-cm-thick layers of homogeneous sand centered on 16.57, 16.47, 16.37, 16.30, and 16.23 m. The gyttja is sandy in the uppermost 20 cm.
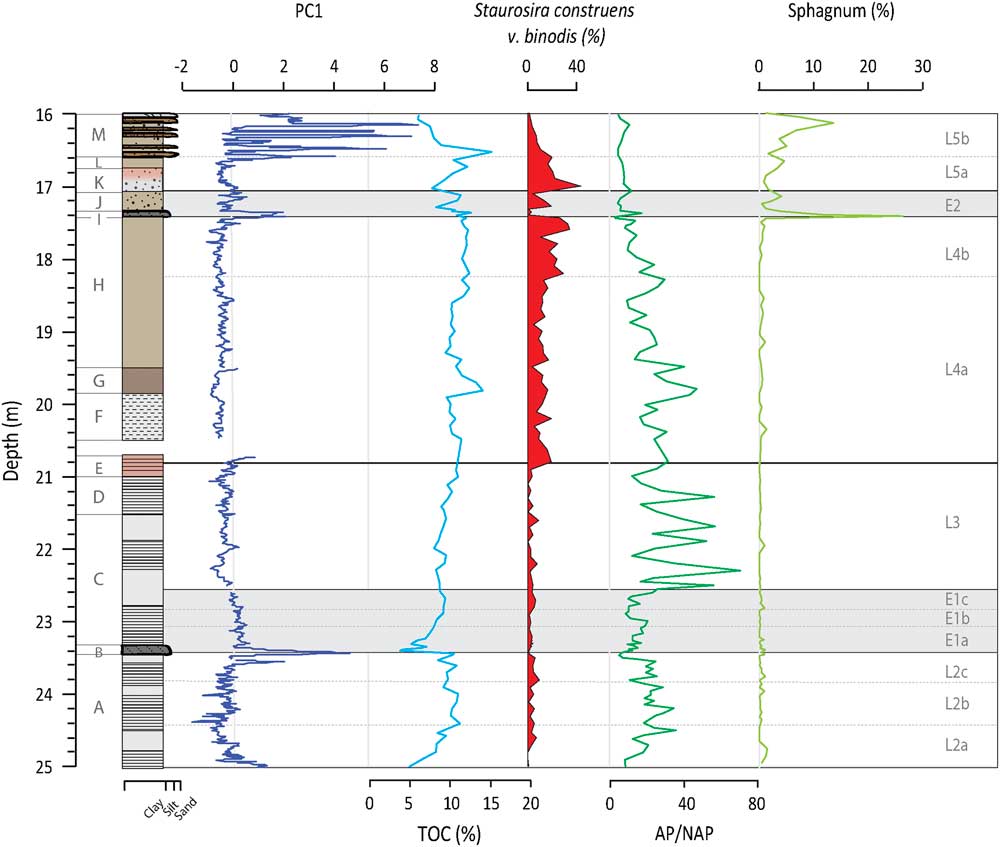
Figure 2 (color onine) Depth profiles of PC1, TOC, S. construens v. binodis, AP/NAP ratios, and Sphagnum pollen percentages. PC1 is representative of minerogenic inputs from sources outside the SCM, while TOC tracks catchment productivity. S. construens v. binodis is used here as an indicator of lake infilling, while AP/NAP tells us about the relative importance of trees versus other species where trees require thicker soils and milder conditions to grow. The presence of Sphagnum is also linked to infilling of the lake. The bracketing glaciofluvial sands and gravel (28.5 and 25 m) and fluvial sands (16 to 13 m) have been dated to>ca. 95 and 110 ka and<ca. 150–180 ka, respectively (Helmens et al., Reference Helmens, Räsänen and Johansson2000, Reference Helmens, Bos, Engels, Van Meerbeeck, Bohncke, Renssen and Heiri2007; Alexanderson et al., Reference Alexanderson, Eskola and Helmens2008).
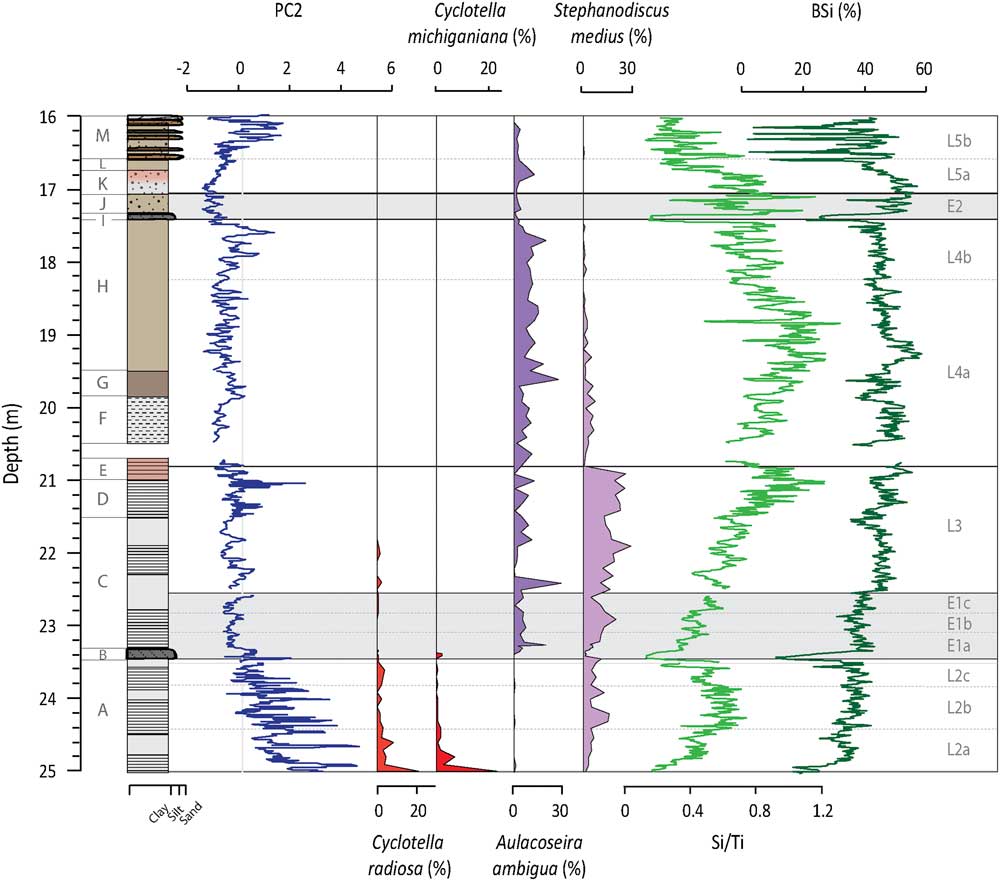
Figure 3 (color online) Depth profiles of PC2, C. radiosa, C. michiganiana, A. ambigua, S. medius, Si/Ti, and BSi. PC2 represents inputs from S, Fe, Mn, and Ca-rich sources within the SCM. Both C. radiosa and C. michiganiana are species that favor deep, warm waters with stable summer stratification. A. ambigua and S. medius require an extended mixing period length and eutrophic and productive conditions. Si/Ti and BSi are indicators of in-lake productivity.

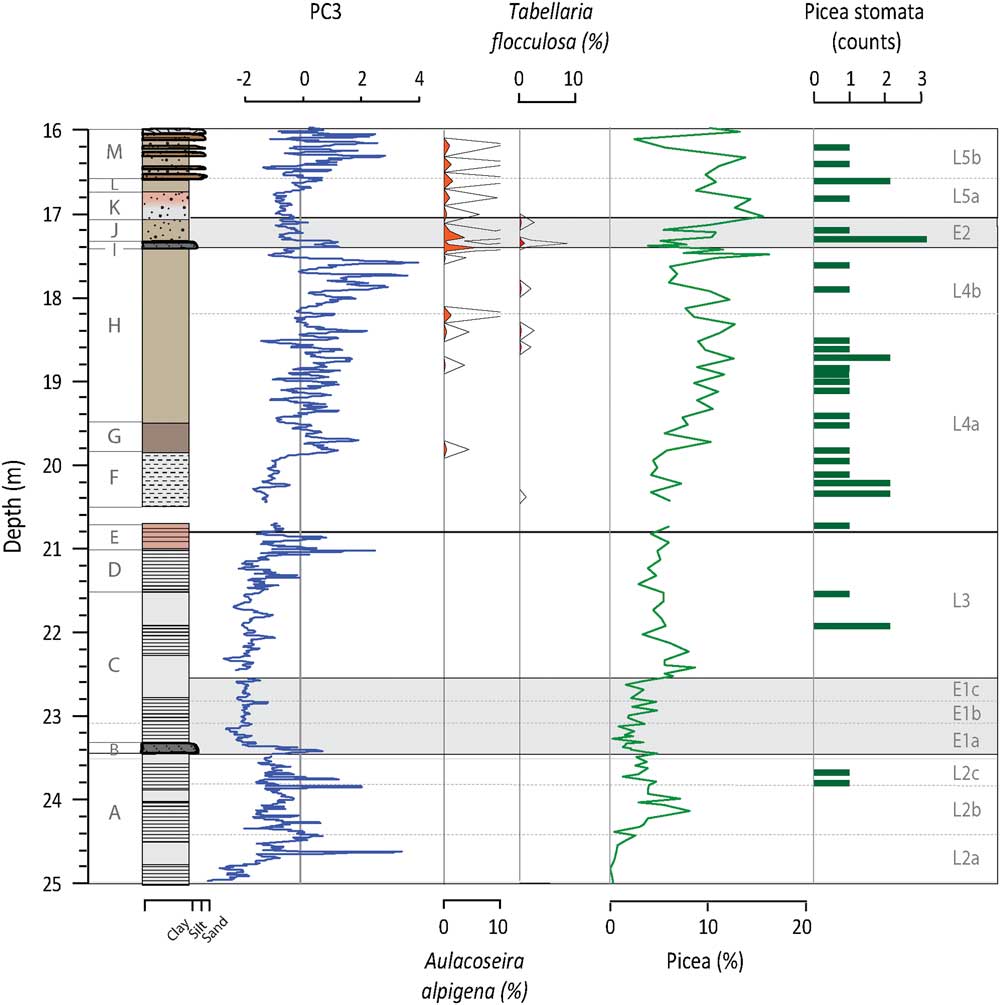
Figure 4 (color online) Depth profiles of PC3, T. flocculosa, A. alpigena, Picea pollen percentages, and Picea stomata. PC3 represents the integrated signal of those processes controlling chemical weathering. Both T. flocculosa and A. alpigena are acidophilic species and are used as indicators of pH trends in the lake. Picea pollen and stomata are used to highlight the increase presence of these acidifying species.
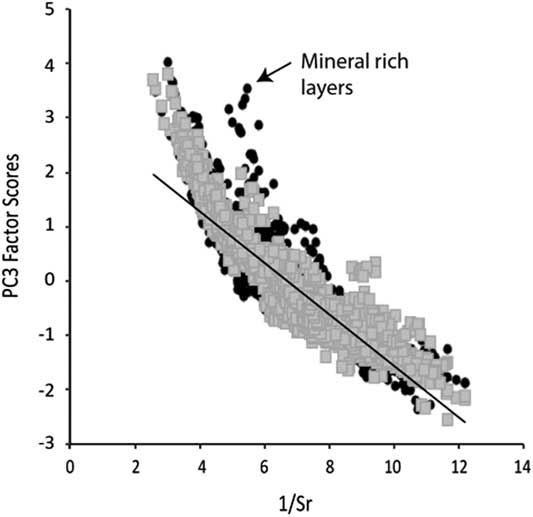
Figure 5 Plot of 1/Sr vs. PC3 where a negative correlation indicates that Sr is the main control on PC3 variability.
XRF core scanning data
In a paleoclimatic context, it is the relative changes in the elemental XRF core scanning profiles, rather than the absolute concentrations, that are of interest. XRF core scanning analyses can be negatively affected by large variations in the matrix (Chawchai et al., Reference Chawchai, Kylander and Chabangborn2016). At Sokli, the studied sediments are mainly composed of gyttja, which reduces the importance of matrix effects on the data. With the aim of reconstructing paleoenvironmental change at Sokli, the acquired data were used in a PCA. The raw data are presented in the Supplementary Information and also can be downloaded from http://bolin.su.se/data/Kylander-2017.
PCA, total organic carbon, and elemental ratios
Three main PC explain 81% of the variance in the data (Table 1). The first component (PC1), explaining 42% of the data, is associated with K, Ti, Rb, Zr, Si, and Ca (Table 2). PC2 explains 26% of the variance in the data and is associated with S, Fe, Ca, and Mn. PC3 explains 13% of the variance in the data and is linked to the behavior of Sr and Ca.
Table 1 Variance explained by each factor.
Table 2 Rotated factor loadings. Shaded data are significant at the α=0.05 level.
The plotting of PC factors scores by depth indicates when the processes described by the PC are more intense (having more positive values) or less intense (having more negative values). PC1 factor scores are slightly elevated at the base of Unit A and then decrease towards the middle of the unit, fluctuating around a value of zero (Fig. 2). PC1 factors scores peak at the end of the unit at 23.55 m. A second peak is observed at the transition to Unit B at 23.41 m in the siltier layer. In Unit C, factor scores decrease slightly from the base but remain just below zero up into Unit H. High positive values are observed in Unit I, again coinciding with a siltier layer. Peaks in PC1 are observed in Unit M, matching with visible sand layers. Although the TOC data are of much lower resolution (n=102 vs. n=2404), PC1 and TOC are significantly negatively correlated (r=-0.57, n=102, P=0.001),
For PC2, the highest and largest amplitude changes in factor scores are found overprinted on an overall decreasing trend in Unit A (Fig. 3). This is capped by a large peak in Unit B. From Unit C through to Unit H, factor scores are slightly negative with occasional positive incursions and the frequency of the shifts generally tightens moving up the profile. The lowest PC2 factor scores of the profile are seen at the boundary of Units J and K, while values increase up into Unit L. Peaks observed in Unit M are slightly out of phase with the sand layers. PC2 is significantly negatively correlated with inferred values of BSi from FTIR-measurements (r=−0.57; n=802; P value<0.001).
In general, PC3 factor scores are negative in Unit A (Fig. 4). PC3 factor scores peak in Unit B, while Unit C initially has the lowest factor scores of the profile. From Unit D through to Unit H, there is a long-term trend towards increasingly positive values. At the top of Unit H, positive values are reached and more prominent peaks are observed. PC3 factor scores increase in Unit I and then decrease in Units J and K; this trend is reversed in Unit L. In Unit M, peaks in PC3 occur for the most part at the same time as the sand layers. PC3 is positively correlated to inferred values of total inorganic carbon (TIC) from FTIR-measurements (r=0.58, n=851, P value<0.001; Rosén et al. Reference Rosén, Vogel, Cunningham, Reuss, Conley and Persson2010).
Si/Ti increases from the base of Unit A but has some of the lowest values seen in the profile at the transition into Unit B (Fig. 4). From this unit upwards, Si/Ti gradually increases, peaking at the top of Unit E. An apparent decrease in Si/Ti occurs in Unit F, followed by a gradual increase until approximately halfway through Unit H. From this point Si/Ti starts a gradual long-term decline that continues to the top of the sequence and is punctuated by low values in Units I and J. Si/Ti and BSi values are significantly correlated (r=0.67, n=802, P<0.001).
DISCUSSION
The Sokli Eemian record has been divided into five main lake phases (L1–L5) based on a number of biotic proxies (Plikk et al., Reference Plikk, Helmens, Fernandez-Fernandez, Kylander, Löwemark, Risberg, Salonen, Väliranta and Weckström2016). Additionally, two abrupt climate change events, E1 (the Tunturi Event) and E2, are distinguished (Helmens et al., Reference Helmens, Salonen, Plikk, Engels, Väliranta, Kylander, Brendryen and Renssen2015). Note that L1 corresponds to the initial phase with glacial lake sedimentation and is not included in this study. We first establish what processes control the sediment geochemistry and then place these into context by comparing with previously published proxy data. Finally, we relate changes in our record to key factors controlling lake ontogeny to understand why Sokli differs from other boreal sites by becoming increasingly eutrophic.
Identifying the processes: interpretation of the PCA and Si/Ti ratios
The purpose of PCA is to reduce the dimensions of a multivariate data set and explain as much variability as possible with a few components (Reimann et al., Reference Reimann, Filzmoser, Garret and Dutter2008), thus enabling the identification of variables (chemical elements in this case) whose behavior is similar and, thereby, likely controlled by the same process. Three PC were extracted and based on the elemental groupings we are able to reconstruct changes in detrital input from outside the SCM (PC1; Fig. 2), detrital input from within the SCM (PC2; Fig. 3), and chemical weathering (PC3; Fig. 4). Si/Ti is used as an indicator of lake productivity (Fig. 4).
PC1 is represented by Zr, Ti, K, Rb, Ca, and Si (Table 1), which are all part of the crystal structure of common minerals (e.g., silicates, feldspars, micas, titanium oxides, zircon, calcite, and apatite) and are therefore transported as detrital material to the lake (Deer et al., Reference Deer, Howie and Zussman1992). This interpretation is supported by the stratigraphy, where high PC1 scores coincide with visible silt and sand layers (Fig. 2). Based on our interpretation of PC2 given below, PC1 is thought to be dominated by materials coming from outside the SCM, or possibly till deposited within the SCM, with periods of higher/lower input indicated by positive/negative factors scores. TOC, which is negatively correlated to PC1, is similarly linked to allogenic inputs from the catchment. When TOC is high, the catchment is more productive with more vegetation available to hold materials in place and reduce erosion, which results in negative PC1 scores.
PC2 is driven by variations in S, Fe, Mn, and Ca (Table 1). The carbonatite rocks of the SCM have relatively high Ca concentrations (6–34%), while some of the later stages of magmatic carbonatite formation resulted in rocks with up to 5% S, as well as higher-than-average Fe and Mn concentrations (Vartiainen, Reference Vartiainen1980). The elements associated with PC2 can be transported to the lake as particulate material bound to minerals, in dissolved form, or bound to organic matter (Holmer and Storkholm, Reference Holmer and Storkholm2001). Peaks in PC2 coincide with laminations in the sediments, suggesting a relation to anoxic conditions (Fig. 3; cf. Plikk et al., Reference Plikk, Helmens, Fernandez-Fernandez, Kylander, Löwemark, Risberg, Salonen, Väliranta and Weckström2016). However, even though Fe, S, Mn, and Ca can all precipitate in the water column after being transported in solution to the lake, they experience very different behavior when it comes to redox conditions (Davison, Reference Davison1993). If changes in redox conditions and the preservation of precipitated Fe- and Mn-hydroxides and oxyhydroxides were the process driving PC2, it would be expected that Fe and Mn would show opposite patterns, with stronger anoxia giving high Fe and low Mn and vice versa (Wetzel, Reference Wetzel2001). Since both elements load positively on PC2, it is unlikely that anoxia is controlling their accumulation in the sediment. Additionally, even if the SCM contains carbonate minerals, the sediment itself contains very low amounts of carbonates (< 0.5% based on FTIR modelled TIC; Rosén et al., Reference Rosén, Vogel, Cunningham, Reuss, Conley and Persson2010) and, hence, Ca is most likely associated with crystalline mineral particles (see below regarding carbonates in association to PC3). Thus, increases/decreases in PC2 factor scores describe greater/lesser inputs of non-carbonaceous detrital material originating from SCM rock types rich in mainly S and Fe, but also Ca and Mn (e.g., phoscorites, micas, and late stage magmatic carbonatites; Vartiainen, Reference Vartiainen1980). This said, there have likely been variations in the redox conditions in the lake during the Eemian, and periods preserving laminations most likely had more anoxic conditions as compared to periods without laminations (cf. Plikk et al., Reference Plikk, Helmens, Fernandez-Fernandez, Kylander, Löwemark, Risberg, Salonen, Väliranta and Weckström2016).
PC3 is associated with Sr and Ca (Table 1). Strontium is hosted in Ca-bearing minerals such as plagioclase, amphibole, pyroxene, and carbonate minerals (Cohen, Reference Cohen2003). It can enter the system detritally or as Sr2+ chemically weathered from the soils and rocks of the catchment. Strontium-rich veins of dolomite carbonatite are only found near the centre of the SCM complex and the surrounding fenites (Lee et al., Reference Lee, Lee, Garcia, Moutte, Williams, Wall and Kim2006). The preferential erosion of these veins to produce Sr- and Ca-rich detrital material seems unrealistic and if this did occur, it would be integrated into PC2. This indicates that Sr and Ca are being washed into the lake in solution. Once in the water column, Sr and Ca are either co-precipitated and/or absorbed onto the surface of organic matter or Fe-Mn oxides, eventually sinking to the bottom of the lake and being buried in the sediments (Cohen, Reference Cohen2003). Given the fact that Fe and Mn do not load on PC3, it is most likely that soluble Ca and Sr are delivered to the sediment through precipitation, although the carbonate concentrations of the sediment are low, and absorption to organic matter. That carbonate precipitation plays a role in Sr and Ca variations and PC3 is verified by the positive correlation between TIC and PC3. Zeng et al. (Reference Zeng, Chen, Xiao and Qi2013) showed that non-residual Sr has a strong positive correlation with chemical weathering and can be used as a proxy for this process. The pattern of chemical weathering itself is controlled by a number of often related, time-variable factors, including: physical erosion and the presence of fresh material, temperature, source mineralogy, precipitation, runoff, soil cover, organic matter, and vegetation (White and Blum, Reference White and Blum1995; Oliva et al., Reference Oliva, Viers and Dupré2003; Riebe et al., Reference Riebe, Kirchner and Finkel2004; West et al., Reference West, Galy and Bickle2005; Mavris et al., Reference Mavris, Egli, Plötze, Blum, Mirabella, Giaccai and Haeberli2010). As such, we stress that PC3 is the integrated expression of several factors related to chemical weathering and the input of soluble Sr and Ca to the lake, with increased/decreased chemical weathering signaled by higher/lower factor scores (Fig. 4).
It should be kept in mind that the PCs model the integrated behavior of several elements based on the variability observed in the entire profile. Therefore, some short-term events observed in the PC factor scores may not capture the true behavior of an element at all times. An inverse correlation should be observed between 1/Sr and PC3 in those samples where Sr is the dominant control on the behavior of PC3 (Fig. 5). This is found to be the case except during periods with higher detrital input (i.e., E1, E2, and sand layers in Unit M). Thus, during periods with higher minerogenic flux (positive PC1 scores), we interpret our chemical weathering proxy with caution.
Bearing in mind the fundamental theory of PCA, the individual PC should also not correlate when considering the whole profile. This does not exclude the possibility, however, that during a given lake phase the PC cannot show some co-variation, as the processes described by the PC may be diminished or enhanced at the same time (Fig. 6, Table 3). PC1 and PC2 correlate little in the different lake phases (with the exception of the negative correlation in L3). This demonstrates that the importance of sources outside the SCM (PC1) and within the SCM (PC2) change over time. This could be a result of changes in: (1) vegetation and linked soil erosion; (2) hydrological pathways; (3) the size of the lake; and (4) energy of the transporting waters. While we do not have grain-size analyses, PC1 increases during the visibly siltier and sandier layers, which would evoke a coarser grain size for those minerals associated with PC1. In most lake phases, PC2 and PC3 are correlated to some degree, which reflects the fact that they are both dominated by sources from within the SCM. PC3 correlates with PC1 and PC2 in E1 and E2. As seen in the plots of 1/Sr vs PC3, the influx of coarse-grained material acts to overprint the chemical weathering signal during these two events.
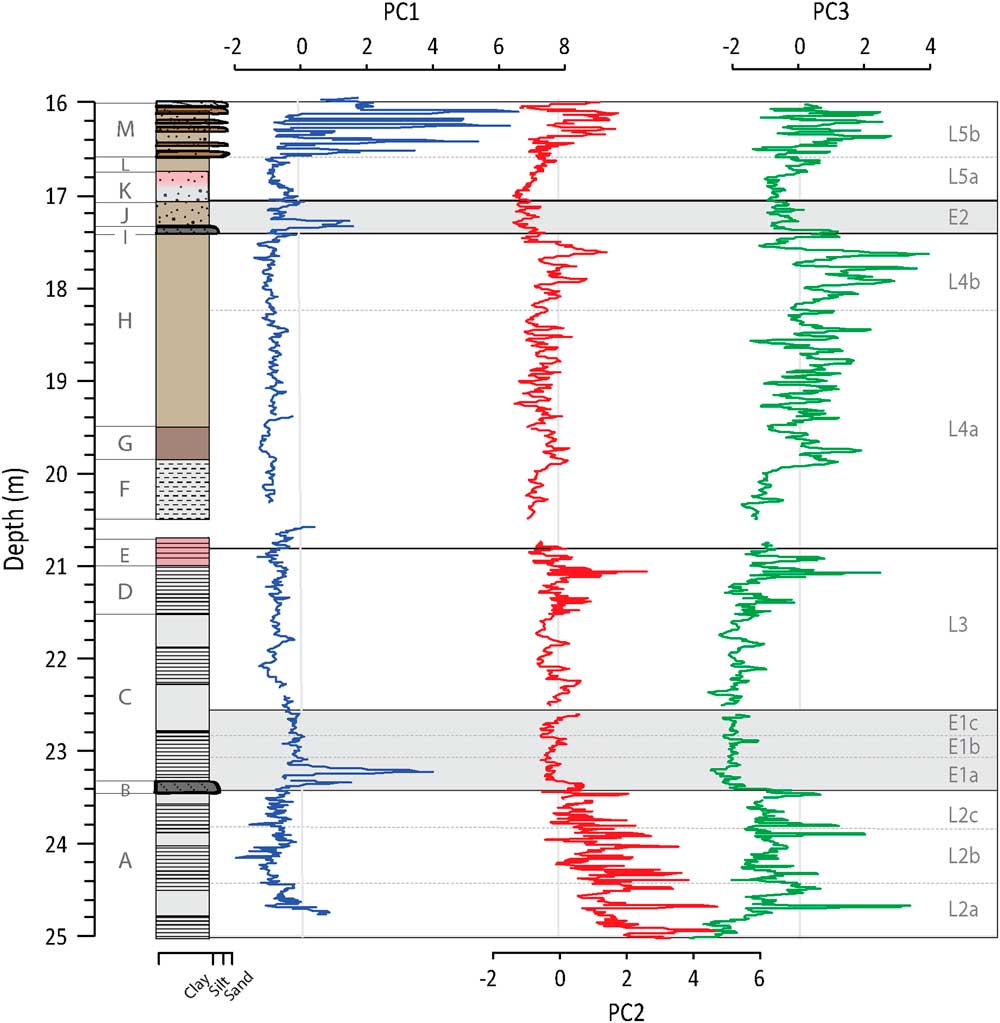
Figure 6 (color online) Depth profiles of PC1, PC2, and PC3 show that the PC co-vary during certain phases of lake development.
Table 3 Correlation coefficients between the PC during different lake phases and events.

Silicon can be hosted in both mineral and biological matrices and can play a dual role in lake systems. In contrast, Ti is hosted by mineral phases. Due to this, increases in the Si/Ti ratio can either indicate increases in biological productivity (i.e., more biogenic Si in the sediment) or, as we are dealing with a ratio, decreased input of Ti to the system. As seen in records elsewhere (e.g., Brown et al., Reference Brown, Johnson, Scholz, Cohen and King2007; Tanaka et al., Reference Tanaka, Akagawa, Yamamoto, Tani, Kawabe and Kawai2007; Minyuk et al., Reference Minyuk, Borkhodoev and Wennrich2014), Si/Ti and BSi curves are correlated even though Si/Ti represents two processes (biological activity and minerogenic input; Fig. 4). In the most obvious cases where the records differ (e.g., 22.20–22.58 m, 21.05–20.98 m, and 19.30–19.05 m), we can assume that it is the increased input of Ti and/or a change in the mineral matter character that is driving the mismatch (Chawchai et al., Reference Chawchai, Kylander and Chabangborn2016). We recognize that the BSi curve is more representative of within-lake biological productivity but compliment these data with Si/Ti ratios, which are higher resolution.
Lake development
Lake Phase 2 (L2), early Eemian lake phase (25.0 to 23.45 m)
PC1 and PC2 factor scores suggest that relatively higher minerogenic inputs occur during L2a as compared to L2b (Fig. 2 and 3). In that the area was recently deglaciated, this decreasing minerogenic input signals the stabilization of the catchment in the form of soil development (Kylander et al., Reference Kylander, Klaminder, Wohlfarth and Löwemark2013). This is confirmed by the colonization of the area by open subarctic birch, Pinus, and Juniperus (L2a) and its gradual replacement by interglacial boreal forest with Picea (L2b). The ratio of Arboreal to Non-Arboreal Pollen (AP/NAP) indicates increasing forest cover density from L2a to L2b (Fig. 2; Helmens et al., Reference Helmens, Salonen, Plikk, Engels, Väliranta, Kylander, Brendryen and Renssen2015).
Much of L2 is characterized by laminations, reflecting a regularly anoxic hypolimnion and a stably stratified lake (Renberg, Reference Renberg1981). The diatom assemblages present at this time describe short mixing periods and potentially strong seasonality with long, cold winters and short, warm summers (Plikk et al., Reference Plikk, Helmens, Fernandez-Fernandez, Kylander, Löwemark, Risberg, Salonen, Väliranta and Weckström2016). Of special note in L2 is the presence of Cyclotella radiosa (Grun.) Lemmermann and Cyclotella michiganiana Skvortz (Fig. 3), an oligo-mesotrophic taxa that favors deep, warm waters and stable summer stratification (Stoermer, Reference Stoermer1993; Wolin, Reference Wolin1996). The diatom community also indicates that nutrient levels were initially low (L2a) but gradually rose creating a more eutrophic system (L2b; Plikk et al., Reference Plikk, Helmens, Fernandez-Fernandez, Kylander, Löwemark, Risberg, Salonen, Väliranta and Weckström2016), with BSi and Si/Ti values similarly showing increasing productivity (Fig. 3). Soil development, as evoked by the increases in TOC and AP/NAP (Fig. 2) and the leaching of base cations from the unconsolidated glacial materials and the surrounding bedrock after deglaciation, could explain the moderate but still variable behavior of PC3 during this lake phase (Fig. 4); this would help raise lake nutrient levels.
During L2c, minerogenic inputs start to increase again, which, given the decrease in AP/NAP, can be linked to a vegetation shift (Fig. 2 and 3). The lake flora imply increasingly cold and dynamic conditions and a slight decrease in trophic status (Plikk et al., Reference Plikk, Helmens, Fernandez-Fernandez, Kylander, Löwemark, Risberg, Salonen, Väliranta and Weckström2016). Si/Ti values decrease marginally during L2c, likely because of the increased minerogenic inputs and cooler conditions (Fig. 3). BSi has perhaps a small, but unremarkable, decrease. A very slight decrease in PC3 and chemical weathering occurs, which could have contributed to the change in trophic status (Fig. 4).
Event 1 (E1), Tunturi Event (23.45 to 22.55 m)
The Tunturi Event is clearly seen in the Sokli record, signaled by the siltier layer at the beginning of E1a. PC1 and PC2 show a double peak just prior to and after the boundary to Unit B (Fig. 2 and 3). The increase in erosional input is in response to reduced catchment productivity (i.e., TOC), the replacement of the soil-protecting mixed boreal forest by an open subarctic birch-dominated woodland (i.e., decrease in AP/NAP), and a temperature drop of 2–4°C (Helmens et al., Reference Helmens, Salonen, Plikk, Engels, Väliranta, Kylander, Brendryen and Renssen2015). The instability of the soil cover is confirmed by the increase in fossil pollen of Juniperus and Hippophaë rhamnoides, which can cope with such conditions. Aquatic proxy indicators evidence prolonged ice cover as verified by minor increases in Fragilaria (mainly Pseudostaurosira brevistriata (Grun.) Williams and Round, Pseudostaurosira pseudoconstruens Marciniak and Staurosira venter (Grun.) Williams and Round; Lotter and Bigler, Reference Lotter and Bigler2000), lowered lake levels and drier conditions, intense mixing, and an earlier breakdown of thermal summer stratification (Plikk et al., Reference Plikk, Helmens, Fernandez-Fernandez, Kylander, Löwemark, Risberg, Salonen, Väliranta and Weckström2016). The significant increase in minerogenic input during E1a overprints PC3 and the chemical weathering signal (Fig. 4 and 5) and affects biological signals, either directly by reducing productivity through increased turbidity or indirectly by diluting BSi in the sediment (Fig. 3).
PC1 and PC2 factor scores recover by E1b and slowly decrease in E1c, indicating recovery of the catchment soils (Fig. 2 and 3); a mirror change is observed in TOC and AP/NAP ratios. Increasing biological productivity within the lake is argued by changes in the Si/Ti and BSi data (Fig. 3). Laminated sediments return but the stratification, and perhaps the seasonality, is not as extreme as that seen in L2 since diatoms indicating an extended mixing period length are present (e.g., Aulacoseira ambigua [Grun.] Simonsen and Stephanodiscus medius Håkansson; Fig. 3). PC3 is low and stable after E1a with reduced chemical weathering in the catchment, possibly as an effect of the inferred dry conditions of the time (Fig. 4; Plikk et al., Reference Plikk, Helmens, Fernandez-Fernandez, Kylander, Löwemark, Risberg, Salonen, Väliranta and Weckström2016).
Laminations disappear in E1c, indicating there was mixing of bottom waters. Productivity continues to increase during E1c (Fig. 3). In examining the elemental data, this sub-event appears rather uneventful in terms of detrital input and chemical weathering. This is curious, as the biological data from both within the lake (i.e., diatoms and chironomids) and the catchment (i.e., pollen) show that E1c is a period of minor cooling (Helmens et al., Reference Helmens, Salonen, Plikk, Engels, Väliranta, Kylander, Brendryen and Renssen2015). It is possible that the hydrological conditions did not vary much between E1b and E1c (all affecting the processes described by the elemental data), while the temperature did.
Lake Phase 3, early mid-Eemian lake phase (22.55 to 20.85 m)
The factor scores for PC1 and PC2 generally remain just below zero during L3 (Fig. 2 and 3). The observed stability is expected considering the return to interglacial conditions, with July temperatures an estimated 3°C warmer than present-day, and the presence of arboreal-rich vegetation (i.e., increase in AP/NAP; Helmens et al., Reference Helmens, Salonen, Plikk, Engels, Väliranta, Kylander, Brendryen and Renssen2015). There are, again, visible laminations in L3 indicating oxygen deficient conditions in the hypolimnion. The increased productivity, as inferred by Si/Ti and BSi, may have been enhanced by chemical weathering in the catchment (increase in PC3, Fig. 4) and subsequent nutrient addition to the lake, which shows meso-eutrophic and eutrophic species inhabiting the lake (e.g., Stephanodiscus spp. and A. ambigua; Fig. 3). Additionally, these species are likely favored by an enhanced internal loading of nutrients (especially P) during this phase, as Fe-bound P that is released and accumulated in the anoxic hypolimnion during the summer stratification is circulated back into the water column during the mixing periods (Bradbury and Dieterich-Rurup, Reference Bradbury and Dieterich-Rurup1993; Wetzel, Reference Wetzel2001; Plikk et al., Reference Plikk, Helmens, Fernandez-Fernandez, Kylander, Löwemark, Risberg, Salonen, Väliranta and Weckström2016).
Lake Phase 4 (L4), late mid-Eemian (20.85 to 17.43 m)
During L4, the continued high interglacial temperatures that began in L3 are maintained. It is during L4 that visible laminations disappear, signifying a significant change in the lake system. PC1 and PC2 indicate that minerogenic material input decreases slightly at the start of L4a but thereafter remains rather steady during L4 (Fig. 2 and 3). This would imply that the catchment is stable, which is supported by continued relatively high AP/NAP ratio (Helmens et al., Reference Helmens, Salonen, Plikk, Engels, Väliranta, Kylander, Brendryen and Renssen2015).
In L4, the long-term lake infilling that started after deglaciation appears to cross a key depth threshold. There are several indications of lower lake levels, increased mixing, and reduced bottom water anoxia. For example, there is change from weak laminations (Unit F) to no visible laminations (Unit G). The aquatic assemblages increase in benthic diatoms and littoral green algae evoking lake shallowing (Plikk et al., Reference Plikk, Helmens, Fernandez-Fernandez, Kylander, Löwemark, Risberg, Salonen, Väliranta and Weckström2016), e.g., Staurosira construens v. binodis (Ehrenb.) Hamilton that prefers shallow, macrophyte-rich, eutrophic lakes (Fig. 2; Bradbury and Winter, Reference Bradbury and Winter1976). The increase in A. ambigua, a species often found in shallow lakes and near-shore areas of deep lakes and which requires high levels of turbulence and light to prosper (Bradbury and Dieterich-Rurup, Reference Bradbury and Dieterich-Rurup1993), also validates the idea that the lake in L4 is shallow and well mixed (Fig. 3). This lake phase also sees the highest values in the productivity indicators Si/Ti and BSi, particularly in L4a.
L4 is also distinct in that PC3 shows gradually increasing positive values over several meters of accumulation (Fig. 4). At this time, acidophilous diatoms such as Aulacoseira alpigena (Grun.) Krammer and Tabellaria flocculosa (Roth.) Kütz. appear in low amounts (Van Dam et al., Reference Van Dam, Mertens and Sinkeldam1994), indicating a slight decrease in the pH of the lake waters (Fig. 4). The on-going development of soils would increase the production of SOM and DOC, promoting acid conditions (Pienitz et al., Reference Pienitz, Smol and MacDonald1999; Engstrom et al., Reference Engstrom, Fritz, Almendinger and Juggins2000; Fritz et al., Reference Fritz, Engstrom and Juggins2004). Within the catchment there is an increase in coniferous tree species like Picea in the mixed boreal forest; this leads to increased DOC transport from the catchment soils as compared to deciduous vegetation (Van Nevel, Reference Van Nevel, Mertens, De Schrijver, Baeten, De Neve, Tack, Meers and Verheyen2013). The increase in pollen of several floating leaved macrophytes such as Nuphar spp. and unidentified Nymphaceae, especially in L4b, attests to decreasing transparency associated with increasing DOC in the lake (Plikk et al., Reference Plikk, Helmens, Fernandez-Fernandez, Kylander, Löwemark, Risberg, Salonen, Väliranta and Weckström2016). The increasing chemical weathering, however, appears to offset significant acidification, as there is continued presence of species found in near-shore areas of eutrophic lakes (e.g., S. parvus, Fragilaria capucina v. mesolepta [Rabenh] Rabenh. and Cyclostephanos invisitatus Theriot, Stoermer and Håkansson comb. Nov.) (Plikk et al., Reference Plikk, Helmens, Fernandez-Fernandez, Kylander, Löwemark, Risberg, Salonen, Väliranta and Weckström2016).
Event 2 (E2; 17.43 to 17.05 m)
E2 clearly mimics E1 and evidences another significant climate perturbation with cool conditions (Helmens et al., Reference Helmens, Salonen, Plikk, Engels, Väliranta, Kylander, Brendryen and Renssen2015) and a sharp influx of minerogenic material early in E2 (i.e., PC1 and PC3 increase; Fig. 2 and 4). Decreases in TOC (Fig. 2), Si/Ti, and BSi (Fig. 3) may signal a decrease in biological productivity in both the lake and the catchment, but dilution by minerogenic influx is also again possible. The main difference between E2 and E1 lays in the fact that, during the latter event, the lake is much shallower due to progressive infilling. The increase in diatom species that thrive in subaerial conditions and rivers, as well as an increase in Sphagnum spores and unidentified terrestrial plant remains, suggests decreased lake levels (Fig. 2; Väliranta, Reference Väliranta2006; Plikk et al., Reference Plikk, Helmens, Fernandez-Fernandez, Kylander, Löwemark, Risberg, Salonen, Väliranta and Weckström2016).
After this seemingly abrupt event the system seems to recover again with PC1, PC3, TOC, BSi, and Si/Ti going back to pre-event levels indicating more productive conditions and moderate chemical weathering (Fig. 2–4). The sediment at this time is characterized by light yellow spots, which might be related to subaerial exposure or bottom freezing, and planktonic diatoms almost completely disappear (Plikk et al., Reference Plikk, Helmens, Fernandez-Fernandez, Kylander, Löwemark, Risberg, Salonen, Väliranta and Weckström2016).
Lake Phase 5 (17.05–16.00 m)
Early in this lake phase, PC1 and PC2 indicate that minerogenic inputs are rather constant in L5a despite low AP/NAP ratios (Fig. 2 and 3). Likewise, PC3 is low at this time (Fig. 4). This may be related to infilling and the expansion of Sphagnum in the area, which acts to filter incoming sediment when lake levels are low. TOC levels also increase suggesting a vegetated catchment. While diatoms indicate increased lake levels compared to E2, the presence of diatoms common to acidic (e.g., A. alpigena) and shallow telmatic conditions (e.g., S. construens v. binodis) corroborates this continued infilling (Plikk et al., Reference Plikk, Helmens, Fernandez-Fernandez, Kylander, Löwemark, Risberg, Salonen, Väliranta and Weckström2016; Fig. 2 and 4). Productivity is initially high but starts to decline leading up to the start of L5b (Fig. 3). In these conditions there appears to be available oxygen and high mixing, as shown by a peak in A. ambigua.
In L5b, the stratigraphy, PC1, PC2, and PC3 have a distinct pattern representing an unstable environment with the in-wash of silt and sand in flood-type events (Fig. 2). The general instability of L5b is verified by the increased presence of the diatoms S. venter and S. pinnata, which can tolerate rapidly changing environments and are often found in shallow waters with sandy substrates (Haworth, Reference Haworth1976; Jones and Birks, Reference Jones and Birks2004). Sphagnum grows in importance as infilling proceeds (Fig. 2). The diatom flora move towards those species found in subarctic/arctic lakes (e.g., Staurosirella lapponica [Grun.] Williams and Round, S. venter, and S. pinnata) and Betula becomes more abundant in the pollen data, indicating a move towards cool conditions (Plikk et al., Reference Plikk, Helmens, Fernandez-Fernandez, Kylander, Löwemark, Risberg, Salonen, Väliranta and Weckström2016).
Postglacial boreal lake ontogeny
Lakes in northern boreal regions are commonly shallow, extremely dilute, clear, and oligotrophic (e.g., for Fennoscandinavia and the Kola Peninsula; see Korhola and Weckström, Reference Korhola and Weckström2004). Paleoclimate records reconstructed from late-glacial and Holocene lake sediments in these regions integrate both climate as well as natural lake ontogeny, which often see the long-term postglacial oligotrophication of the lake (Ford, Reference Ford1990; Pienitz et al., Reference Pienitz, Smol and MacDonald1999; Engstrom et al., Reference Engstrom, Fritz, Almendinger and Juggins2000; Fritz et al., Reference Fritz, Engstrom and Juggins2004; Boyle, Reference Boyle2007; Fritz and Anderson, Reference Fritz and Anderson2013; Law et al., Reference Law, Anderson and McGowan2015). As is common in the early phase of postglacial lake evolution elsewhere (e.g., Korhola and Weckström, Reference Korhola and Weckström2004; Kylander et al., Reference Kylander, Ampel and Wohlfarth2011), Sokli sees an initial period of high minerogenic input that is curbed by the development of catchment soils and colonizing vegetation. In L2a, oligo-mesotrophic diatom species are already present and, with the exception of during E1 and E2, Sokli follows a trajectory towards meso-eutrophic conditions, a productive lake, and gradual infilling of the basin. Clearly, Sokli follows a path of long-term eutrophication rather than oligotrophication.
A number of abiotic and biotic processes are thought to drive postglacial oligotrophication of lakes. The high alkalinity and productivity observed within the first few millennia after deglaciation are linked to (1) primary succession and species immigration and (2) leaching of cations from soils and bedrock (Fritz and Anderson, Reference Fritz and Anderson2013). At Sokli there are shrubs (i.e., low AP/NAP), Betula, and Alnus present after deglaciation, followed by the arrival of Pinus and Picea and an increasing proportion of trees. This vegetation succession is rather typical of postglacial landscapes in Fennoscandinavia (Donner, Reference Donner1995) and does not seem to explain why Sokli becomes increasingly eutrophic over time. The early presence of Alnus at Sokli could be important given its role in N fixation and supply of nutrients to the catchment (Fritz et al., Reference Fritz, Engstrom and Juggins2004; Engstrom and Fritz, Reference Engstrom and Fritz2006). Alnus is continuously present throughout the Eemian record at Sokli but this should be interpreted with caution, given the fact that Alnus is an abundant pollen producer (Bradshaw, Reference Bradshaw1981), which can be overrepresented in pollen data when locally present (Tinsley and Smith, Reference Tinsley and Smith1974). Catchment and soil weathering, particularly within the base cation- and P-rich SCM (Talvitie et al., Reference Talvitie, Lehmuspelto and Vuotovesi1981), would maintain both the alkalinity and nutrient supply to the lake, rather than it being exhausted as seen in typical granitic and gneissic landscapes (Fritz and Anderson, Reference Fritz and Anderson2013). Several studies suggest that this climate-independent, abiotic edaphic process is a more important control on lake ontogeny than biological processes (Boyle, Reference Boyle2007; Law et al., Reference Law, Anderson and McGowan2015) and the lake evolution at Sokli would seem to lend support to this.
The vegetative succession and the (3) accumulation of SOM and increased DOC input was also interrupted at Sokli during E1 and E2, when conditions are glacial-like with high minerogenic inputs, low temperature, increased Betula, Juniper, and shrubs. This could potentially alter the trajectory of the lake with the external climate signals overriding lake ontogeny processes.
Finally, (4) hardpan formation and the expansion of wetlands can inhibit leaching of base cations and the maintenance of alkalinity (Engstrom et al., Reference Engstrom, Fritz, Almendinger and Juggins2000; Fritz and Anderson, Reference Fritz and Anderson2013). While we are not able to say much in regard to ground water input, Sphagnum percentages indicate the development of wetlands only late in the Sokli sequence.
CONCLUSIONS
The long-term oligotrophication normally seen in postglacial boreal lakes is not observed at Sokli; reasons for this unusual behavior were explored using the elemental geochemistry of the lake sediments. Lake sediment geochemistry is controlled by a number of integrated factors, including the geological setting, lake and catchment development, and climate variability. Three main processes controlling the sediment geochemistry at Sokli were identified: (1) detrital input from sources dominantly beyond the SCM; (2) detrital input from sources dominantly within the SCM; and (3) chemical weathering. In general, the lake evolution was characterized by stable minerogenic inputs with varying importance of sources from both outside and inside the SCM over time. These inputs contributed to the long-term infilling of the lake. Chemical weathering increased over the span of the Eemian record at Sokli. The SCM provided an abundant and continual supply of base cations and nutrients, which helped to maintain a relatively alkaline and increasingly eutrophic lake. The highest levels of chemical weathering occurred during L3 and L4, when temperatures were higher than present-day and there was increased presence of acidic Picea and slightly higher catchment productivity (TOC). Trends in the processes described above were interrupted during both E1 and E2, however, which saw the influx of significant amounts of detrital material, overwhelming the geochemical signals. At Sokli it appears that the forcing from abiotic edaphic process and climate override the typical postglacial oligotrophication normally seen in boreal lakes.
ACKNOWLEDGMENTS
We gratefully acknowledge the Geological Survey of Finland for field and coring assistance. This study was funded by the Swedish Nuclear Fuel and Waste Management Company (SKB) and the Bolin Centre for Climate Research at Stockholm University. Additional funding was provided by Stiftelsen Längmanska kulturfonden, Academy of Finland (Project No. 278692) and the Finnish Cultural Foundation. MEK dedicates this article to her father and the staff at the Virginia Commonwealth University.
Supplementary Material
To view supplementary material for this article, please visit https://doi.org/10.1017/qua.2017.84