1. Introduction
Every book or paper written in the last 60 years that describes the eruptive history of Vesuvius deals with its last eruption, which occurred in March 1944, during the liberation of the Neapolitan area by the Anglo-American Allies (e.g. Imbò, Reference Imbò1945; Santacroce, Reference Santacroce1987; Cioni et al. Reference Cioni, Bertagnini, Santacroce and Andronico2008). Most of the volcanological descriptions of the 1944 event were provided by Giuseppe Imbò, director of the Osservatorio Vesuviano, who remained at the Observatory on the slopes of the volcano and vividly described the course of the eruption (Imbò, Reference Imbò1945, Reference Imbò1949a). He defined the successive phases of the eruption as: ‘effusive’, ‘lava fountains’, ‘mixed explosions’ (alternating lava fountains and sustained column) and ‘seismic-explosive’ (discontinuous explosions alternating with earthquakes). Imbò was a direct witness to those events and consequently his evaluations have been adopted in all the following volcanological literature (e.g. Santacroce, Reference Santacroce1987; Marianelli, Métrich & Sbrana, Reference Marianelli, Métrich and Sbrana1999; Scandone, Iannone & Mastrolorenzo, Reference Scandone, Iannone and Mastrolorenzo1986; Mastrolorenzo, Munno & Rolandi, Reference Rolandi, Mastrolorenzo, Barrella and Borrelli1993; Hazlett et al. Reference Hazlett, Buesch, Anderson, Elan and Scandone1991; Cubellis & Luongo, Reference Cubellis and Luongo1997; Fulignati et al. Reference Fulignati, Marianelli, Métrich, Santacroce and Sbrana2004).
In this paper we make a full volcanological reconstruction of the 1944 eruption of Vesuvius, based on information gathered from many different contemporary sources and also based on a field evidence approach. We fully consider Imbò's descriptions and models (Imbò, Reference Imbò1945, Reference Imbò1949a) and integrate these with other sources (e.g. Parascandola, Reference Parascandola1945), which better constrain several aspects of this important eruption. Furthermore, we propose a new model for the evolution of this eruption on the basis of our new volcanological data. This paper highlights the magnitude of the event, and using contemporary sources together with field stratigraphy, reconstructs the distribution of the products and the eruption phases, and documents the dynamics of the eruptive column and the emplacement of the different units across a highly populated area. Our work on the explosive phase suggests that there has been an underestimation of the intensity of the 1944 eruption by the contemporary workers and successive volcanologists who considered it a ‘minor’ eruption of Vesuvius (e.g. Imbò, Reference Imbò1945; Santacroce, Reference Santacroce1987; Cioni et al. Reference Cioni, Bertagnini, Santacroce and Andronico2008; Neri et al. Reference Neri, Aspinall, Cioni, Bertagnini, Baxter, Zuccaro, Andronico, Barsotti, Cole, Esposti Ongaro, Hincks, Macedonio, Papale, Rosi, Santacroce and Woo2008). These historical and volcanological data allow a clearer picture of the hazards associated with this eruption.
1.a. Eruptive events before the 1944 eruption
Between 1631 and 1944, Vesuvius was characterized by an alternation between eruptive periods (ranging from 17 months to 31 years) when there was almost continuous activity, and times of dormancy (Imbò, Reference Imbò1945). Several eruptive cycles involved near-continuous effusive to mild strombolian activity and culminated in a paroxysmal, violent strombolian event, termed a ‘final eruption’ (Mercalli, Reference Mercalli1883; Alfano & Friedlander, Reference Alfano and Friedlaender1929; Imbò, Reference Imbò1949a). The 1872–1906 period was a typical cycle characterized by prevalent effusive activity and was terminated by the April 1906 explosive eruption (Mercalli, Reference Mercalli1906; Johnston-Lavis, Reference Johnston-Lavis1909; Perret, Reference Perret1924; Mastrolorenzo, Munno & Rolandi, Reference Rolandi, Mastrolorenzo, Barrella and Borrelli1993; Arrighi, Principe & Rosi, Reference Arrighi, Principe and Rosi2001). Forty-five effusive to weak explosive events (Imbò, Reference Imbò1949a) were observed during the last eruptive cycle of Vesuvius between 1913 and 1944, which was terminated by the March 1944 eruption. The main explosive phases of the 1944 eruption were classified by contemporary volcanologists (Imbò, Reference Imbò1945, Reference Imbò1949a; Parascandola, Reference Parascandola1945) as strombolian and vulcanian, and are discussed in detail below.
1.b. The historical record
The eruption of 1944 has been described by different contemporary sources: local newspapers, reports of the Allied Control Commission (Bentley & Gregory, Reference Bentley and Gregory1944) and scientists of the Osservatorio Vesuviano (Imbò, Reference Imbò1945, Reference Imbò1946, Reference Imbò1947, Reference Imbò1949a,Reference Imbòb,Reference Imbòc), the University of Naples (Casertano, Reference Casertano1949; Parascandola, Reference Parascandola1945, Reference Parascandola1948; Scherillo, Reference Scherillo1949, Reference Scherillo1953) or other local institutions (Iovene, Reference Iovene1946; Lazzari, Reference Lazzari1948). We illustrate below the evidence from the different sources.
2. Contemporary accounts
2.a. The state of Vesuvius before the eruption
This section is a synthesis of two papers that summarize the eruptive history of the March 1944 Vesuvius eruption: Imbò (Reference Imbò1949a), who describes the eruptive phases, and Parascandola (Reference Parascandola1945), who describes the sequence of tephra accumulation in the towns of S. Giuseppe Vesuviano, Poggiomarino, Pompei, Angri, Cava di Tirreni and Torre del Greco (Fig. 1). For the first two towns the chronicle is quite continuous, while for the others more sporadic information is provided. When we refer to other sources their contribution is explicitly reported. A descriptive narrative is given, along with an abbreviated chronology that summarizes the events (Fig. 2).
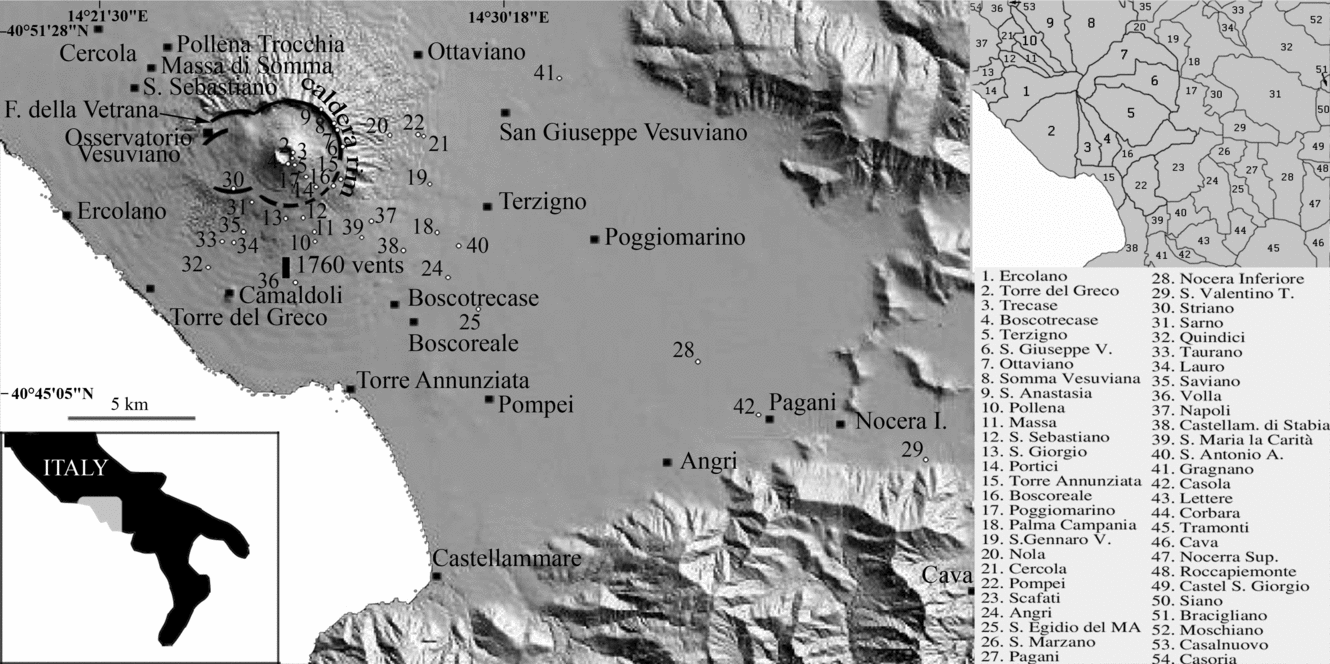
Figure 1. Location of the towns afflicted by the 1944 Vesuvius eruption, superimposed on a shaded relief image of the Digital Terrain Model of the Campanian Plain (DEM from Vilardo et al. Reference Vilardo, Terranova, Bronzino, Giordano, Ventura, Alessio, Gabriele, Mainolfi, Pagliuca and Veneruso2001). The Somma-Vesuvius caldera rim is also shown. Dots represent locations of measured sections. On the right are reported the boundaries of the towns at risk.

Figure 2. Chronogram of the main eruptive phases (top) and the emplacement of the relative pyroclastics products in different proximal and distal locations (bottom, data from Parascandola, Reference Parascandola1945; Imbò, Reference Imbò1949a; Lazzari, Reference Lazzari1948; J. V. Stephens, unpub. data). For each town the distance in kilometres from the Vesuvius crater is indicated.
As a result of the 1906 eruption, a 500 m deep crater was formed. This 80 million cubic metre crater was partially filled by successive lava flows starting in July 1913 (Fig. 3a). Immediately prior to the 1944 eruption, the 1906 crater was nearly completely filled. Only the eastern sector of the crater had not been inundated by lavas and a small cone was present (Figs 3b, 4a). Partial collapse of this cone occurred during the night between 12 and 13 March 1944. The conduit was opened by weak explosive activity on 14 March and then was completely obstructed by a new collapse on the morning of 18 March.
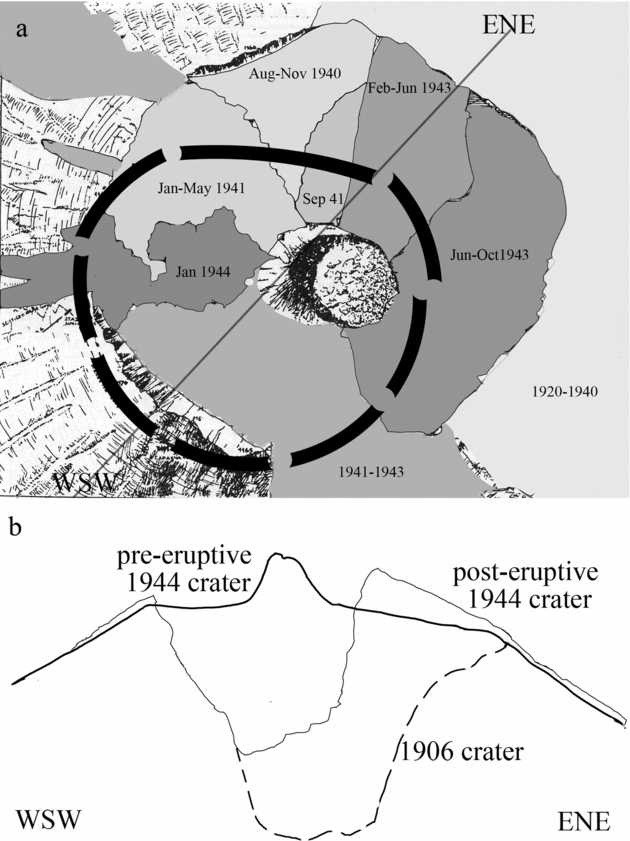
Figure 3. (a) Geological map of the summit of Vesuvius representing before the 1944 eruption (modified after Imbò, Reference Imbò1949a,Reference Imbòb); (b) profile of the Vesuvius cone after the 1906 and the 1944 eruptions (modified after Malladra, Reference Malladra1912, Reference Malladra1914, Reference Malladra1922; Imbò, Reference Imbò1949a).

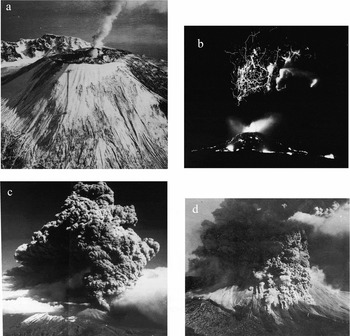
Figure 4. (a) Vesuvius in February 1944, a few weeks before the eruption. The crater is filled by lavas and a small conelet indicates minor explosive activity. (b) Lightning in the eruptive column; evening of Wednesday, 22 March, 1944. (c) The eruptive column reaches 5 km; Friday, 24 March, 1944. (d) Nuées ardentes along the slopes of Vesuvius; Friday, 24 March, 1944 (all photographs are from Imbò, Reference Imbò1949a).
2.b. Phase 1: effusive phase (Imbò, Reference Imbò1945)
The eruption began at 16.30 hrs on 18 March. The small cone inside the crater was partially destroyed and reconstructed several times. Lava filled the crater and moved in different directions.
The whole crater floor was covered by several metres of lava. Two main lava flows moved towards the N and SSE, reaching respectively the Somma caldera wall and the 1760 vents. The estimated velocity of the northern lava was less than 10 m/hr. On 19 March at 11.00 hrs the northern flow reached the Fossa della Vetrana, and at the summit an increase in explosive activity was observed with lapilli and scoria thrown up to 150 m above the crater rim by mild strombolian activity. This type of explosive activity persisted with some variation in intensity until the morning of 21 March.
On Monday 20 March there were three different lava flows issuing from the crater, one of which threatened the town of S. Sebastiano al Vesuvio. The lava flow front near S. Sebastiano was 200 m wide and moved south at a velocity of 3–4 m/min. (Il Risorgimento, 1944a), although there were indications that the lava flow rate varied during this phase of the eruption. The northern lava flow reached the villages of San Sebastiano and Massa in the first hours of 21 March and two-thirds of each of these villages were inundated in that same day. At the end of this phase, lavas covered an area of 3 × 10⁶ m2 and, with an average thickness of 7 m, had a volume of 21 million cubic metres. A lava flow rate of 2 × 10⁵ m3/hr and a flow velocity ranging between 50 and 100 m/hr or 300 m/hr (Imbò, Reference Imbò1949a) was estimated for the afternoon of 21 March.
2.c. Phase 2: lava fountaining
Starting at 17.15 hrs on 21 March, ‘magmatic columns’, up to 1 km high, generated fragments of lavas (spatter) and scoria that accumulated in a restricted area around the crater. The still-molten spatter agglutinated and locally flowed downslope. Following this change in eruptive style, the lava supply to the main flows was cut and they rapidly came to a halt. Due to the eccentric location of the eruptive vent in the SW sector of the crater, most of the pyroclastic material accumulated on the eastern side, while on the western slope it failed to accumulate and slid down the outer flanks; some of these correspond to the ‘Avalanches’ described by Hazlett et al. (Reference Hazlett, Buesch, Anderson, Elan and Scandone1991).
Eight successive lava fountains were formed, with timing as follows:
I – fountain starts at 17.15 and ends at 17.45
II – fountain starts at 20.10 and ends at 20.30
III – fountain starts at 22.00 and ends at 22.25
IV – fountain starts at 01.40 and ends at 02.10 (22 March)
V – fountain starts at 03.45 and ends at 04.03
VI – fountain starts at 05.35 and ends at 06.15
VII – fountain starts at 06.30 and ends at 07.05
VIII – fountain starts at 07.30 and ends before 12.40
During the final phase of each fountain, an acoustic wave, accompanied by a light arc, was observed from the Osservatorio Vesuviano. Scoriaceous lapilli erupted during this phase reached progressively higher altitudes and were dispersed toward the east and southeast. At S. Giuseppe Vesuviano beginning at 02.00 hrs (22 March), fine lapilli started to fall, and increased in size with fragments up to 15 cm falling by 10.00 hrs. At Poggiomarino fine lapilli began to fall at 04.00 hrs, and increased in size such that by 09.00 hrs some incandescent pyroclastic clasts of 1 kg mass fell out. Lapilli the size of walnuts were sampled at Cava di Tirreni between 10.00 and 11.00 hrs. Although the plume was dispersed to the SE, the descending path of the pyroclastic material was locally oblique with a lateral component occurring toward the volcano; in fact, at Poggiomarino windows were broken that faced toward Nocera (away from the volcano), rather than those facing toward the volcano.
2.d. Phase 3: mixed explosions
Just after 12.00 hrs on 22 March a change in the composition of the ejected material was observed. Apart from hot juvenile fragments, dense lava fragments were also erupted. The eruption column was described as being ‘dark and ash-rich’ and was estimated to be greater than 5000 m by airmen taking-off at Capodichino airport in Naples. Explosive activity decreased in the following hours, ending at 17.55 hrs. Collapse of the crater floor had considerably modified the morphology of the crater during this phase. At S. Giuseppe there was a pause in the fallout of lapilli from 11.30 until 22.00 hrs, whereas at Poggiomarino the hiatus in fallout lasted for just half an hour between 12.30 and 13.00 hrs. Near Pompei, some houses were damaged by the fallout. At the airbase at Terzigno, fragments ‘as large as golf balls’ fell (Il Risorgimento, 1944b). The tephra fallout badly damaged 88 B25 Mitchell bomber aircraft, causing the evacuation and abandonment of the airbase (Bentley & Gregory, Reference Bentley and Gregory1944). Ash fall was also reported in Salerno (Il Risorgimento, 1944c).
In addition, at Poggiomarino by 18.00 hrs lapilli fallout had become sand-sized. After a quiet period of three hours, at 21.00 hrs dark ashes rose from two distinct eruptive columns from two separate vents. Ash and some lapilli fell at S. Giuseppe between 20.00 and 21.30 hrs and again from 22.00 hrs until 11.00 hrs on Thursday 23 March. At 10.00 hrs on 23 March the falling lapilli were coated by a thick ice layer. An intense ash fall blanketed Torre del Greco during the morning of 23 March. During the night of 22 and the morning of 23 March at the oil field of Devoli (actually Berat) in Albania (470 km from Vesuvius), a thin ash layer was deposited (Lazzari, 1947). It is noteworthy that, possibly due to bad weather, there is almost no photographic record of 22 March that documents the height of the eruption column. Photographs taken in the following days show a minimum column height of 5 km (Fig. 4c).
Nuées ardentes (e.g. pyroclastic currents) and hot landslides were observed during this phase. On 23 March, ash and lapilli fallout occurred throughout the day, although this was variable. Tephra fallout occured in the towns of Somma, Ottaviano, Terzigno, Torre del Greco, Pompei, Angri and Salerno. In Bari (210 km east), early in the morning of 23 March, ash completely obscured the city for almost half an hour (Il Risorgimento, 1944d). As a result of tephra fallout, some buildings in Nocera were completely destroyed, and there was extensive damage to the countryside.
2.e. Phase 4: seismic-explosive
At 14.00 hrs on 23 March, ash was the main component of the discontinuous eruptive column (possibly due to obstructions and clearing of the eruptive conduit). Strong seismic activity was recorded. Fine lapilli followed by mainly leucite-bearing fragments fell at Poggiomarino from 14.00 until 16.00 hrs while sand sized lapilli fell at Pompei after 16.00 hrs.
On the morning of 24 March, ash fall occurred in Poggiomarino, Pompei and Torre del Greco. Nuées ardentes and hot landslides were observed on the slope of the Vesuvius cone (Fig. 4d). The former were thought to have been triggered by seismicity, while the latter are attributed to ‘overboiling’ of ash clouds over the crater rim (partial collapses of the column). These nuées ardentes are very similar to those described by Lacroix (Reference Lacroix1906) and Perrett (1924) during the Vesuvius 1906 eruption. The velocity of the nuées ardentes was estimated to be about 2 or 3 km/min. The total volume associated with the nuées ardentes phenomena is estimated to be 3 × 10⁵ m3.
At 10.30 hrs on 25 March a strong wind from the NNE blew the eruptive cloud towards the SSW; ash fallout occurred in a narrow downwind area as far as the Sorrentine peninsula and on the island of Capri (message from Imbò published in Il Risorgimento, 1944e). From Napoli the volcanic plume seemed lower than previously and was bent over toward the SW (Il Risorgimento, 1944f,g).
On 26 March, coarse ejecta were emplaced upwind near the crater while downwind ash continued to fall in the SW toward Torre del Greco. Rare explosive events occurred on 27 and 28 March, and on 29 March eruptive and associated seismic activity ended. The crater rim was now higher on the NE and lower on the SW and was more than 300 m deep, with a volume of 25 × 106 m3 (Fig. 3b). Imbò announced officially on 31 March in a brief communication in the local newspaper (Il Risorgimento, 1944h) the end of the (paroxysmal phase of the) eruption. Small ash plumes, just a few metres high, were observed until 7 April; these were thought to have been caused by partial collapses of the inner crater walls.
The distribution of effusive and explosive products of the 1944 eruption, as mapped or described by contemporary sources (Imbò, Reference Imbò1949a; Parascandola, Reference Parascandola1945; Lazzari, Reference Lazzari1948), is reported in Figure 5.

Figure 5. Historic distribution of the products of the 1944 eruption. The minimum areal distribution of the fall deposits is in dark grey (after Imbò, Reference Imbò1945, Reference Imbò1949a; Parascandola, Reference Parascandola1945) or light grey (newspapers). Date and hour of start and end of each phase is shown. (a) Lava flows emplaced between 18 and 21 March 1944 (Imbò, Reference Imbò1949a); (b) debris avalanche deposits (Imbò, Reference Imbò1949a); (c) an eastward scoria lapilli fall deposit is accumulated between the fifth and the eighth lava fountaining; (d) after a brief pause, and a slight shift toward south of the dispersal axis, the eruption continues with lapilli falling from the sustained column; (e) after a three-hour pause, a wide area is affected by lapilli (proximal) and ash (distal) fall; (f) the last eruptive phase lasts some days and shows another significant shift in the dispersal axis. SG – San Giuseppe, PO – Poggiomarino, PM – Pompei, AN – Angri, CA – Cava, TG – Torre del Greco, MT – Meta. The distribution in this figure are derived from contemporary sources only.
3. The 1944 tephra stratigraphy, grain-size and components
We document the proximal stratigraphy (Figs 6, 7, 8) and also that at more distal locations (Fig. 9). There are marked differences between the proximal and medial/distal stratigraphy. The detailed stratigraphic framework reconstructed below allows a more complete volcanological reconstruction to be developed.

Figure 6. Schematic composite sections through the products of the 1944 eruption in the northern and SE part of the crater rim. Juvenile material is shown as open symbols and lithic material as filled symbols.

Figure 7. The SE part of the crater rim (loc. 4), showing a complete sequence through the products of the 1944 eruption. (a) Sintered spatter of Phase 2 (left) overlain by layers of dense juvenile-rich tephra of phase 3 (right). Histograms (grain-size) and pie charts (components > 1 mm): dark grey – juvenile; light grey – crystals; black – lithic; white – undifferentiated. (b) Whole sequence of SE crater rim at loc. 4. (c) Interpretation of the photograph shown in (b) above. (d) Key locations mentioned in the text and outline of avalanches (light grey) and 1944 lava flows (black) after Imbò (Reference Imbò1949a) and Hazlett et al. (Reference Hazlett, Buesch, Anderson, Elan and Scandone1991).

Figure 8. Sequence through the upper part of the 1944 products (loc. 5) 250 m SE of the crater rim. Grainsize and component analyses of several units are shown. These deposits are considered to be formed by small pyroclastic density currents during Phase 4 of the eruption. For location of section see Figure 7.

Figure 9. Key sections of the medial–distal tephra sequence. Inset shows the locations of sections. Components between 32 and 2 mm were separated by hand, while the finer fraction was analysed by means of a binocular microscope, counting a minimum of 500 grains for each size class.
3.a. The proximal stratigraphy at the crater rim
An almost complete sequence through the 1944 eruption products is preserved at the summit of the ‘Gran Cono’ of Vesuvius (Figs 6, 7). Prior to the 1944 eruption, the crater was filled by the products of activity that had occurred between 1906 and 1944. These products are predominantly lava flows with subordinate scoria lapilli related to the effusive and strombolian activity and are now exposed in the inner walls of the crater. Photographs taken immediately prior to the eruption show that the crater was almost completely filled, and that lava was spilling out onto the SE and NW flanks (Imbò, Reference Imbò1949a) (Fig. 4a).
Lava extruded at the start of the 1944 eruption (Phase 1) is exposed around most of the inner crater rim. It is locally up to ~ 10 m thick, although more typically around 2 to 3 m thick, but is not completely continuous, probably owing to the pre-1944 intra-crater topography. The lava locally grades upwards into densely welded spatter formed during Phase 2 that is approximately 5 m thick on the northern crater rim. Sintered and weakly welded spatter overlies this and is continuously exposed all around the crater rim. It is up to 30 m thick, particularly in the N and SE parts of the crater walls (the tourist path along the rim shows continuous exposures of this spatter). This spatter is formed by typically red coloured, crystal-rich spatter rags that are locally > 1 m across. Spatter rags become slightly coarser toward the top of the unit, such that a crude inverse grading is visible (Fig. 6). A faint stratification is also present in the spatter, which becomes better developed near the top. Layering in the spatter exposed on the southern rim shows it draping both the inner and outer crater rim slopes (Fig. 7). Where the spatter locally dips into the crater, an imbricate structure is formed with later layers building on the inner slope (Fig. 6). Dense lithic and ballistic blocks are rare in the spatter deposits.
The spatter deposits grade upwards into up to 25 m of crudely stratified loose lapilli. The change from the spatter to the loose lapilli is considered to be the transition from Phase 2 to Phase 3. Much of the lower part of Phase 3 deposits on the crater rim are inaccessible; however, on the SE part of the crater rim individual layers are up to 2 m in thickness and are interbedded with thinner finer-grained ash-rich layers (Fig. 7). Outsized ballistic lithic blocks > 1 m in size are abundant within these loose lapilli layers (Fig. 6). Contacts between the coarse- and fine-grained layers are gradational.
The top of the sequence is formed by up to 5 m of ash-rich layers, many of which have a distinctive red colour and are interbedded with subordinate ash-poor, lapilli layers (Figs 6, 7). This ash-rich material is considered to be formed by Phase 4 of the eruption. Ballistic clasts are abundant within the ash-rich layers. The dense juvenile clasts are mostly angular but about 20 wt % are rounded. Component analyses of these lapilli layers reveal that they are rich in dense juvenile and lithic fragments in roughly equal proportions (Fig. 7). See Figure A1 in online Appendix (http://www.cambridge.org/journals/geo) for more information on grain-size analyses.
3.b. PDC deposits (mainly Phase 4)
About 250 m SE of the crater rim, a shallow (6 m deep) canyon exposes up to 4 m of the upper part of the 1944 tephra sequence (Fig. 8). The deposits are composed of a series of poorly sorted layers, up to 90 cm thick, which rest on coarse lapilli layers inclined at 20°, although this increases to 35° in its most proximal part. The layers thicken away from the crater, reaching their greatest thickness, most typically between 40 and 60 cm, on the shallowest angled slopes. The basal part of the succession is formed by crudely stratified ash and fine lapilli deposits; in the upper part, layers display marked reverse grading. Within all the layers vesicular scoria is rare; more abundant are dense scoria and lithic lava clasts. The PDC deposits are poorly sorted, and component analyses show that they have up to 40 wt % lithic fragments. We suggest that these PDCs were emplaced during Phase 4 of the eruption.
3.c. The medial to distal tephra sequence (> 1 km to 25 km)
At distances of more than 1 km from the crater, products of the explosive phase of the 1944 eruption occur up to 2.5 m in thickness. Over forty sections through the 1944 pyroclastic deposits were studied (Fig. 9); some of these were natural sections in quarries, for example, but many were temporary exposures in artificially dug pits, building sites and archaeological sites. Due to the almost completely cultivated nature of the plain to the east of Vesuvius (> 4 km from the crater), natural exposures are absent. The deposits of lapilli are locally overlain by ash-rich material. We observed primary 1944 scoria lapilli ~ 25 km from the crater in Nocera Inferiore (Fig. 1). Although completely reworked, dispersed 1944 rare scoria lapilli up to 2 cm in diameter can be found in the soil near Cava dei Tirreni about 35 km from the crater.
3.c.1. Lapilli deposits (Phases 2 and 3)
The thickest lapilli deposits are up to 2.5 m, 1.8 km to the ESE of the crater, overlying the lava flow formed in 1929, on the subdued Somma caldera rim. Juvenile material at the base of the fall deposit, derived from Phase 2, is composed almost exclusively of well-vesiculated scoria. The beginning of Phase 3 is marked by the appearance of abundant dense scoria fragments at approximately half-height vertically above the base, coincident with the coarsest part of the lapilli deposit.
Individual juvenile clasts are up to 20 cm in diameter and the deposit is relatively massive and homogeneous. Some weak, discontinuous slightly finer-grained crude stratification is locally visible within the lapilli at relatively proximal exposures. Apart from a few centimetres of slightly finer material at the base, the scoria lapilli show variable grading. Southwest of the crater, toward Torre del Greco, the lapilli layer rests on top of a thin soil developed on the coarse 1822 lapilli. This layer is up to 15 cm thick, very well sorted (σφ0.8 to 1.0) and rich in lithic and dense juvenile clasts. Outsized lithic clasts are abundant within the lapilli, possibly derived from a ballistic origin.
To quantify the vertical variations in grain-size, the scoria lapilli layer was sampled from the base, middle and top where the thickness was > 0.5 m, and the base and top in the remaining locations (Fig. 10a). Proximal locations < 5 km from the crater (secs 10, 12 and 14) show a well-developed reverse to normal grading, whereas the scoria lapilli is normally graded in more distal outcrops and to the SW, near Torre del Greco. Local, rare reverse grading is developed. (For further details on grain-size data, please see Fig. A1 in online Appendix at http://www.cambridge.org/journals/geo).

Figure 10. Vertical variations of grain-size parameters: (a) median diameter; (b) sorting. Locations of the sections are reported in Figure 1. In parentheses, distance from the vent in kilometres.
Component analyses of the lapilli reveal that the juvenile scoria has both a variable vesicularity and crystal content. Density measurements show that the vesicularity index of the scoria ranges between 8 and 60 % (after Houghton & Wilson, Reference Houghton and Wilson1989, and using a magma density of 2500 kg/m3). In particular, Phase 2 scoria ranges from 36 to 60 % (mean 48 %), while scoria erupted in Phase 3 is less vesicular, ranging between 8 and 40 % (mean 24 %); the ratio between low and high density scoria increases upwards from 1/10 to 1/2.3 to 1/1.4. Lithic types range from lavas to skarns (a detailed classification of the nature and origin of 1944 lithics is reported in Fulignati et al. Reference Fulignati, Marianelli, Sbrana and Guido1996, Reference Fulignati, Marianelli, Sbrana and Guido1998). Loose crystals consist mainly of pyroxene and minor leucite and olivine.
The different phases of the eruption show variable proportions of components. (See Fig. A2 in online Appendix for more details.) Phase 2 lava fountain deposits are rich in juvenile material (up to 94.4 wt %), whereas for Phase 3 deposits the juvenile content is lower, ranging from 46.7 to 82 wt %, and crystals form up to 45 wt %. Components from particular units also vary with distance and relation to the dispersal axis (Fig. 11a–c). The proportion of lithic and crystals in both reverse and normally graded layers decreases with distance in relation to juvenile material. At the same distance from the vent, samples taken off-axis (to the west and south) show a decrease in lithics and crystals. For example, at a location on the dispersal axis, 3.6 km from source, the products are composed of 13.6 wt % lithics and 39.6 wt % crystals. Samples in an off-axis location, 2.7 km from source, contain only 2.4 wt % lithics and 15.6 wt % crystals. On the crater rim, lithic content reaches its maximum (25 wt %), while crystal content is relatively low. A concomitant rise in the percentage of juvenile material is observed as a function of distance from the volcano and the depositional axis. In several exposures, as far as 6 km from the crater, outsized lithic clasts are common.
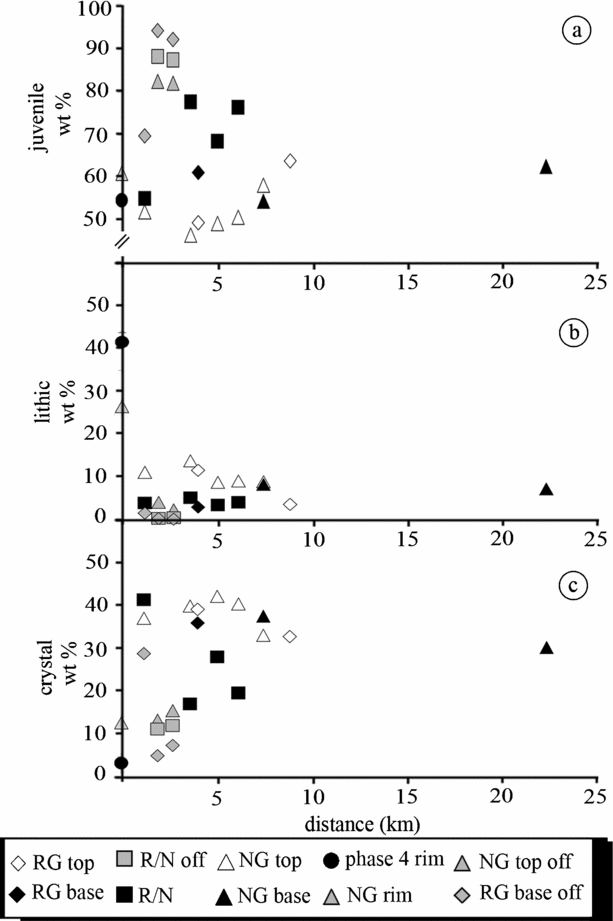
Figure 11. Plot of components against distance from source: (a) juvenile; (b) lithics; (c) crystals. RG = reverse graded; NG = normally graded; R/N = reverse to normally graded.
3.c.2. Ash-rich deposits (Phase 4)
Ash-rich deposits crop out on top of the lapilli to the S, SW and SE. Proximal exposures at the SE foot of the cone, about 1 km from the crater, show ash-rich deposits up to 60 cm thick (Fig. 9) interstratified with thin lapilli layers up to 8 cm thick. The thicker ash layer is poorly sorted, massive and has a valley-ponded geometry. Outsized clasts of poorly vesicular lava are abundant in the ash-rich deposits. Many of these outsized clasts have impact sags associated with them, indicating a ballistic origin. Ash-rich layers cap the lapilli deposit up to 2.5 km from the crater rim, towards the south. Several exposures show two poorly sorted (σφ >2) ash-rich layers. We suggest that these ash layers might represent the distal facies of the PDC deposits identified on the crater slopes (see Fig. 8).
The uppermost ash-rich deposit, up to 20 cm thick, can be traced from the south slope of Vesuvius to the SW towards Torre del Greco. Closer to the vent it rests on the previously described ash layers, while further SW it rests on top of a thin lapilli layer emplaced during Phase 3. This is a massive, 20 cm thick, well-sorted (σφ 1.0–1.15) deposit. Coarse ash layers a few centimetres thick occur near the base of the ash-rich material. This uppermost ash-rich horizon we interpret as being associated with the final ash fall produced during Phase 4.
4. Physical parameters of the 1944 eruption
4.a. Dispersal of the 1944 tephra
Contemporary accounts (Parascandola, Reference Parascandola1945; J. V. Stephens, unpub. data) allowed the construction of a cumulative isopach map for Phases 2 and 3 (Fig. 12a). J. V. Stephens was a military geologist Major in World War II and observed the 1944 eruption, making detailed notes that are archived with the British Geological Survey. Parascandola (Reference Parascandola1945) described thicknesses of up to 80 cm in the Terzigno area and 40 cm in Poggiomarino. Coarse lapilli are described as reaching Battipaglia, about 50 km from the crater, and this was used to locate the 1 cm isopach. The 0.5 cm isopach is constrained by the report of sand and ash fall in Pertosa 90 km ESE of the crater. The distal extent of the tephra fallout was constrained from several sources (Parascandola, Reference Parascandola1945; Imbò, Reference Imbò1949a; Il Risorgimento, 1944c). Ashfall occurred for several hours in Bari, which allows us to constrain the northern extent, and as far south as Santa Maria di Leuca (Fig. 12a). The distal limit of ashfall is at Berat (reported as Devoli) in Albania, 460 km east of the crater (Lazzari, Reference Lazzari1948). We use these three locations to correspond to the 1 mm isopach of ashfall. Using new field data, separate isopach maps were drawn for Phases 2, 3 and 4 (Fig. 12b–e). These demonstrate the different dispersal extent and direction of the various phases.

Figure 12. Isopachs of 1944 tephra fallout of: (a) intermediate to distal tephra fallout derived from contemporary accounts of Phases 2 and 3 (Imbò, Reference Imbò1949a; Parascandola, Reference Parascandola1945; Stephens, unpub. data), inset: distribution of tephra fallout across southern Italy and Albania. Data from Imbò, Reference Imbò1945, Reference Imbò1949a; Parascandola, Reference Parascandola1945; Lazzari, Reference Lazzari1948. (b) Field measured lapilli of the reverse graded layer (Phase 2). (c) Field measured normal graded layer (Phase 3). (d) Proximal and intermediate ash distribution (Phases 3 and 4) from contemporary documents. (e) Phase 4 distal tephra distribution reconstructed on the basis of newspapers (Il Risorgimento, 1944c) and scientific descriptions (Imbò, Reference Imbò1949a).
Data from both the ‘contemporary’ isopach and ‘field measured’ isopachs for Phases 2 and 3 (see below) were plotted on a ‘thickness versus area(1/2)’ diagram (Fig. 13). In order to account for the compaction suffered by the deposits in the 62 years since the eruption, we have placed 30 % negative error bars on the contemporary thicknesses. Where thicknesses include data from both techniques, field measurements generally fall within the error bars of the thicknesses derived from contemporary documents (Fig. 13).
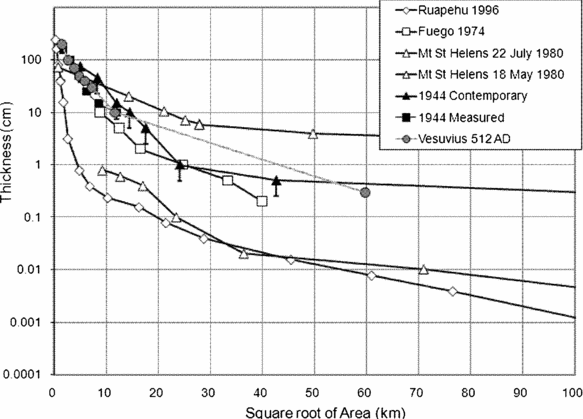
Figure 13. Thickness v. area1/2 (after Pyle, Reference Pyle1989). 512 = 512 ad subplinian eruption of Vesuvius; other fall deposits formed by subplinian and plinian eruptions are also shown.
Compared with other documented eruptions, the 1944 deposits lie within the region of subplinian deposits. It is clearly of a smaller magnitude than the Mt St Helens 18 May 1980 plinian deposit, but is quite similar to the Fuego 1974 fallout deposit that has a subplinian dispersal (Rose et al. Reference Rose, Self, Murrow, Bonadonna, Durant and Ernst2008). Compared with other fall deposits at Vesuvius, the 1944 deposit is very similar in dispersal to the 512 ad deposits that are described as being subplinian (Cioni et al. Reference Cioni, Bertagnini, Santacroce and Andronico2008).
For the whole scoria fall deposit (Phases 2 and 3) we calculated bt (the thickness half distance) of 1.7 km and bc (the clast size half distance; Pyle, Reference Pyle1989) for both lithic and scoria clasts, which yielded different values of 1.9 km and 3.6 km, respectively (Fig. 14). Plotting these values on the bc/bt versus bt diagram of Pyle (Reference Pyle1989) shows that both the dispersions associated with lithic and scoria clasts lie with the subplinian field (Fig. 15). All physical parameters evaluated in this paragraph (volume, mass, MDR) are reported in Table 1.

Figure 14. Plot of clast diameter v. isopleth area1/2 (after Pyle, Reference Pyle1989). Maximum grain-size of lithic and juvenile (scoria) fragments is represented. k = gradient; bc = clust half distance.

Figure 15. Half distance ratio v. thickness half-distance (after Pyle, Reference Pyle1989) for 1944 products. Open symbol – scoria; closed symbol – lithic.
Table 1. Estimated eruption parameters for the 1944 Vesuvius products

Magma density is assumed at 2500 kg m−3. The duration of each phase is constrained by historical data (Imbò, Reference Imbò1949a).
T0: Thickness projected to source using Log thickness v. Area (1/2) plot.
1 Lava flows, hot landslides and small nuées ardentes volumes were estimated by Imbò (Reference Imbò1949a).
2 Net length of the fountaining phase (IV to VIII fountains) that dispersed lapilli in the plain.
MTh – measured thicknesses from fieldwork; OTh – original thicknesses from contemporary documents. Distal ash measured using method of Fierstein and Nathenson (Reference Fierstein and Nathenson1992). Lithic DRE given in parentheses is part of the total volume
4.b. Volumes of the explosive phases (magnitude)
Contemporary accounts indicate that the first four lava fountains only generated significant fallout close to the crater rim (Parascandola, Reference Parascandola1945), consequently we associate Phase 2 (the reverse graded portion of the scoria lapilli deposit exposed in proximal regions between 1 and 5 km from the crater) with fountains V to VIII. The isopach map (Fig. 12b) yields volumes of 17 × 106 m3 (bulk) and 8.2 × 10⁶ m3 (DRE) for this phase. The average lithic content in this phase is 2.2 wt %.
The isopach map for Phase 3 derived from field-measured thicknesses (which includes thicknesses down to 10 cm extrapolated to zero thickness; Fig. 12c) yields a bulk volume of 67 × 106 m3 using the technique of Fierstein & Nathenson (Reference Fierstein and Nathenson1992). Thicknesses estimated from contemporary documents of both Phases 2 and 3 (Imbò, Reference Imbò1949a; Parascandola, Reference Parascandola1945) yield a bulk volume of 110 × 106 m3. Calculations of volumes of the distal ash dispersed to the SE (estimated using the technique described earlier in this section) using a single slope Fierstein & Nathenson (Reference Fierstein and Nathenson1992) technique yield values of 170 × 106 m3 (bulk) and 102 × 106 m3 (DRE). If we associate the distal ash to this phase, the bulk volumes increase dramatically to 254 × 106 m3 and 280 × 106 m3 for measured and original thicknesses, respectively.
Isopachs were constructed for both contemporary and field measured thickness of Phase 4 (Fig. 12d, e; Parascandola, Reference Parascandola1945; Il Risorgimento, 1944c). However, the deposits associated with Phase 4 have been extensively eroded, such that many of the exposures documented are probably only small fractions of their original thicknesses. Therefore, for Phase 4 only the contemporary thickness descriptions were used to constrain the volume. These measurements yield volumes of 4.2 × 10⁶ m3 (bulk) and 2.5 × 10⁶ m3 (DRE), and the content of lithic material accounts for 9.6 wt %. Hot landslides and small nuées ardentes volumes were estimated by Imbò (Reference Imbò1949a) to be about 0.3 × 10⁶ m3.
The total volume of lithic material in the main lapilli Phase 2/3 and Phase 3/4 ash-rich deposits totals 4.8 × 10⁶ m3. If it is assumed that the lithic content in distal ash is similar to that measured (6.8 wt %) in distal outcrops of scoria lapilli, a total lithic volume of 12.1 × 10⁶ m3 is obtained. This value is considerably less than 50 % of the crater volume of 25 × 106 m3.
Differences in the volumes calculated by contemporary thickness isopachs and field measured thickness isopachs are to be expected (Table 1). Isopachs derived from field studies will always underestimate a deposit volume owing to erosion and/or compaction in the time since the eruption (fieldwork was undertaken in 2006 and 2007). Contemporary thicknesses are not abundant, and the location and veracity of thickness reported is uncertain. At almost all localities the deposit is at least slightly eroded. The true tephra volume is almost certainly greater that that derived from our field studies but is probably less than contemporary thicknesses which may have been overestimated. Together with the volume erupted as lava of 20 × 106 m3 (DRE), we consider an average of the contemporary and field measured volumes 79.7 × 10⁶ m3 (DRE) as being the closest to the real volume erupted without the distal ash, so that this is comparable to other deposits where the extent of distal ash is not known. Considering the distal ash, then the total volume of erupted products is estimated at > 167 × 106 m3.
4.c. Mass discharge rates (intensity)
Imbò (Reference Imbò1945) considered Phase 3 to be the paroxysmal phase of the eruption. However, other contemporary documents (Parascadola, 1945) describe coarse lapilli falling at Cava dei Tirreni some 30 km from the vent between 10.00 and 11.00 hrs on 22 March, which must have been associated with the last fountain VIII of Phase 2. Following a pause of 30 minutes between Phases 2 and 3, extensive, coarse fallout continued into Phase 3 until 18.00 hrs, when the lapilli had become ‘sand-sized’ (Parascadola, 1945). On this basis, we therefore propose that the majority of main scoria lapilli dispersed to the SE of the volcano was formed during a ten-hour period which we refer to as the ‘Paroxysmal Phase’ defined by the last fountain (VIII) of Phase 2 and the first five hours of Phase 3.
Mass discharge rates (MDR) generated from the calculated volumes of the deposits and the known durations of the different phases indicate that the paroxysmal phase of this event lasted about ten hours and, including the most violent part of Phase 2 and Phase 3, were around 3.5 × 10⁶ kg/s; however, the MDR is in excess of 107 kg/s if we consider the mass emplaced as distal ash (Table 1). The MDR for the earlier fountaining phase and the late sustained column phase was smaller (from 0.7 to 3.5 × 10⁶ kg/s, respectively) if only the proximal deposits are considered. These lower values of MDR are similar those estimated by Scandone, Iannone & Mastrolorenzo (Reference Scandone, Iannone and Mastrolorenzo1986) and Cioni et al. (Reference Cioni, Bertagnini, Santacroce and Andronico2008).
Previous workers (e.g. Arrighi, Principe & Rosi, Reference Arrighi, Principe and Rosi2001; Scandone, Giacommeli & Speranza, Reference Scandone, Giacomelli and Speranza2008) have described the 1944 eruption as being ‘violent strombolian’. Recently, Cioni et al. (Reference Cioni, Bertagnini, Santacroce and Andronico2008) quoted a volume of 0.066 km3 for the 1944 fall deposit calculated on an isopach map by Pesce & Rolandi (Reference Pesce and Rolandi1994) and an intensity of 1.5 × 10⁶ kg/s. Thus our volume calculations are in line with Cioni et al. (Reference Cioni, Bertagnini, Santacroce and Andronico2008), although we propose higher intensities based on detailed considerations of the durations of the paroxysmal phase.
4.d. Column heights
The heights of lava fountains (Phase 2) are quoted as ‘up to 2 km’ above the crater (Imbò, Reference Imbò1945, Reference Imbò1949a). Convecting tephra plumes undoubtedly developed simultaneously above the crater during these fountains, carrying finer tephra to greater heights. The eighth lava fountain took place at 07.31 hrs and continued until 12.40 hrs on 22 March. This eighth fountain corresponds to the initiation of the coarsest tephra fallout off the slopes of the volcano and indicates that abundant widely dispersed tephra fallout occurred associated with this final fountain and the beginning of Phase 3 (the eruption's paroxysmal phase).
Contemporary reports (Imbò, Reference Imbò1949a), including those of pilots taking off from Capodichino airport 10 km to the NW, indicate that the eruption column on 22 March reached heights of between 5 and 6 km. However, on the morning of 22 March the weather was bad, with low cloud and rain (see also Chester et al. Reference Chester, Duncan, Wetton and Wetton2007, p. 193), and this is likely to have obscured observations of the eruption plume at that time. Indeed there is a clear absence of photographs of the eruption from the morning of 22 March, which is probably as a result of this poor weather (e.g. see Pesce & Rolandi, Reference Pesce and Rolandi1994).
Isopleth data (Fig. 16), generated from our field studies on both the scoria and lithic lapilli of the 1944 scoria lapilli deposit, are similar to the size of clasts reported in contemporary documents (Parascandola, Reference Parascandola1948). Lapilli ‘the size of walnuts’ (~ 2 cm diameter) were collected at Cava di Tirreni on 22 March. Lapilli ‘the size of golfballs’ were described as falling at the airfield at Terzigno, which corresponds well with the size of clasts measured at ~ 4 cm diameter in this region during this study (see Fig. 16). Column heights estimated from clast distribution using the method of Carey & Sparks (Reference Carey and Sparks1986) are > 10 km (Fig. 17).

Figure 16. Isopleth maps of the maximum (a) lithic and (b) scoria based on the average of the three principal axes of the five largest fragments at any one exposure.

Figure 17. Column height and wind speeds during the paroxysmal phase of the 1944 eruption (end of Phase 2 and beginning of Phase 3). Figure adapted and redrawn from Carey & Sparks (Reference Carey and Sparks1986).
From the contemporary chronicles we know when the ash produced during the paroxysmal phase of the eruption reached distal localities. In this way we can calculate the wind speed during this phase of the eruption. If we assume that the distal ash began to be dispersed when the column reached its maximum height at the end of Phase 2 and at the beginning of Phase 3, presumably between 11.00 hrs and 15.00 hrs on 22 March, and if we consider that ashes fell at Berat (450 km from the vent) in the night between 22 and 23 March (Lazzari, Reference Lazzari1948), we calculate an average wind speed ranging between 38 and 55 km/h. This velocity is similar to that obtained from theoretical considerations (about 20–50 m/s, see Fig. 17).
4.e. Accumulation rates
Imbò (Reference Imbò1949a) states that the most intense explosive phase occurred between 07.30 hrs and 17.40 hrs on 22 March. Based on the description of the timing of fallout this seems likely, therefore we obtain accumulation rates ranging from about 4.5 cm/h (up to 5 km downwind) to 1.5 cm/h in more distal localities. These values are one order of magnitude less than those attributed to plinian fall deposits by Wilson & Hildreth (Reference Wilson and Hildreth1997).
5. Eruptive mechanisms
Many volcanic eruptions start with an explosive phase and are followed by an effusive phase. This behaviour is often associated with a change in the rheological properties of the ascending magma linked to a variation in chemical composition (Parfitt & Wilson, Reference Parfitt and Wilson2008). Usually, evolved, volatile-rich magmas form the explosive phase, while more primitive and volatile-poor magmas extrude quietly at the surface as lava flows (Fink & Anderson, Reference Fink, Anderson and Sigurdsson2000).
In order to assess the possible influence of magma composition on the style of the 1944 eruption, major and selected trace element analyses of samples from lavas, spatter and pyroclastic horizons (from both proximal and distal locations) were undertaken (Table 2). Products of the 1944 eruption range in composition from K-tephrites to K-phonotephrites. Our lava sample, as well as many others from various branches of the 1944 lava flows at different distances from the vent (Scherillo, Reference Scherillo1949; Joron et al. Reference Joron, Métrich, Rosi, Santacroce and Sbrana1987; Marianelli et al. Reference Marianelli, Métrich and Sbrana1999), are exclusively phonotephrites. The products of the two successive explosive phases (Phases 2 and 3) are more mafic. Our data (Fig. 18) confirm the compositional trend described in the literature (fig. 2 of Marianelli et al. Reference Marianelli, Métrich and Sbrana1999), albeit with a wider variation in CaO for Phases 2 and 3. Finally, samples of Phase 4 suggest an inversion of the chemical gradient (Fig. 18). These data show that the composition is not a primary factor in the variation in eruptive mechanisms. Other factors were probably more important in causing the effusive to explosive evolution. The effusive character of the first phase of the 1944 eruption was possibly strongly influenced by the rise velocity of the magma and the conditions at the vent. The elevated phenocryst contents in the lava flow (30–50 % in volume; Marianelli et al. Reference Marianelli, Métrich and Sbrana1999) and their low H2O–CO2 content (about 1 wt %; Fulignati et al. Reference Fulignati, Marianelli, Métrich, Santacroce and Sbrana2004) indicate a relatively slow-moving magma that segregated most of its volatiles and reached the surface almost degassed. Conversely, the high volatile content (up to 4 wt %; Fulignati et al. Reference Fulignati, Marianelli, Métrich, Santacroce and Sbrana2004) of the pyroclastic products suggests that the fast ascent of magma inhibited its degassing, allowing the magma to fragment explosively (Scandone, Giacommeli & Speranza, Reference Scandone, Giacomelli and Speranza2008).
Table 2. Major elements of the 1944 Vesuvius products (values in wt %)

Lava and juvenile clasts have been analysed for major elements by XRF at the Department of Earth Science, University of Naples. Precision is better than 5 %. Na2O and MgO were determined by AAS.

Figure 18. Compositional variation (CaO v. stratigraphic height) of the Vesuvius 1944 samples compared with data from literature (Scherillo, Reference Scherillo1949; Marianelli et al. Reference Marianelli, Métrich and Sbrana1999).
Important variations in eruptive style were also recorded between the different phases of the eruption (Imbò, Reference Imbò1949b). Initially the effusive phase 1 involved several discrete pulses of lava flows. The lava fountains of Phase 2 were characterized by discrete explosive pulses lasting from 18 to 310 minutes, while the intervals between two successive pulses range from 15 to 195 minutes. Plotting the cumulative duration of the individual fountains I to VI versus the intervals between two fountains (Fig. 19), shows an almost constant trend until fountain VII, when there was abrupt change reflecting the considerably longer duration of fountain VIII. This suggests that the eruptive conditions were relatively constant during most of Phase 2 and started to change only with the last fountain. We speculate that small and discrete batches of magma arrived at the surface at a relatively constant rate, explaining the pulsatory but initially regular nature of the fountain phase. Both the quantity and eruption rate of magma increased markedly with fountain VIII and again with the following, rapidly developing, vertical eruption column, causing the transition from transient fountains of Phase 2 to the sustained eruption column of Phase 3. Component analyses reveal a marked increase of lithic content in the fall deposit between Phase 2 and 3, indicating a change in vent conditions during Phase 3: the destabilization of the feeding system due to its partial evacuation. Component analyses (Figs 6, 8, 9) show the ubiquitous presence of dense juvenile fragments throughout the whole 1944 fall deposit (associated with both Phases 2 and 3). These dense juvenile clasts probably derive from partially degassed magma, and their increase towards the top of the scoria fall deposit suggests that a larger quantity of degassed conduit material was erupted as time progressed. The presence of a large quantity of ash observed in the eruptive column by Imbò (Reference Imbò1949b) has been interpreted as marking a transition to mixed magmatic–phreatomagmatic activity (Marianelli et al. Reference Marianelli, Métrich and Sbrana1999). Grain-size analyses and morphological observations on juvenile clasts do not support this hypothesis. In fact, good sorting and predominance of vesiculated juvenile clasts strongly support purely magmatic activity. Of course, numerous observations and models (Zimanowski et al. Reference Zimanowski, Wohletz, Dellino and Buttner2003) indicate that during plinian eruptions a large quantity of ash is produced and then emplaced far from the vent (e.g. co-plinian ash of the Campanian Ignimbrite; Perrotta & Scarpati, Reference Perrotta and Scarpati2003).

Figure 19. Durations of single fountains versus the intervals between two successive pulses.
During Phase 4 of the eruption, obstructions and clearing of the conduit were suggested by Imbò (Reference Imbò1949b). The explosive removal of the cooled viscous magma gives rise to the characteristic vulcanian events. The last few days of the eruption (Phase 4) produced essentially ash fall. The solidification of shallow dykes may have prevented the rise of new magma batches and prevented magma movement toward the surface.
The high fraction of ash (70 % in volume) produced during this eruption might be related to processes other than phreatomagmatic interaction. As has previously been suggested for other explosive eruptions (Adams et al. Reference Adams, De Silva, Self, Salas, Schubring, Permenter and Arbesman2001), it can be a consequence of the presence of a large amount of crystals that provide more interfaces from fracture and therefore generate abundant fines that can be distributed distally.
6. Emplacement mechanisms
6.a. Scoria fall deposit
Scoria lapilli fell downwind (SE) of Vesuvius during 22 and 23 March 1944. In this period two different eruptive phases (Phase 2 and 3) were recognized and several pauses (up to 195 minutes) in the eruptive activity were recorded (Imbò, Reference Imbò1945, Reference Imbò1949a).
Only on the crater rim is there clear evidence for the different phases owing to the stratification of the fallout deposits (Fig. 6). At distances of 1–2 km there is some discontinuous crude stratification locally visible within the lapilli, however, at most localities > 1.5 km from the crater there are no stratigraphic breaks suggesting any discontinuity in the eruptive activity.
Pauses in fallout occurred at S. Giuseppe Vesuviano and at Poggiomarino (Parascandola, Reference Parascandola1945). At S. Giuseppe Vesuviano, a pause in scoria fallout started at 11.00 hrs on 22 March, lasting 10 hours and 30 minutes. We know from the chronicles that during this period, scoria pyroclasts accumulated SE of Vesuvius, consequently we can attribute this lack of fallout in S. Giuseppe Vesuviano to a shift of the dispersal direction of the tephra plume caused by a change in wind direction. Finer-grained lapilli and ash fallout occurred from the edge of the eruptive cloud both before and after this pause. A short pause in scoria fallout was observed at Poggiomarino between 12.30 and 13.00 hrs. This pause coincides with the transition between Phases 2 and 3 of the eruption and is probably associated with a variation in the column height, that crucially is not recorded in the deposits at this distance. Nevertheless, grain-size analyses confirm the variation in height of the column. Pyroclasts fell from increasingly higher fountains (IV to VIII of Phase 2), forming the reverse graded portion of the scoria lapilli, and then from a sustained column (Phase 3) that declined in height after a few hours, forming the normally graded upper portion of the lapilli. Normally graded distal and off-axis deposits suggest that basal finer clasts, emplaced before fountain VIII, were dispersed in a relatively proximal (and narrow) area. The reverse to normal (symmetrical) grading structure without any grain-size discontinuity recorded in the deposit suggests that the column heights were similar at the end of Phase 2 and the beginning of Phase 3.
The proportions of components in the fall deposit correlate with the eruptive intensity (Houghton, Wilson & Pyle, Reference Houghton, Wilson, Pyle and Sigurdsson2000), reflect the eolian fractionation due to the size, shape and density of the ejecta (Walker, Reference Walker1981) and are a function of the original size of the components (e.g. crystals) in the magma. Heavy components (lithics and crystals) decrease with distance from the vent and from the dispersal axis, because the ability to support them decreases toward the edges of the eruptive cloud.
To quantitatively discriminate pyroclastic clasts emplaced either from the convecting plume or ballistically, we have calculated the product of size and density of both juvenile and lithic clasts. Outsized lithic clasts show size–density values ranging from 2 to 4 times those in aerodynamic equivalence, testifying to the different transport conditions, that is, ballistic trajectories. If we plot size–density values against the distance from the vent (Fig. 20a), they show a sharp decrease as far as 2 km from the vent and then relatively constant values. This pattern may represent the transition from particles falling from the edge of the eruptive column and those falling from the convecting eruptive cloud. It is noteworthy that the ratio of the size–density values of ballistic and fall clasts increases almost linearly with the distance (Fig. 20b). This suggests that the process of transport of ballistic clasts is more efficient than that from eruptive column (in the range of ballistic emplacement).

Figure 20. (a) Size–density values against the distance from the vent. ρ: density, d: clast diameter; (b) ratio of the size–density values of ballistic and fall clasts. db: diameter of ballistic clasts, df: diameter of fall clasts.
6.b. Pyroclastic density current (PDC) deposits
Two facies of PDC deposits were documented: (a) stratified ash with fine lapilli beds and (b) reverse graded beds, both of which have dense scoria and high lithic and crystal content. Thin, poorly sorted, massive ash layers occurring up to 2 km from the vent might be the distal facies of these PDCs. Contemporary photographs illustrate the partial collapse of the eruptive column and the formation of pyroclastic density currents (small nuées ardentes of Fig. 4d). Subparallel stratification indicates deposition dominated by traction sedimentation (Sohn & Chough, Reference Sohn and Chough1989), while reverse graded lithofacies are emplaced from a turbulent flow with a high-concentration basal layer (Branney & Kokelaar, Reference Branney and Kokelaar1992) acting as a traction-carpet (Lowe, Reference Lowe1982; Cole & Scarpati, Reference Cole and Scarpati1993). Relatively distal, thin, poorly sorted, matrix-supported and massive ash layers are consistent with an origin by rapid sedimentation of grains from the high concentration base of a density-stratified current (Branney & Kokelaar, Reference Branney and Kokelaar1992).
7. Volcanic risk assessment and hazard perception
Based on the contemporary chronicles we are able to define the type and extent of damage associated with the different styles (or temporal phases) of the eruption. On 18 March, lava flows spilled from the summit crater and travelled the 7 km to the towns of S. Sebastiano al Vesuvio and Massa di Somma in less than three days. The lava flow front near S. Sebastiano was 200 m wide and it slowly moved toward the south at a speed of 3–4 m/min. Citizens of this town were evacuated by the Allied Authorities to Cercola, San Gorgio and Pollena Trocchia (Bentley & Gregory, Reference Bentley and Gregory1944), while the possibility of evacuation was proposed for Torre del Greco and Cercola as well. The populations of S. Sebastiano, Massa di Somma and Cercola (several thousands) were partially evacuated in ten hours. On 21 March, four centres were prepared for the distribution of provisions (Il Risorgimento, 1944b). By Thursday 23 March (Il Risorgimento, 1944c) the damage caused by lava flows was clear: the town of San Sebastiano was mostly destroyed, together with Massa di Somma. A total of 2150 people at San Sebastiano and 600 at Massa di Somma were homeless, while another 250 people were evacuated from the village of Camaldoli to Castellammare (Bentley & Gregory, Reference Bentley and Gregory1944), due to the threat from the southern lava flow. Cercola escaped inundation as the northern lava flow came to rest just 500 m from the city boundaries. Two children were the victims of this effusive phase when a water cistern heated by the lava flow moving toward S. Sebastiano exploded.
On Saturday 25 March (Il Risorgimento, 1944d) a summary of the damage suffered by the local population as a consequence of the lapilli fall on 22 and 23 March (during Phases 2 and 3) was given. Some buildings were completely destroyed at Nocera and there was extensive damage to the countryside areas. The inhabitants of this region tried to reduce tephra accumulation, removing the volcanic material from roofs and terraces. Notwithstanding these attempts, the official list made by the Military Government report stated that twenty-four people died due to the collapse of roofs caused by the accumulation of tephra: twelve at Nocera, nine at Pagani and three at Terzigno (Fig. 1). These towns are respectively 20 km, 18 km and 6 km away from the Vesuvius crater, and this means that the number of the victims was inversely proportional to the distance from the vent. We know from historical data (Imbò, Reference Imbò1949a; Parascandola, Reference Parascandola1945) and our isopachs (Fig. 12) that the lapilli blanket thinned from 70–80 cm in the Terzigno area to about 20 cm at Nocera. It is evident that the tephra overload was not the sole cause of the roof collapse. Although we have no information about the type of buildings that collapsed, it seems likely that the type and state of the roof played an important role. A similar suggestion is indicated by damage analysis of other Vesuvius historical eruptions (Blong, Reference Blong1984; Luongo, Perrotta & Scarpati, Reference Luongo, Perrotta and Scarpati2003; Luongo et al. Reference Luongo, Perrotta, Scarpati, De Carolis, Patricelli and Ciarallo2003). For example, during the first phase of the 79 ad eruption, hundreds of people (38 % of total victims) were killed inside their houses at Pompei due to the presence of flat or low-sloping roofs that collapsed under the weight of pyroclastic material falling from the eruptive column (Luongo, Perrotta & Scarpati, Reference Luongo, Perrotta and Scarpati2003; Luongo et al. Reference Luongo, Perrotta, Scarpati, De Carolis, Patricelli and Ciarallo2003). A similar pattern was shown by the damage caused by the 1906 Vesuvius eruption, when about 200 people were killed as result of house roofs collapsing (Lacroix, Reference Lacroix1906). Most of these victims (105) were in a church at San Giuseppe Vesuviano, which was known to have an unsafe roof.
It is evident that despite the relatively low intensity of the 1944 Vesuvius eruption, there is a considerable risk associated with the tephra fallout phase. To evaluate the population at risk, both in 1944 and today for a ‘1944 type eruption’ (Tables 3 and 4) we use the formula below (Fournier d'Albe, Reference Fournier d'Albe1979):
We consider as ‘exposed value’ the population of residents of the regions enclosed within the hazard areas. Unfortunately, we have no data that allow us to quantify the vulnerability. We assume as residents during the 1944 eruption the inhabitants officially included in the 1936 census (ICSRI, 1937a,b,c,d), since the 1952 census in Italy was strongly affected by changes with respect to the 1944 residents due to World War II and post-war emigration. The present ‘exposed value’ is then determined using the residents of each municipality available from the Italian Institute of Statistics (ISTAT, 2007, reported in Table 3). Where only a fraction of the whole municipal area is affected by the hazard, we consider the same fraction of the inhabitants affected by the same hazard. For example, if 50 % of the territory of Terzigno is encompassed by the collapse load boundary we assume that 50 % of the residents are at risk. We use the new distribution of 1944 tephra fall deposit to map this volcanic hazard. We consider two damage threshold values of the load pressure to define the volcanic hazard related to tephra fall: a maximum sustainable load of 780 kg/m2 (Nunziante, Reference Nunziante1997) which we define ‘collapse load’ so as to distinguish it from a safer maximum sustainable load value adopted by the Italian Dipartimento della Protezione Civile (1995) of 300 kg/m2. To convert these to an equivalent thickness of scoria lapilli deposit we use a density value of 1700 kg/m3, obtaining 45 and 17 cm respectively. The corresponding isopachs are shown in Figure 21a. In this way we are able to evaluate which towns are likely to be subject to damage. Because wind directions play a critical role in influencing the pattern of dispersal of tephra, we have used the dispersion of the past Vesuvius eruptions to define the areas that could be affected by tephra accumulation (Fig. 21b). Obviously, this latter scenario determines a wider area (and many more towns) potentially affected by tephra fall, encompassing most of the territory of the Campanian Plain from the NE to SE of Vesuvius. Two towns are encompassed in the collapse load area (Fig. 21a) and the population at risk is increased from about 12000 to about 14000; in the much wider area defined by the maximum sustainable load are twelve towns (Fig. 21a), and the population at risk has increased from about 84,000 to about 168,000 over the last sixty years (Tables 3, 4). The most widespread hazard during a ‘1944 type’ tephra fall eruption is achieved when other possible wind directions are considered (Fig. 21b). In this scenario, four and twenty-five towns are encompassed in the collapse load area and maximum sustainable load area, respectively. This raises the population at risk to 32,000 (collapse load) and the much larger value of 349,000 (maximum sustainable load) (Table 4). All of the above results demonstrate that whatever hazard scenario we consider (e.g. collapse load, maximum sustainable load, more wind directions), the actual population at risk has roughly doubled compared to 1944.
Table 3. Population at risk during the 1944 eruption (populations as of 21 April 1936)

Table 4. Population at risk in the present day for a ‘1944 type’ event (populations as of 1 January 2007)


Figure 21. Hazard maps. (a) Two damage threshold values of the load pressure are considered to define the volcanic hazard related to tephra fall; dashed line encompass a maximum sustainable load of 780 kg/m2; dotted line encompass a maximum sustainable load of 300 kg/m2, grey shading is the limit of historical damage. (b) Area potentially affected by tephra accumulation, with a ‘1944 type’ tephra fall scenario, when other possible wind directions of past Vesuvius eruptions are considered. Dispersal axes shown: B – Pomici di Base eruption (Bertagnini et al. Reference Bertagnini, Landi, Rosi and Vigliargio1998); G – Pomici Verdoline eruption (Cioni, Sulpizio & Garruccio, Reference Cioni, Sulpizio and Garruccio2003); M – Mercato eruption (Rolandi et al. Reference Rolandi, Maraffi, Petrosino and Lirer1993a); A – Avellino eruption (Rolandi et al. Reference Rolandi, Maraffi, Petrosino and Lirer1993b); 79 – 79 ad eruption (Sigurdsson et al. Reference Sigurdsson, Carey, Cornell and Pescatore1985); 472 – 472 ad eruption (Sulpizio et al. Reference Sulpizio, Mele, Dellino and La Volpe2004); 1631 – 1631 eruption (Rosi, Principe & Vecci, Reference Rosi, Principe and Vecci1993); 1906 – 1906 eruption (Mastrolorenzo et al. Reference Mastrolorenzo, Munno and Rolandi1993).
We assume that the probability of occurrence of a VEI class 4 eruption at Vesuvius in ten years is 0.0175 (Scandone, Arganesi & Galdi, Reference Scandone, Arganesi and Galdi1993). This result has been recently grossly confirmed by a new statistical treatment of the Vesuvius eruptive records (Neri et al. Reference Neri, Aspinall, Cioni, Bertagnini, Baxter, Zuccaro, Andronico, Barsotti, Cole, Esposti Ongaro, Hincks, Macedonio, Papale, Rosi, Santacroce and Woo2008). Thus for both the collapse load and maximum sustainable load areas we can finally calculate the risk coefficient (Tables 3, 4). The risk value for the towns considered ranges from 14 to 888. The nineteen cities with a value greater than 100 fall in the group of high risk, according to the logarithmic scale proposed by Scandone, Arganesi & Galdi (Reference Scandone, Arganesi and Galdi1993).
Recently, Houghton et al. (Reference Houghton, Bonadonna, Gregg, Johnston, Cousins, Cole and Del Carl2006) have stressed that the rate of accumulation is an important parameter to evaluate the time required to achieve critical thresholds of tephra thickness (in our case: collapse load and maximum sustainable load) to damage the buildings. In this way it is possible to assign the variable of time to the area at risk. The accumulation rates previously illustrated show that in the collapse area (up to 5 km downwind) the maximum sustainable load was achieved in an interval between 3 and 10 hours, while this same critical value was achieved between 10 and 30 hours up to 15 km downwind. Because the ‘potential roof collapse zone’ (PRCZ) is roughly similar to the red zone defined in the emergency preparedness plan of Vesuvius (Italian Dipartimento della Protezione Civile, 1995), we conclude that this zone should be quickly evacuated also in case of tephra fall from a future eruption.
The hazard from pyroclastic density currents and debris avalanches was limited to within 2 km of the vent (Imbò, Reference Imbò1949a). We know from pictures taken on 24 March (figs 107 and 108 in Imbò, Reference Imbò1949a) that PDCs (small nuées ardentes of Imbò, Reference Imbò1949a) were produced by partial collapses of the sustained column. PDCs from future events of the same magnitude are unlikely to reach the main towns around the volcano, but if we consider the possibility of collapse of the whole eruptive column, the damage associated with and area impacted by this phenomenon could significantly increase.
From the reading of the brief articles published in the Neapolitan newspapers, it clearly emerges that the 1944 eruption did not arouse particular fear in the inhabitants of the Vesuvian area and Naples (See also Chester et al. Reference Chester, Duncan, Wetton and Wetton2007). An excellent example of this attitude is the following comment published at the end of the effusive phase, notwithstanding the presence of the eruptive column that testified to the beginning of an explosive phase: ‘any dangerous activity from the volcano has ceased’ In the contemporaneous and subsequent scientific literature (Imbò, Reference Imbò1949a; Parascandola, Reference Parascandola1945; Scandone, Iannone & Mastrolorenzo, Reference Scandone, Iannone and Mastrolorenzo1986), the magnitude of this eruption has been underestimated (see previous paragraphs) and very little attention has been dedicated to the damage that occurred. Until now the 1944 eruption of Vesuvius has been considered a low-energy, low-risk event (Imbò, Reference Imbò1945; Santacroce, Reference Santacroce1987). Because we have demonstrated that this eruption is comparable to the 1906 eruption, which produced hundreds of victims, it is interesting to consider why both ordinary people and scientists have had a different perception. In this regard it is important to remember that Naples was the most bombed Italian city in World War II. Estimates of civilian casualties are around 20,000 killed from more than a hundred heavy bombing raids (Stefanile, Reference Stefanile1968). In the autumn of 1943 Naples had returned to almost medieval conditions: large parts of it had been reduced to rubble by Allied bombs and following this, Nazi air attacks (Lewis, Reference Lewis1978). As a result there was no water supply, no electricity, no food and no jobs. Since the Allies’ arrival the cost of living had increased by 321 %. A working-class salary was 450 lire, equated to 30 pounds by early twenty-first-century standards. In south Italy 75 % of trains, 85 % of coaches, 90 % of trucks and 87.5 % of the merchant fleet had been destroyed by war (Holland, Reference Holland2008). To have an accurate picture about what happened in this region in this same period, we cannot forget the famous battle of Montecassino that was fought 150 km north of Naples, resulting in casualties of over 54,000 Allied and 20,000 German soldiers.
In this context, the harvest lost in large parts of the Campanian Plain, the roofs collapsed in the downwind area and the 26 victims caused by the 1944 eruption, represent a very minor amount of damage in comparison to that produced by several months of food-shortage, an almost complete destruction of urban areas and the deaths of thousands of civilians related to the war events. The attitude of the local population is well summarized in the following comment that appeared in the newspaper (Il Risorgimento, 1944g) at the end of the eruption: ‘Now that the threat (of the Vesuvius eruption) is fading away we can assert that the worry is never transformed into fear. These last years (of war) have been for the Neapolitans a terrible lesson’. Perhaps this understatement of the real size of the 1944 eruption was the only reasonable attitude from a population that had suffered the affects of several years of the Second World War.
8. Conclusions
Contemporary information, including scientific reports, newspaper descriptions and photography of the 1944 Vesuvius eruption, have defined objective parameters such as the length of the paroxysmal phases, areas affected by tephra fallout and volcanological interpretations (e.g. eruptive phases and eruptive mechanisms). These contemporary data have been used to calibrate a standard volcanological approach (e.g. stratigraphy, grain size, components, chemistry) for the quantitative reconstruction of the physical behaviour of this explosive eruption. We have ascertained that standard methods are able to define the different phases of the 1944 Vesuvius eruption, the shift of the successive fall dispersions and the time evolution of components, but are not able to identify brief time breaks in deposition as well as the presence of two vents during one phase of the eruption. On the other hand, our evaluation of the peak intensity of the 1944 eruption (using methods of Carey & Sparks, Reference Carey and Sparks1986 and Pyle, Reference Pyle1989) suggests a subplinian character of the paroxysmal phase of this eruption instead of the violent strombolian character suggested by contemporaneous witnesses.
Acknowledgements
The authors are indebted to the Ente Parco nazionale del Vesuvio and Soprintendenza di Napoli e Pompei, which allowed our field work in Vesuvius National Park and in some archeological sites, respectively. A. Severino, I. Palomba and V. Battista performed some of the grain-size and component analyses; L. Melluso and R. Solone performed chemical analyses. The comments of two anonymous referees improved the original manuscript.