1. INTRODUCTION
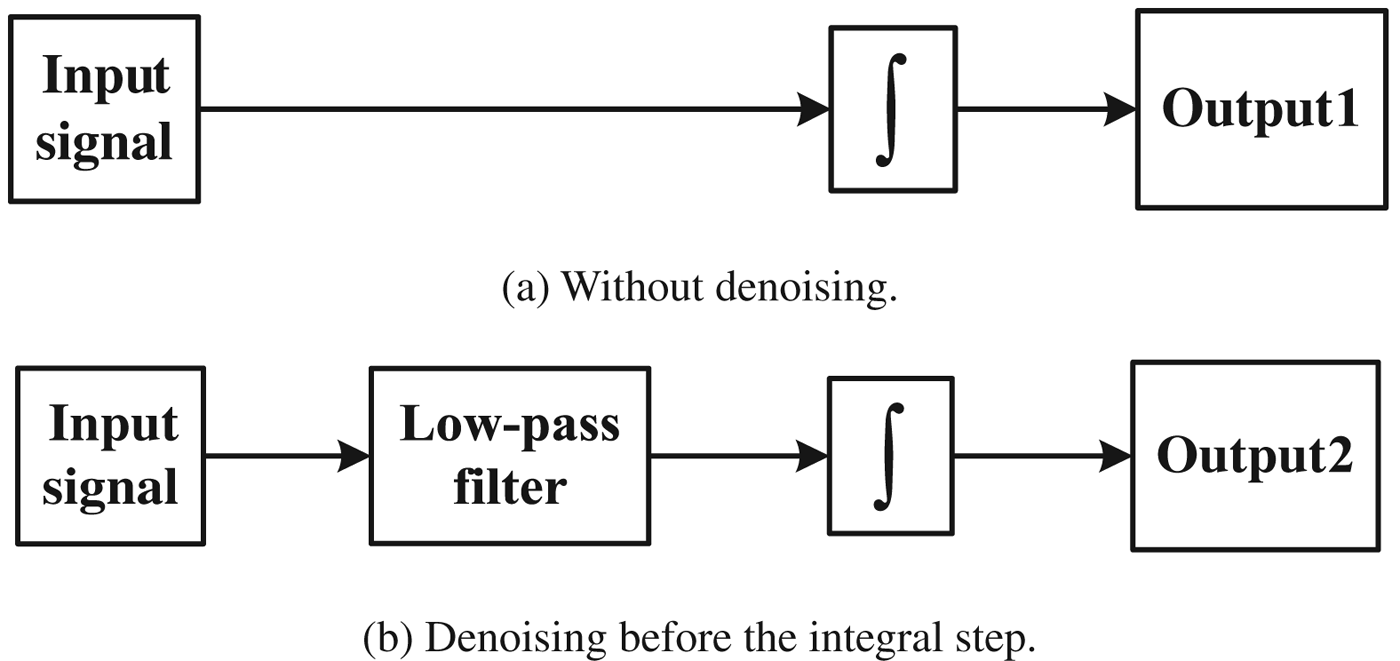
In inertial navigation systems (INS), the rotation rate and specific force of the body can be provided by gyroscopes and accelerometers. This information will then be handled by the inertial navigation algorithm, in which the integral is an essential operation. The fundamental concept is illustrated in Figure 1.

Figure 1. Fundamental concept of inertial navigation algorithm.
“Inertial navigation is an autonomous process of computing position location by doubly integrating the acceleration of a point whose position is to be determined. It shows the signal of acceleration being integrated once to determine velocity and again to obtain the position” (Savage, Reference Savage2000).
It is well known that in inertial navigation all gyro and accelerometer technologies suffer from measurement noise and this may interfere with the navigation solution. Figure 2(a) illustrates the frequency spectrum composition of the errors in the inertial sensor signals. The system error can be divided into long-term errors (low frequency components) and short-term errors (high frequency components). The short-term errors have white noise characteristics while the long term errors are characterized by correlated noise (Nassar and El-Sheimy, Reference Nassar and El-Sheimy2005). Figure 2(b) shows that the long-term errors are reduced by updating the integration filter with position and velocity derived from a Global Positioning System receiver (GPS) (Skaloud, Reference Skaloud1999).
Figure 2. Schematic plot of inertial signal in frequency domain. (a) Original signal; (b) After integration with GPS. Note: Figure is not to scale, fs denotes sampling frequency. (After Skaloud, Reference Skaloud1999.)
Researchers have tried to improve the accuracy of navigation by denoising the raw IMU data. Many studies have tried to develop a perfect denoising algorithm to remove the unwanted noise but preserve the true motion dynamic signal. The wavelet approach and AR model were applied (Nassar, Reference Nassar2003; Xing et al., Reference Xing, Cong and Qin2010) and threshold wavelet was tried on an INS/GPS integrated system (Wu et al., Reference Wu and Yang2007). Also, a cascade denoising algorithm (Chiang et al., Reference Chiang, Hou, Niu and El-Sheimy2004) and Butterworth-LPF was designed for INS heading data (Guo et al., Reference Guo, Yu, Liu and Ning2004). Most researchers have focused on the development of denoising algorithms without considering its interaction with the INS algorithm.
The numerical integral process is the main step in the INS algorithm (i.e. INS mechanization) and the integral step can be regarded as a kind of low-pass filter (Xie, Reference Xie2009). It was just mentioned that certain amounts of the short-term errors could be reduced by the numerical integration process of the INS mechanization (see Figure 3) and no thorough study was made of it. The actual effect of the integral step in the INS algorithm should be more significant and complex than described in Figure 3.
Figure 3. Schematic plot of frequency spectrum of INS errors in GPS/INS integration. (After Bruton et al., Reference Bruton, Schwarz and Skaloud2000.)
Figure 4 gives a simple example of the integral. The simulated white-noise was firstly filtered by a moving-average filter (which can be regarded as a low-pass filter), as shown in Figure 4(a); then both the original noise and the filtered noise were integrated and became a corresponding random walk process, as shown in Figure 4(b). The results indicate that the integral output of the de-noised data was almost same as that of the original white noise. This is straightforward but firm evidence that the signal denoising cannot improve the integral results.
Figure 4. The effect of the denoising made by a moving-average filter.
The objectives of this paper are to model the integral step in the INS mechanization and to find out how the integral step in INS algorithms impacts the effect of the IMU denoising.
2. MODELING AND ANALYSIS
The integral step in the INS algorithm and the denoising step are the main objectives to be studied in this paper. The model of the integral step and denoising step will be described and the frequency domain analysis will be made in the following section.
2.1. Model of the Integral Step
The integral step can be built by the following steps. Firstly, the continuous-time unit step function u(t) is well known as
 $$u(t) = \left\{ {\matrix{ {0,} & {t \lt 0} \cr {1,} & {t \gt 0} \cr}} \right.$$
According to the definition of convolution integral, there is:
 $$f\,(t) * u(t) = \int_{ - \infty} ^{ + \infty} {\,f\,(\tau )} \cdot u(t - \tau )d\tau = \int_{ - \infty} ^t {\,f\,(\tau )} d\tau $$
Therefore, the integral step can be modelled as the convolution with a Rectangular window function (see Figure 5)
 $$h_{Integral} (t) = u(t) - u(t - T)$$
where, T is the time length of integral.
And
 $$\eqalign{\,f\,(t) * h_{Integral} (t) = & \int_{ - \infty} ^{ + \infty} {\,f\,(\tau )} [u(t - \tau ) - u(t - \tau - T)]d\tau \cr = & \int_{ - \infty} ^{ + \infty} {\,f\,(\tau )} u(t - \tau )d\tau - \int_{ - \infty} ^{ + \infty} {\,f\,(\tau )} u(t - \tau - T)d\tau \cr = & \int_{ - \infty} ^t {\,f\,(\tau )} d\tau - \int_{ - \infty} ^{t - T} {\,f\,(\tau )} d\tau \cr = & \int_{t - T}^t {\,f\,(\tau )} d\tau} $$
Figure 5. Rectangular window function as the model of integrator.
At the same time, the Rectangular pulse function r(t) (Figure 6(a)) and its frequency-domain expression (Figure 6(b)) are:
 $$r(t) = \left\{ {\matrix{ {1,} & { - \displaystyle{T \over 2} \lt t \lt \displaystyle{T \over 2}} \cr {0,} & {others} \cr}} \right.$$
and
 $$R(\omega ) = T \cdot Sa\left( {\displaystyle{{\omega T} \over 2}} \right)$$
Function Sa(x) is defined as Sa(x)=sin x / x.
Figure 6. Rectangular pulse in time-domain and frequency-domain.
Then the relationship between the integral model and the rectangular pulse function should be:
 $$h_{Integral} (t) = u(t) - u(t - T) = r\left( {t - \displaystyle{T \over 2}} \right)$$
 $$H_{Integral} (\omega ) = R(\omega ) \cdot e^{ - j\omega {\textstyle{T \over 2}}} = T \cdot Sa\left( {\displaystyle{{\omega T} \over 2}} \right) \cdot e^{ - j\omega {\textstyle{T \over 2}}} $$
Here T is the time length of the integral. H Integral(ω) is the Fourier transform of h(t) and its amplitude-frequency response is represented in Figure 7.
Figure 7. Amplitude-Frequency Response of the integrator. (Here ω c1 is the first zero-crossing.)
2.2. Model of the Denoising Step
The denoising filter can be represented by a continuous-time ideal low-pass filter (LPF) with a cut-off frequency ω c2. The LPF is a simple but representative denoising method, which makes the theoretical analysis both convincing and easy to understand. It is a linear time invariant (LTI) system that passes complex exponentials ejωt for values of ω in the range −ω c2 ⩽ ω⩽ ω c2 and rejects signals at all other frequencies (Oppenheim et al., Reference Oppenheim, Willsky and Hamid1996). That is to say, the frequency response of an ideal continuous-time low-pass filter is
 $$H_{LPF} (\omega ) = \left\{ {\matrix{ {e^{ - j\omega t_0},} & {\left| \omega \right| \leqslant \omega _{c{\rm 2}}} \cr {0,} & {\left| \omega \right| \gt \omega _{c{\rm 2}}} \cr}} \right.$$
as depicted in Figure 8.
Figure 8. Frequency Response of ideal low-pass filter.
2.3. Model of integral with denoising
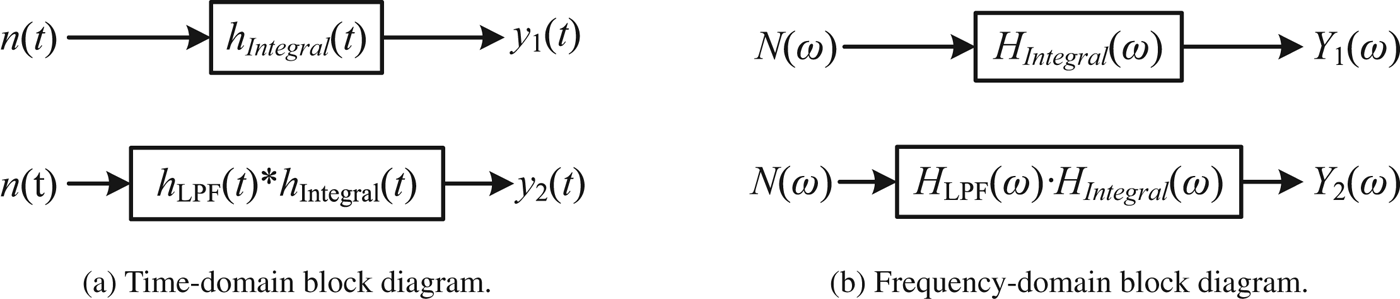
The case of original signal integrated by the integrator directly and the case of original signal denoised firstly and then integrated by the integrator are simplified as the system block diagrams in Figure 9. And the time-domain and frequency-domain block diagram of both cases are expressed in Figure 10 according to the characteristics of convolution (Zheng et al., Reference Zheng, Ying and Yang2000).
Figure 9. Simplified system structures of the INS algorithm without/with denoising.
Figure 10. Time-domain and Frequency-domain block diagrams without/with denoising.
Here
n(t) is the original signal
h(t) is the unit impulse response function
y(t) is output of the system.
N(ω), H(ω) and Y(ω) are the frequency-domain transformations of n(t), h(t) and y(t) respectively. The subscripts 1 and 2 are representations of the case without denoising step and the case with the denoising.
According to the previous description, the transfer function of the integrator is H Integral (ω) (Equation 8) and its first zero crossing of the waveform in frequency-domain is ω c1 (see in Figure 7). The transfer function of the low-pass filter is H LPF (ω) with a cut-off frequency ω c2. And then the frequency response of the combination of the ideal LPF and the integrator (Figure 10(b)) is:
 $$\eqalign{H(\omega ){\rm \, = \,} & H_{LPF} (\omega ) \cdot H_{Integral} (\omega ) \cr = \, & \left\{ {\matrix{ {T \cdot Sa\left( {\displaystyle{{\omega T} \over 2}} \right) \cdot e^{ \left(- j\omega {T \over 2}{\rm +} t_0 \right) },} & {\left| \omega \right| \leqslant \omega _{c2}} \cr {0,} & {\left| \omega \right| \gt \omega _{c2}} \cr}} \right.} $$
Based on the analysis above, the amplitude-frequency response of the integral step and the integral with denoising filter can be described in frequency-domain in Figure 11. Note that the frequency response of the integrator with denoising shown in Equation 10 and Figure 11(b) only presents the case that ω c1<ω c2, which is the most common case.
Figure 11. Amplitude-frequency response of the two cases.
Then the following statements can be drawn by comparing Figure 11(a) and Figure 11(b):
Firstly, the amplitude of the first side-lobe is only 0·22 times (i.e. 13 dB attenuation) the main-lobe, which can be neglected. Then the integral step is equivalent to a super low-pass filter whose equivalent cut-off frequency is ω c1, which is in inverse proportion to the integral time length (i.e. T) in the INS algorithm. Note that the integral time length here should be the independent working time of the INS, not the sampling interval of the IMU data. This is because we focused on the error characteristics of the INS. In the INS algorithm, the error of the INS will not be corrected during the IMU data interval but be continuously accumulated in the follow-up integral steps; in Global Navigation Satellite System (GNSS)/INS systems, the INS drift error can only be corrected by the GNSS external aiding after the INS works alone for some time (e.g. 1 s). Therefore the integration step interval is usually the same as the sampling interval of aiding information such as GNSS.
Secondly, when ω c1<ω c2, i.e. the equivalent cut-off frequency of the integral step is smaller than the cut-off frequency of the LPF, then the effect of the denoising will be shadowed by the integral step. For most inertial navigation applications, the integral time of the IMU is long enough to make ω c1<<ω c2. For example, the INS normally works alone for more than 1 sec, while the cut-off frequency of the denoising filter is normally higher than several Hertz since the true motion frequencies of the vehicle mainly appear in 0∼6 Hz band (Chiang et al., Reference Chiang, Hou, Niu and El-Sheimy2004).
Finally, for some static data processing such as stationary alignment of the INS, an unlimited level of denoising can be applied in principle and the conclusion does not apply because the true motion has almost no dynamics (El-Sheimy et al., Reference El-Sheimy, Nassar and Noureldin2004).
This proves that the actual impact of the integral operations to the IMU signal denoising is indeed significant, as shown in Figure 12. Any potential contribution of the IMU denoising will be overshadowed by the effect of the integral steps in the INS algorithm, for most of the application scenarios. This conclusion will be further verified by simulations and real tests in the following sections. Please note that the verification scenarios are designed intentionally in favour of IMU denoising, so as to make the overshadowing effect more convincing.
Figure 12. Schematic plot of the effect of the integral operations in INS algorithm in Frequency domain.
3. SIMULATION
Based on the theoretical analysis above, a simulation was conducted to further verify how the integral operation overshadows the contribution of the IMU denoising. A gyro sensor was chosen to represent the inertial systems, which made the simulation simple and made the results clear. Only white noise was simulated as the sensor error, which created better conditions for the signal denoising to take effect and the denoising filter was the second-order Butterworth LPF, which was a simple but typical denoising method.
We assumed that the true rotation rate of the gyro was a sine wave with an amplitude of 1°/s and the frequency of 0·1 Hz. The white noise, with bandwidth 100 Hz was assumed as the sensor error and the rate noise density of the sensor was 0·017°/s/√Hz (typical MEMS gyro parameter). Then the combination of the sine wave and the white noise formed the simulated output of the gyro (see Figure 13). The simulation time length was set as 200 sec and the sampling rate was 200 Hz.
Figure 13. The simulated gyro output.
The simulated output of the gyro was integrated after denoising by LPF with cut-off frequencies of 10 Hz, 5 Hz and 1 Hz respectively (Figure 14).
Figure 14. Signal denoised by LPF with different cut-off frequency.
Figure 15 shows the integral results with and without denoising of different cut-off frequencies to the gyro signal. The lower subplot shows the errors of the integral angles, which are random walk drifts. It indicates that there was no significant improvement of the integral angle solution though the denoising filters. The zoom-in detail in the figure also shows that the denoising step of the Butterworth filter caused some phase delay of the solution. This phase delay caused some sine wave errors as shown in the lower subplot (especially for the case of 1 Hz denoising, i.e. the green line).
Figure 15. The error of integral results with/without denoising.
The simulation result showed that the contribution of the gyro signal denoising was overshadowed by the integral operation of the angular rate from the gyro even when the cut-off frequency was as low as 1 Hz. The denoising of the gyro signal cannot improve the angle measurement, but brings side effects such as phase delay. Similar but more convincing evidence will be provided by the real test of INS stand-alone and GPS/INS.
4. REAL TEST RESULT AND DISCUSSION
Real tests were carried out using a typical Micro-Electro Mechanical System (MEMS) IMU, a tactical grade IMU and a common GNSS receiver. Here two different grades of IMUs were involved intentionally to draw a general conclusion. All the tests were static (i.e. the true motion signal was zero), which made an ideal condition for IMU denoising. The denoising approach here was again a second-order Butterworth LPF with a cut-off frequency of 1 Hz.
4.1. IMUs and GNSS receiver used in the tests
The IMUs used in tests were IMU-FSAS (http://www.novatel.com/products/span-gnss-inertial-systems/span-imus/imu-fsas), Xsens MTi-G (http://www.xsens.com/en/general/mti-g) and GNSS receiver was NovAtel ProPak-V3 (http://www.novatel.com/products/gnss-receivers/enclosures/propak-v3) as shown in Figure 16.
Figure 16. The IMUs and GNSS receiver used in the tests.
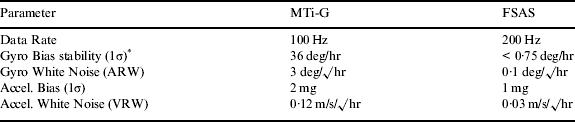
The MTi-G is based on the typical MEMS inertial sensors and IMU-FSAS is a typical tactical grade IMU. Their relevant characteristics are listed in Table 1.
Table 1. Specifications of the IMUs.

* See more specifications of the gyro in MTi-G in (Niu, 2007).
4.2. Test results of stand-alone INS
A static test was carried out collecting the IMUs' raw data from MTi-G and IMU-FSAS. The raw data of IMUs with length of more than 5 minutes was firstly filtered by a second-order Butterworth LPF with the cut-off frequency of 1 Hz (e.g. the raw and de-noised Gyro X signal in Figures 17 and 20). Then the raw IMU data (without denoising) and the de-noised IMU data were processed by the same INS algorithm respectively. The position drifts of the navigation solutions for both cases were compared in Figures 18 and 21.
Figure 17. The raw and the denoised Gyro X signal of the MEMS IMU (MTi-G).
Figure 18. The position drifts computed by the IMU data with/without denoising (MEMS grade, MTi-G).
The results showed that the position drifts were apparently nearly the same for the cases with and without denoising. The difference of position drift was calculated and is shown in Figures 19 and 22. It indicated that the difference was relatively very small compared to the position drifts in Figures 18 or 21. The denoising approach did not bring clear accuracy improvement to the INS navigation solution.
Figure 19. The difference of the position drifts (MEMS grade, MTi-G).
Figure 20. The raw and the denoised Gyro X signal of the tactical IMU (FSAS).
Figure 21. The position drifts computed by the IMU data with/without denoising (Tactical grade, FSAS).
Figure 22. The difference of the position drifts IMU data with/without denoising (Tactical grade, FSAS).
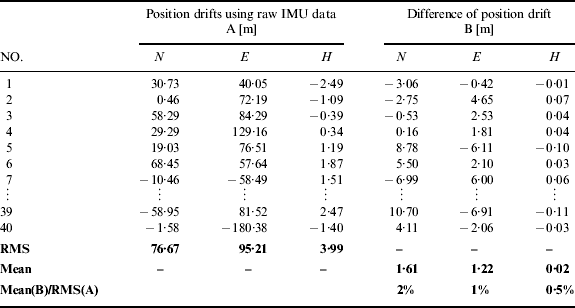
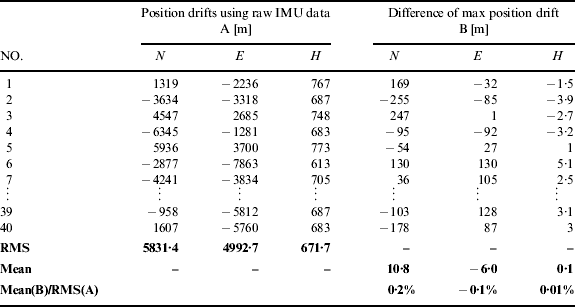
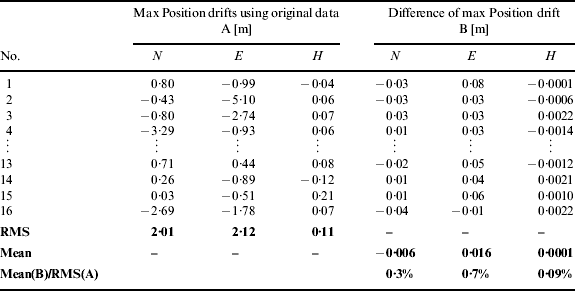
By repeating the test under the same conditions, in total 40 samples were collected for statistical analysis. Tables 2 and 3 list the final position drifts (i.e. represented by A in the table) at the end of test periods derived from the raw IMU data and the differences of the final position drifts (represented by B in the table) of all 40 tests. The mean value of the differences was calculated to check out whether the denoising can bring appreciable improvement of the navigation solution or not. The root-mean-square (RMS) of the final position drifts were set as the reference value.
Table 2. Statistical comparison of the INS stand-alone results with/without denoising (MEMS grade, MTi-G).
Note: RMS is root-mean-square.
Table 3. Statistical comparison of the INS stand-alone results with/without denoising (Tactical grade, FSAS).
The ratio of the mean of B to the RMS of A in Table 2 was around 0·1% for horizontal (i.e. sum of north and east) and 0·01% for height. Similarly, Table 3 showed that the ratio was around 1·1% for horizontal and 0·5% for height. The denoising results had both improved and degraded cases. The improvements from denoising were inappreciable for both MEMS and tactical grade cases and it could be concluded that the IMU denoising cannot improve the accuracy of the INS navigation solutions, since the integral operation in the INS mechanization overshadowed the effect of the denoising to the IMU signals as in our previous analysis.
4.3. Test results with GPS/INS integration
Static tests of 2 hours were carried out by collecting the carrier-phase differential GPS solution (DGPS) of the NovAtel ProPak-V3 GNSS receiver and the raw data of MTi-G and FSAS, to check the effect of the IMU signal denoising in GPS/INS integration situations.
The data rate of the GPS was 1 Hz and the differential GPS solution (DGPS) was derived from the measurements of the rover and the base station. The IMU data was filtered by a second-order Butterworth LPF with cut-off frequency of 1 Hz. A loosely coupled GPS/INS integration algorithm was used to fuse the IMU data (raw and the de-noised) with the DGPS solution. Note that the noise power spectral density of the denoised IMU data does not change as the LPF is a linear system (Zhu et al., Reference Zhu, Huang, Li and Mei1990). It is therefore safe to keep the same noise parameters and covariance in the Q matrix of the Kalman filter when processing the raw data and the denoised data in the GPS/INS integration algorithm.
To evaluate the essential performance of the GPS/INS solution, the position drifts were checked over periods of GPS blockages (Niu et al., Reference Niu, Zhang, Shi, Chiang and El-Sheimy2010). In total, 16 GPS outages of 60 sec were artificially added when the data was post-processed by the integration algorithm.
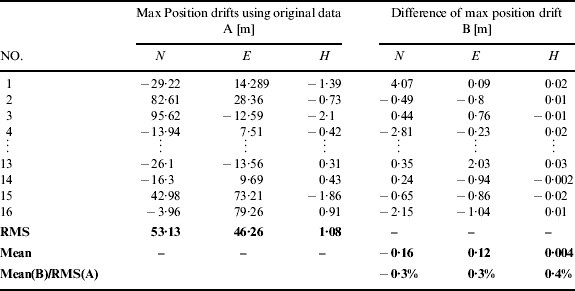
The results are shown in Figures 23 and 24. There were position drifts during the outages as expected. The position drifts of the results with and without IMU signal denoising were almost the same for both the MEMS IMU and the tactical grade IMU. The maximum position drifts (i.e. A in the table) derived from the raw IMU data in each outage period and the differences of the maximum position drifts (i.e. B in the table) were collected in Table 4 and Table 5. Both tables showed that the differences of the max position drifts derived from IMU data with and without denoising were inappreciable.
Figure 23. Position drifts of the MEMS IMU data with/without denoising with GPS signal outages of 60 sec.
Figure 24. Position drifts of the tactical IMU data with/without denoising with GPS signal outages of 60 sec.
Table 4. Statistical comparison of the GPS/INS results with/without denoising (MEMS grade, MTi-G).

Table 5. Statistical comparison of the GPS/INS results with/without denoising (Tactical grade, FSAS).
The statistical results indicate that IMU signal denoising cannot bring appreciable improvement to the navigation solution in a GPS/INS integrated system.
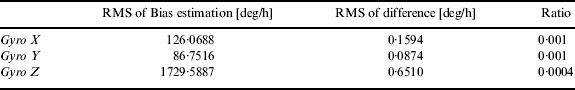
It is arguable that the Kalman filter in GPS/INS integration systems would be better at estimating the IMU sensors error (i.e. biases of gyros and accelerometers) from the de-noised IMU signals. However, it should be noted that IMU sensor errors can only be observed indirectly from the measurement information (e.g. GPS position) after the IMU data is integrated, therefore the effect of the denoising has also been overshadowed by the equivalent super-low-pass filtering effect from the integral operations. To confirm this point, the impact of the IMU signal denoising to the estimation of sensors bias was also investigated in the real test.
Figure 25 shows the estimation of gyro bias in this test. Tables 6 and 7 give the RMS of the bias estimation (derived from the original IMU data without denoising) and the RMS of the difference of the bias estimations. The ratios of the RMS showed that the differences of bias estimations were so inappreciable, that it can be concluded that the IMU denoising cannot improve the estimation of the IMU sensors error in GPS/INS.
Figure 25. Estimation of Gyro biases in the GPS/INS integrated system.
Table 6. Statistical summary of the gyro bias estimations in GPS/MEMS IMU.

Table 7. Statistical summary of the gyro bias estimations in GPS/Tactical IMU.

In addition, although the investigation of the denoising technique in this paper used a conventional low-pass filter (Butterworth filter) as an example, the conclusion can be expanded to other denoising algorithms. The bandwidth of the LPF used in the paper has been set as low as 1 Hz, and the true signals were set to have dynamics far below 1 Hz (e.g. the simulation used 0·1 Hz angle motion and the real tests used static data). Under such ideal conditions for IMU denoising and using such an extreme denoising parameter, there was still no observable improvement to the navigation results.
Generally, the time length that an INS works alone is more than 1 sec in most of INS and GPS/INS navigation systems (e.g. the data rate of GPS is 1 Hz), and therefore causes the equivalent cut-off frequency to be lower than 1 Hz. Thus the denoising technique can only make a contribution if it can remove the noise component below 1 Hz. However, signals below 1 Hz normally contain intensive true motions for most of the navigation applications. Therefore it is not able to remove or even attenuate such low frequency parts.
5. CONCLUSION
Research in this paper shows that the integral operation in INS mechanization is equivalent to a super low-pass filter that has a very low cut-off frequency (equal to the reciprocal of the INS working alone time, which is usually larger than 1 sec). Therefore it overshadows the contribution of IMU signal denoising that usually has a cut-off frequency much larger than 1 Hz.
This conclusion was confirmed by the simulation and the real tests. It implies that INS and GPS/INS navigation can not be improved by the IMU signal denoising, as long as the denoising algorithm does not manipulate the noise components below the equivalent cut-off frequency of the integral step in INS algorithms. The real test results also showed that denoising cannot improve the GPS/INS performance from the sensor error estimation perspective.
ACKNOWLEDGEMENTS
This work was supported in part by the National Natural Science Foundation of China (NSFC, 41174028), the National High Technology Research and Development Program of China (2012AA12A206), and the Fundamental Research Funds for the Central Universities (201161802020002). The authors of this paper acknowledge Dr. Zhiqin Zhu from School of Geodesy and Geomatics at Wuhan University for providing the IMU-FSAS. The authors also acknowledge Tisheng Zhang, You Li and Yahao Cheng from the GNSS Research Center for providing relevant supports.