


According to a recent Statistics Canada report (Schellenberg, Turcotte, & Ram, Reference Schellenberg, Turcotte and Ram2005), as baby boomers age there will be an unprecedented increase in the proportion of seniors in Canada. Estimates indicate that by 2031, seniors (defined in the report as anyone 65 or older) will account for between 23 per cent and 25 per cent of the total population, almost twice their current amount of 13 per cent. This increase will be the largest relative to any other age group in Canada, and strongly suggests that seniors, many of whom are baby boomers, will continue to have a large impact on Canadian society in the years to come.
Debates about what exactly this impact will be are extensive, and range from discussions about issues that directly affect seniors, such as how health and wellness will be maintained in the face of increased longevity, to issues that affect all Canadians, such as the pressure that an aging population puts on the health care system, other government services, and the Canadian labour market. An issue receiving less attention is how an aging population will impact the Canadian housing market. As the number of older Canadians increases, the Canadian residential landscape will no doubt change. Yet much less attention is being paid to understanding the factors that steer older Canadians in different residential directions in contrast to the amount of research exploring seniors’ health status, bridge employment, relationships, and financial status (Cheal, Reference Cheal2000; Légaré, Reference Légaré1998; Schellenberg, Reference Schellenberg2004; Wister, Reference Wister2005), along with work highlighting some of the overall policy responses to an aging population (McDaniel, Reference McDaniel2003). Accordingly, we know very little about how such basic characteristics as social support networks, economic factors, and the health status of older Canadians affects their dwelling-type choices, both now and in the future. Where will older Canadians choose to live as they age, and what are the specific policy implications of this? How will this affect people who search for housing in the wake of the burgeoning cohort of older Canadians?
To address this research gap, this study looked at the correlates of housing among Canadians age 55 and older. Data from the 2002 Aging and Social Support Survey (GSS16) were examined, through multinomial logit regression and cohort-component projection techniques, to identify how three factors – social support networks, health, and economic characteristics – could be expected to shape the residential choices of older Canadians in the coming years. It focused in particular on the distribution of 55-to-75-year-olds across three private-dwelling types from 2002 to 2022: (a) general community living, (b) age-restricted housing, and (c) age-restricted housing with nursing care.Footnote 1
We argue that these dwelling types can be seen as three distinct housing options for older Canadians, where the two subsequent options move progressively away from the aging-in-place model to a retirement or assisted-living community model in which much of the independence that the vast majority of older adults seek to preserve is maintained. Importantly, these latter two housing options offer an alternative housing submarket to an aging-in-place model that is set apart from long-term care in a nursing home or institution, or what Thomas and Blanchard (Reference Thomas and Blanchard2009, p. 12) viewed as a “third way” to the “false choice between institutionalization and an idealized vision of ‘home’”. Conceptualized in this way, these housing options can be seen as bridging the gap between home and institutionalization. Whereas a relatively large amount of research in both Canada and the United States has focused on aging-in-place versus entry into an institutionalized setting (Andersen, James, Miller, Worley, & Longino, Reference Andersen, James, Miller, Worley and Longino1998; Branch & Jette, Reference Branch and Jette1982; Breeze, Sloggett, & Fletcher, Reference Breeze, Sloggett and Fletcher1999; Hays, Reference Hays2002; Trottier, Martel, Houle, Berthelot, & Légaré, Reference Trottier, Martel, Houle, Berthelot and Légaré2000), this study is particularly novel for its exploration into reasons for entry into what are becoming increasingly popular alternative housing types, as well as the projected future demand for them.
Review of the Relevant Literature
In the past 25 years, the Canada Mortgage and Housing Corporation (CMHC) has either funded or written nearly 60 research reports on older adults in Canada.Footnote 2 These reports examine several topics, including the adequacy of current dwellings and their alternatives (Canada Mortgage and Housing Corporation, 1999), how different housing types affect residents (Davis, Reference Davis1991), and the efficacy of currently enacted policies in assessing the availability and affordability of suitable accommodations (Canada Mortgage and Housing Corporation, 1991; Howe, Chapman, & Bagget, Reference Howe, Chapman and Bagget1994; Maltais, Reference Maltais1992).Footnote 3
CMHC research has been well-supplemented by the work of others (Cheal, Reference Cheal2000; Légaré, Reference Légaré1998; National Advisory Council on Aging, 2006; Schellenberg, Reference Schellenberg2004; Wister, Reference Wister2005). A great deal of this research provides a good description of housing for older Canadians, but pays less attention to the factors that steer their choices. Furthermore, according to the National Advisory Council on Aging, older Canadians today range widely in terms of their physical health, their social support characteristics, and their economic resources, which suggests that their housing needs and expectations likely also vary substantially. Given that housing is a central component of well-being (Haan, Reference Haan2005; Myers, Reference Myers1990) and a primary source of retirement financial security (Alba & Logan, Reference Alba and Logan1992), it is important to identify the factors behind dwelling-type choice.
What past research on dwelling-type choice has consistently shown is that there is a general desire among older adults to grow old in their longtime homes, or to age in place. In principle, the selection of where one lives occurs against this backdrop of a preference for independent living. Despite this underlying preference, it is clear that some seniors do eventually move away from their longtime homes and choose alternative housing options. A number of authors have attempted to understand, theoretically, the reasons for this migration (Golant, Reference Golant, Scheidt and Windley1998; Litwak & Longino, Reference Litwak and Longino1987; Wiseman, Reference Wiseman1980). However, Wiseman’s model of migration is perhaps most relevant to this study given its emphasis on the individual resources and constraints, including, most importantly, the changing health, social support networks, and economic characteristics of older Canadians we have noted. In broad terms, Wiseman’s model of migration suggests how different “triggering mechanisms”, such as retirement or a shrinking support network, provide motivations that interact with individual characteristics that together influence living arrangement decisions. In this article, we employ a simplified version of Wiseman’s model, focusing on the individual “push” factors that are available in the GSS data (in this case, social support networks, health, and economic resources) which, according to Wiseman, have a significant guiding influence on an individual’s likelihood to move. Theoretically, each of these factors, elaborated on more fully later in this article, constitute individual characteristics that should, in part, steer choice of dwelling type.
Although little multivariate research on age-restricted housing has been conducted in Canada, research from the United States provides some indication of how individual characteristics might predict choice of dwelling type in Canada. Schafer (Reference Schafer2000) has shown that roughly seven per cent of Americans aged 70 and over (about 2 million people) who live outside of institutions reside in age-restricted housing. Of these, just under half have access to on-site nursing care. However, the percentage with access rises with age, and approaches 70 per cent of all seniors aged 85 to 89. What is interesting about this rise is its relative insensitivity to several socioeconomic characteristics. According to Schafer, income, wealth, education, and even need for assistance do not strongly influence the likelihood of choosing age-restricted housing with nursing care as a dwelling option. This is despite the fact that age-restricted communities can be a costly alternative to publicly funded institutions. Instead, many seniors move to this form of housing with the expectation of future disabilities, to take advantage of other services offered, or to be in an environment supportive to those living alone (Schafer, Reference Schafer2000). Consequently, it is not only characteristics in the present that matter, but also the prospect of future changes that should be considered when trying to understand and anticipate the housing choices of older Canadians.
Despite the relative insensitivity between personal characteristics and choice of dwelling found by Schafer, the relationship between individual characteristics and type of housing should become more evident later in life, when vulnerabilities in health, social support networks, or economic characteristics manifest themselves most directly. A person’s living circumstances (including dwelling place) are therefore a product of an accumulation of events and characteristics of an individual across the life span. In this respect, to get a full picture of dwelling-type choices for older Canadians, it would be necessary to have access to an individual’s complete life history. Although this information exists for some other countries (such as the British Cohort Studies in the United Kingdom), most of the time it is necessary to rely on less-detailed information, such as that provided in a single cross-sectional survey, operating under the assumption that current characteristics are the products of differences across the life course.
The Determinants of Dwelling Choice
As mentioned, the growing diversity of older Canadians suggests that the seniors of today and tomorrow will be distributed differently across dwelling types. On the one hand, seniors today are in better health, they are more affluent, and they remain in the workforce longer; on the other hand, some aspects of their social support networks are shrinking, some of their health characteristics are deteriorating, and a significant percentage live in poverty. In the following sections, we examine how these factors, which we group into social support, health status, and economic characteristics, might predict the housing choices of seniors, both now and in the future. In particular, we draw on U.S. literature on this topic, since comparatively little work on the determinants of dwelling choice of seniors has been conducted in Canada, even though there are likely to be some differences between the two countries.
Social Support. Research on the potential determinants of dwelling type among older adults in the United States has yielded several interesting results. For example, roughly 30 to 40 per cent of U.S. baby boomers are expected to lack a spouse upon reaching retirement, compared to 20 to 25 per cent for their parental cohort (Easterlin, Schaeffer, & Macunovich, Reference Easterlin, Schaeffer and Macunovich1993). Therefore, the proportion of U.S. seniors living alone will increase in the coming years, carrying with it important implications for the availability of spousal care. Typically, spouses are the principal providers of personal care in old age (Easterlin, et al.), and without spousal care, we might expect a growing number of older adults to choose housing options with support services like nursing or constant care.
It is not only the presence of a marital partner that matters for the availability of spousal care, but also the spouse’s capacity to provide care. In the past, when there was often a significant age gap between husbands and wives (husbands were usually older), it was fairly commonplace for one partner to care for the other (Lakdawalla & Schoeni, Reference Lakdawalla and Schoeni2003). Today, however, age gaps appear to be shrinking (Lakdawalla & Schoeni), suggesting that the “caretaker spouse model” will become less prominent over time, once again necessitating alternative housing options. It is difficult to anticipate how this might look, except that perhaps there will be a weakening of the link between the presence of a partner and avoidance of nursing care.
Additionally, with fertility declines across cohorts, family size is shrinking. This too has implications for personal care, since adult children are significant providers of personal care for their parents (Breeze et al., Reference Breeze, Sloggett and Fletcher1999). At the same time, the number of siblings among older Canadians remains relatively high, perhaps offsetting the shrinking number of potential adult children caretakers. These social support networks (most notably the presence of a partner, the age gap between partners and the presence of children as caretakers) and their availability are often found to be among the strongest predictors of dwelling-type choice among older Americans (Andersen et al., Reference Andersen, James, Miller, Worley and Longino1998; Branch & Jette, Reference Branch and Jette1982; Breeze et al.). Furthermore, the effects of these characteristics might vary by gender, pointing to the possibility of an interaction between sex of respondent and social support networks.
These expectations stem from U.S. research, but preliminary evidence points to parallel findings for Canadian seniors. In a report prepared by the National Advisory Council on Aging (2006), it was found that the percentage of seniors living alone has steadily increased, as has the number of individuals living with unrelated persons (Légaré, Reference Légaré1998). We also see similar trends in Canada with respect to diminishing age differences between partners (Wu, Reference Wu1998), as well as couples having, on average, fewer children relative to earlier generations (Devereaux, Reference Devereaux1990). We should expect, then, that weak social support networks (measured as no partner present, and few or no children or siblings) will positively predict residence in age-restricted housing (both with and without nursing care), and that the popularity of these two residence types will increase across the projection period due to the shrinking support networks of seniors in the future.
Health. Although Canada’s seniors today are widely expected to be the healthiest, longest-living generation ever (Martel & Bélanger, Reference Martel and Bélanger2002; National Advisory Council on Aging, 2006), there are some aspects of seniors’ health that are deteriorating. For example, there have been modest increases in certain types of diseases like arthritis, rheumatism, and diabetes (National Advisory Council on Aging), obesity (Wister, Reference Wister2005), and certain forms of cancer (Martel & Bélanger, Reference Martel and Bélanger2002), suggesting that there may be a growing demand for nursing care in the future. In addition, today’s seniors can expect to outlive any generation in history. According to Turcotte and Schellenberg (Reference Turcotte and Schellenberg2007), life expectancy at age 65 exceeds 85 for women and 82 for men, which is a two-year increase from 1981 and nearly a six-year increase from 80 years ago. Due to these changes, there is good reason to look more closely at the effect of health characteristics on choice of dwelling type (Crossley & Ostrovsky, Reference Crossley and Ostrovsky2003).
The importance of health status as a predictor of dwelling type receives further support from both U.S. and Canadian studies. U.S. research indicates that several events, such as recent short-term hospitalization or a change in functional status, strongly predict whether older Americans will enter into a long-term residential institution (Andersen et al., Reference Andersen, James, Miller, Worley and Longino1998; Branch & Jette, Reference Branch and Jette1982; Breeze et al., Reference Breeze, Sloggett and Fletcher1999; Hays, Reference Hays2002). Similar results have been found in Canada (Trottier et al., Reference Trottier, Martel, Houle, Berthelot and Légaré2000). Notably, these studies focus only on entry into institutional care, and do not look at alternative housing options. Given the importance of health to the maintenance of autonomy and independence in the home, we have reason to suspect similar associations between health status and other housing options catering to seniors, such as the two age-restricted options examined here. Specifically, we expect to see higher demand for nursing care among those with failing health, as measured by self-reported health status and the Health Utility Index.
Economic Characteristics and Labour Market Outcomes. The third area of interest for this study was economic status. Housing is typically the single largest asset most individuals have upon retirement (Alba & Logan, Reference Alba and Logan1992; Myers & Lee, Reference Myers and Lee1998), so there is some reason to believe that individuals may want to, or need to, liquidate this wealth source as they age and move into an alternative housing type (Crossley & Ostrovsky, Reference Crossley and Ostrovsky2003). At the same time, due to their cost, not all private housing options are equally accessible to all seniors. For example, research from the U.S. on non-institutionalized housing shows that usage of home care is positively related to income level (Hanley & Wiener, Reference Hanley and Wiener1991; Stum, Bauer, & Delaney, Reference Stum, Bauer and Delaney1996). In Canada, Sullivan and Baranek (Reference Sullivan and Baranek2003) found that seniors who receive care in the home incur more out-of-pocket expenses than seniors living in long-term care facilities. Consequently, the economic characteristics (employment status, income, etc.) of an individual should weigh heavily on their dwelling options.
Compared to their predecessors, the wealth and employment profiles of today’s seniors appear to be changing. According to a recent study by Schellenberg (Reference Schellenberg2004), there is wide variation in the age at which Canadians plan to retire. Twenty-two percent of non-retired people aged 45 to 59 said they plan on retiring before 60, while comparable proportions said they plan on retiring between 60 and 64 (22%) or at 65 (23%). Only 3 per cent said that they plan on retiring after 65. What is perhaps most surprising is that the remaining 31 per cent said either that they do not know when they plan on retiring or that they do not intend to retire. Naturally, the transition to retirement depends heavily on economic characteristics. Although two thirds of Canadians approaching retirement age felt they were making adequate financial preparations to maintain their standard of living after they left their job, one third did not. These characteristics will almost certainly impact living arrangements. Consequently, we would expect to see that working individuals will be more likely to live in private dwellings, while retirees will be more likely to be observed in dwellings with an age requirement.
Research Questions
Drawing from this literature review, our study addressed four relevant research questions:
1) How does the availability of social support networks affect residential choices?
Evidence from the literature has suggested that weak social support networks (measured as no partner present, and few or no children or siblings) should lead older Canadians with weak support networks to find support elsewhere, resulting in a heightened popularity of age-restricted housing (both with and without nursing care).
2) What is the relationship between health status and dwelling-type choice?
Although older Canadians are healthier than ever before, health concerns continue to exist for many. Consequently, we expected to see a higher propensity for nursing care among those with lower health levels.
3) What are the economic factors behind residential choice?
Given that many older Canadians continue to work well into their senior years, they’ll continue to earn an income, and will therefore have less need for liquidating their housing wealth. For these people, we expected to see higher rates of general community living, while retirees would be more likely to be observed in dwellings with an age requirement.
4) How will these characteristics shape the housing profiles of older Canadians from 2002 to 2022?
Although understanding the relationship between individual characteristics and dwelling type was a major focus of this study, we were also interested in determining how these characteristics would impact the residential distribution of older Canadians in the future. To achieve this, we performed a series of 20-year projections.
Methodological Approach
The Data
Data for this study were taken from Statistics Canada’s (2002) General Social Survey (GSS16), available at the Edmonton Research Data Centre. The GSS16 target population was all persons 45 years of age and over residing in Canada, excluding residents of Nunavut, the Yukon and Northwest Territories, residents of Indian Reserves, members of the Canadian Armed Forces, and full-time residents of institutions (including public retirement dwellings). Computer-assisted telephone interviewing (CATI) was used to collect answers from a random sample of survey respondents (N = 24,855).
One of the major limitations of the GSS16 for identifying dwelling type among older Canadians is that it did not look at people living in public retirement dwellings. From a policy perspective, it would be useful to isolate the determinants of public retirement home dwelling, but unfortunately this lay outside the scope of our study. Therefore, the roughly seven per cent of retired Canadians living in these institutions (Turcotte & Schellenberg, Reference Turcotte and Schellenberg2007) were not included in the analysis.
The Sample
In addition to the restrictions we have noted, the sample for this study was further refined by focusing on non-proxy respondents aged 55 and over.Footnote 4 We chose non-proxy respondents both because of concerns about the reliability of information provided from another source, and because some key information like health status was missing for proxy respondents. The reason for limiting our sample to those aged 55 and over was that the two questions we used to define our dependent variable were only asked of individuals in this age range. Together, these variables referred to whether a person lived in a dwelling with a minimum age requirement, and whether there was nursing care available in their dwelling, allowing us to construct a three-category dependent variable (discussed more fully later).
As is always the case in secondary data analysis, we had no control over the questions asked in the survey. Ideally, we would have preferred to have more detail on the types of dwellings in which older adults choose to live, including information on public retirement institutions. However, the survey did provide information on two important dwelling characteristics: age restrictions and availability of care. In addition, it is fortunate that the data came from a large nationally representative sample, thereby allowing us to generalize our findings to this age segment of the non-institutionalized Canadian population.
Our final sample restriction was that we selected only those respondents with valid values on all variables in the analysis, which reduced our sample size from 17,680 to 15,755 observations. The only exception to this rule was for income, where over 4,000 respondents did not know their income, and another approximately 3,200 did not state their income. To retain these respondents, we reset their income to 0, and created a dummy variable to indicate whether a person did not report their income.
Dependent Variable
The outcome of interest is a three-category variable constructed out of two questions from the GSS16: (a) “Are you now living in any kind of senior’s housing where minimum age is restricted?” and (b) “Is nursing care available in your dwelling?” These questions were used to construct three categories that identified whether a person lived in a dwelling without a minimum age requirement (0), if they lived in a dwelling with a minimum age requirement but no available nursing care (1), or if there was a minimum age requirement and available nursing care in their dwelling (2). These categories were mutually exclusive, in that no age requirement (0) contained individuals both with and without nursing care, and the other two values denoted the two possibilities for dwellings with an age requirement. Unfortunately, the GSS did not ask what the age requirement was or the nature of nursing care that was available.
Focal Predictors
The data have provided rich information on a number of characteristics shown in the literature to be relatively strong predictors of dwelling-type choice. These variables were entered in blocks in multinomial logistic regression models to examine the contribution of each block as predictors of dwelling-type choice. Model 1, the baseline model, included only control variables, whereas Model 2 added social support characteristics, Model 3 considered health status (social support was removed), Model 4 considered economic well-being and labour force status (without social support or health status), and Model 5 incorporated all of the variables, including controls, on dwelling-type choice. For each model, living in non-age restricted housing was the reference category.
Social Support. With the first of our four main research questions in mind, we incorporated four variables to assess access to social support networks. Presence of partner was a dichotomous variable, categorizing respondents who did not have a spouse or partner living with them in the household (0) and those who did (1). Age difference between partners was coded in years, with a positive number indicating that the respondent’s spouse/partner was older, a negative number indicating the opposite, and zero if there was no age difference.Footnote 5Number of children was a continuous variable measured in real numbers, based on questions asking respondents how many daughters or sons they had raised that were still living. Number of siblings was based on questions asking respondents how many brothers or sisters they had that were still living.
In addition to these “main effects”, we also tested several interaction terms between the gender of the respondent and their social support characteristics, given the wide differences that have been shown to exist between the way men and women rely on their social support networks for personal well-being (Forthofer, Janz, Dodge, & Clark, Reference Forthofer, Janz, Dodge and Clark2001; Kendler, Myers, & Prescott, Reference Kendler, Myers and Prescott2005). Consequently, the aforementioned variables were combined with the dichotomous sex variable to create interaction terms.
Health. To answer our second research question, three variables were used to assess the health status of respondents. Health was based on the Health Utility Index (HUI). The HUI is a health status measure designed to assess an individual’s overall health based on eight attributes: vision, hearing, speech, mobility, dexterity, cognition, emotion, and pain and discomfort. The index is defined such that scores of 1.00 represent perfect health and scores of 0.00 represent “death”. (For more information on the HUI, see Roberge, Berthelot, & Wolfson, Reference Roberge, Berthelot and Wolfson1995). In response to the question, “During the past month, did you often (0), sometimes or rarely (1) or never (2) exercise or participate in sports, such as golf, swimming or curling?” answers were used to assess respondent’s recent level of physical activity.Footnote 6 Additionally, we included self-rated health information to accompany the more objective Health Utility Index.
Economic Characteristics and Labour Market Outcomes. Three variables were used to assess the economic well-being and labour force status of respondents. Income, which we logged due to its non-normal distribution, was based on the question, “[w]hat is your best estimate of your total personal income, before deductions, from all sources during the past 12 months?” Employment status was based on a question asking respondents how many hours per week they usually worked at a job or business. The variable was coded as two dummy variables, one for individuals working part-time (between 1 and 29 hours per week), and the other for full-time workers (30 or more hours per week), leaving those who were not working as the reference group. We also included retirement status and years since retirement as a predictor of dwelling type, with persons that were not retired as the reference group.
Analysts face a number of methodological issues when attempting to define retirement status, largely because of the uncertainty around defining retirement. For some, retirement means complete withdrawal from the labour force, while for others it entails remaining partly or even fully active in the labour market (Bowlby, Reference Bowlby2007). For the purposes of our analysis, we utilized a broad definition of retirement in order to capture respondents who reported being retired and have either (a) disengaged from the workforce entirely; (b) scaled back the number of hours that they worked; or (c) changed jobs and taken a noticeable drop in earnings.
Based on this definition, retirement status was derived from several of the survey questions. First, individuals who said that their “main activity” during the past 12 months was “retired” were immediately identified as a retiree. Subsequently, individuals who did not identify their main activity as retired were asked “Have you ever retired?” Those who said “yes” to this question were also identified as retirees. Admittedly, retirement is very difficult to define, and given the ambiguity around the term, we believe that our definition is workable, since it not only categorizes individuals who are not working as retired, but also categorizes those who are working but report being retired or having previously retired as though they are retired. Although the definition could be criticized for being too broad, research using this definition has recently been published by Statistics Canada (Schellenberg et al., Reference Schellenberg, Turcotte and Ram2005).
Controls Common to All Models. In addition to our three explanatory “clusters”, we know from previous research that the living arrangements of older adults vary depending on a variety of socio-demographic factors. Therefore, we controlled for the effects of several other variables in order to assess accurately the effect of the primary predictor variables on dwelling type. Age was listed in years, and included both as a linear and a quadratic term. Sex was coded as male (0) and female (1). Immigrant status was derived from the question “In what year did you first come to Canada to live permanently?” and coded into native-born (0), immigrated prior to 1990 (1), and immigrated during or after 1990 (2). Area of residence was coded as urban (0) and rural (1), according to Statistics Canada’s rural-urban definition.Footnote 7Area of residence was a categorical variable, with four categories (East of Quebec, Quebec, Ontario, and West of Ontario, with Ontario treated as the reference category). Education was coded into five categories: university graduate, college graduate, some university/college, high school, and less than high school (the reference category), and was derived from the question, “What is the highest level of education that you have attained?”
Multinomial Logit Regression
To predict the distribution of seniors across the three residence types, multinomial logit regression was used. This procedure is appropriate for assessing the effects of either categorical or continuous predictor variables on an outcome variable with three or more unranked categories, while simultaneously controlling for the effects of other variables. The procedure yields relative risk ratios, which are the exponential values of multinomial regression coefficients, and are similar in interpretation to odds ratios in a logistic regression. Each coefficient reflects the effect of a particular characteristic on a dwelling type, relative to living in housing without an age requirement. Ratios of less than 1.00 indicate a reduced likelihood of living in housing with an age requirement and no nursing care or housing with an age requirement and available nursing care, whereas ratios greater than 1.00 indicate an increased likelihood.
Despite its appropriateness, multinomial logit regression does have its disadvantages. Foremost among these is the large number of coefficients, which can encumber interpretation. This was further complicated by our use of several interaction terms (discussed earlier). As a partial remedy to this, following the presentation of the regression results, we report the projected probabilities for each age across the three dwelling types. To address the complex survey design, 200 bootstrap weights provided by Statistics Canada were used to estimate variance.Footnote 8
To assess model fit, we assessed Akaike’s Information Criterion (AIC), a fairly common maximum likelihood-based measure for complex survey data. AIC was developed by Hirotsugu Akaike in 1974, and is a measure of the goodness of fit of an estimated statistical model. It is a relative measure of the information lost when a given model is used to describe a calculable process. Note that AIC is not used to test hypotheses, but it is instead used to test between models, and therefore is appropriate for model selection. Within a given data set, several competing models may be ranked according to their AIC, with the model that has the lowest AIC being the best fit (Burnham & Anderson, Reference Burnham and Anderson2002). To assess the statistical significance of the difference between models, differences between two AIC scores can be assessed as a chi-square distribution with model A minus model B degrees of freedom. Notably, all of the models in the analysis except health and economic characteristics (models 3 and 4) differed significantly.
Population Projections
As we discussed in the introduction, the prospect of a burgeoning older population introduces the possibility of different demand profiles for the three focal residential options examined here. In 2002, approximately 96 per cent of the GSS sample lived in a dwelling that had no age requirement or nursing care, with the remainder almost evenly divided between age-restricted housing without (2.5%) and with nursing care (1.5%). To identify whether this distribution will change in the coming years, we performed some projections, using the estimated multinomial logit regression coefficients to predict the distribution across the three dwelling types (lives in a dwelling without an age requirement, lives in a dwelling with an age requirement but no care, and lives in a dwelling with an age requirement and nursing care), while adjusting each age cohort by its survival rate. In the following sections, we first describe the cohort-component projection techniques (O’Neill, Balk, Brickman, & Ezra, Reference O’Neill, Balk, Brickman and Ezra2001), and our modification to these techniques, then we apply it to the GSS sample.
Step 1: Aging the Sample. The first step of the cohort-component model involved calculating the number of survivors at the end of each projection interval, using information that exists at the “launching date”, or the year from which observed data exist (2002 in this case). This was done for every year of the projection period, providing future estimates of cohort size. For example, aging the population 20 years into the future was done by taking each age group of the population and simply adding the appropriate number of years to their total. Here we proceeded in one-year intervals, producing 20 projection data points in total. Given data scarcity for those over the age of 75 in 2002, we were only able to project dwelling type for those aged 55 to 75 in 2002 (who will be 75 to 95 in 2022).
Although modeling the aging process is itself fairly simple, it is complicated by the fact that individuals complete various phases of their life course as they age. For example, as a person enters into his/her 60s, he/she will increasingly enter into retirement, signalling a change in employment status, earnings, and so on. Furthermore, as aging continues, health will likely begin to deteriorate. Both these and other factors will place individuals in a different position for housing, thereby altering their needs and preferences.
In an attempt to address this, a vector of “time-varying” variables was created, each assuming new values over the span of the projection period. These variables were retirement status (including years since retirement), income, and health status. In an instance where an age cohort’s value on a particular variable changes as they age, the new value was set to that of the same age group in 2002. To illustrate with an example, a person who is 55 years old in 2002 will be 75 in 2022, and will be much more likely to be retired at the second point in time. To incorporate this into our projections, we changed this person’s retirement propensity to that of a 75-year-old in 2002. We did the same for years since retirement, health status, and income, allowing us to retain realistic values on all independent variables. Although this has the limitation of assuming no cohort effects for these characteristics, it is likely to yield more accurate estimates than continuing to use baseline projection data.
Step 2: Adjusting the Survival Rates. After aging the population, it was necessary to adjust the size of each age group by their projected probability of survival. This was done by applying age- and sex-specific survival rates to each cohort of the launch year population. We applied national-level sex- and age-specific survival rates, taken from Statistics Canada’s official life tables (http://www.statcan.ca/english/freepub/84-537-XIE/tables.htm), and multiplied them by the number of years in each projection. For example, a male who was 55 in 2002 has the following future probability of survival:
Sex-specific survival probabilities were calculated for each single-year age cohort, and the size of each group was adjusted based on the expected rate of survival. Ideally, this could be done across many mortality risk factors (health, mobility, wealth, etc.), but unfortunately we do not have access to such a comprehensive database. Consequently, a limitation of this study is that, as with most cohort-component projections, we must assume that age and sex are the only two factors shaping mortality risk.
Removing the appropriate number of people by age and sex for each year’s projection was achieved by adjusting population weights by each sex and age cohort’s survival probability. For example, if a 55-year-old female in the GSS in 2002 had a population weight of 150 (implying that her record represents 150 people in the population), then the number of people that she represents surviving to the end of 2003 would be the population weight multiplied by the survival probability (px in a life table) of a 56-year-old woman, which is 0.9959, yielding 149.385 people (150*0.9959). This “new” weight, which we call the survival weight, was then used to estimate the number of surviving people in an age cohort.Footnote 9 This was done for every year in the projection, and for each of the three housing types.
Step 3: Fertility and Migration Adjustments. Beyond the mortality adjustments discussed thus far, the cohort-component method rests on two other components of population change: fertility and migration (O’Neill et al., Reference O’Neill, Balk, Brickman and Ezra2001). Since we are dealing with Canadians aged 55 and over, we reduced the number of necessary assumptions to two, since fertility is unlikely to affect our analysis of housing choice.
Migration, one of the two remaining factors behind population change, is more difficult to address. Although accurate information on interprovincial migration exists (see http://www12.statcan.ca/english/census01/products/analytic/companion/mob/tables/agegroups.cfm), it is less relevant to our study than out-migration, because an individual who moves from one province to another will still require accommodations in Canada, and will therefore remain in our sample. Research on out-migration (particularly for older Canadians) has been much scarcer, and given this lack of information, we were largely unable to address its impact on our analysis. Out of necessity, we therefore assumed no changes in our population size due to out-migration. We also assumed no mobility between provinces, an assumption that will only matter if the provinces are significantly different in terms of availability of dwelling types.
Results
Multinomial Logit Regression Results
The analysis indicated that systematic patterns existed between the choice of housing and a number of the variables common to all of the models. We focused first on the socio-demographic variables entered as controls and their associations with living in housing with an age requirement but with no available care (see Table 1, the first column of numbers). Appropriately, Table 1 shows that respondents with less than a university degree were generally indistinguishable from the reference group in their propensity to live in a dwelling with an age requirement but no nursing care. Propensities increased with age, with the quadratic term indicating that these increases did not continue indefinitely, but instead tapered off at older ages. Females were more likely than males to choose this dwelling type, and immigrants were less likely (particularly more recent immigrants). Urban dwellers and those living west of Ontario were both more likely to choose a dwelling with an age requirement and no nursing care.
Table 1: The socio-demographic determinants of dwelling-type choice among Canadians ages 55 and over, 2002

***p < .001 **p < .01 *p < .05
Source: The Aging and Social Support Survey (GSS16)
Note: The reference outcome category is housing with no age requirement.
RRR = Relative Risk Ratios.
Turning now to the risk ratios for dwellings with an age requirement and nursing care, we see fewer significant results. In fact, the only detectable differences are seen in the coefficients for those with university or college education, as well as for females, rural dwellers, and those living in Québec. None of the other results were statistically significant.
For the most part, the socio-demographic variables in Model 1 were extraneous, because our greater interest lay in determining the impact of social support networks, health, and economic characteristics on dwelling choice, to which we now turn (Table 2). Therefore, although they were included as controls in subsequent models, the risk ratios associated with each socio-demographic variable were not reported.
Table 2: The effect of social support networks, health, and economic characteristics on dwelling-type choice among Canadians ages 55 and over (2002)

***p < .001 **p < .01 *p < .05
Source: The Aging and Social Support Survey (GSS16)
Note: Included in each model are controls for education, age, age-squared, sex, immigrant status, area of residence, and region of residence. The reference outcome category across all models is housing with no age requirement.
RRR = Relative Risk Ratios.
In Table 2, we report the risk ratios across the remaining four models. Looking first at Model 2 (social support characteristics plus controls), the results show that individuals with a partner were much less likely to live in either of the types of age requirement dwellings. These findings were generally consistent with research from the U.S. Otherwise, the only other significant social support characteristic was the number of children as a predictor for requiring nursing care, and the interaction term for this variable was also significant.
Despite the fact that there were few significant results, there was a sizable increase in model fit, as evaluated with AIC. Compared to the value of 7,180 in the socio-demographic variables only model (Model 1), including social support characteristics decreased the value to 7,026 (remember that lower values of AIC are preferred), suggesting that collectively these characteristics help predict dwelling-type choice among people aged 55 and over.
In Model 3, social support characteristics were replaced by several health measures, notably the Health Utility Index score, and self-perceived levels of health and physical activity. Here we see that the Health Utility Index was a strong predictor of living in a dwelling with an age requirement. This was particularly true for housing where nursing care was available, as reflected by a relative risk ratio of 0.285. The effect of the two self-assessment measures was less clear, with only two significant results, and no discernible pattern in either case. Therefore, the Health Utility Index appears to be the strongest predictor among the health measures.
Compared to the value for the social support model, here we see a reduction in model fit relative to the previous model (Model 2), with an AIC value of 7,124. This suggests that an individual’s general health, at least as measured in the GSS, was not as strong a predictor as their social support characteristics. However, the value implied that the added information was still useful, and should be retained in future models.
Moving on to economic and labour force characteristics (Model 4), our third hypothesized cluster, we see several significant predictors of dwelling-type choice. Being employed (either part-time or full-time) cuts the probability of living in a dwelling without nursing care roughly in half, compared to general community living. Similarly, income elicited a fairly strong negative effect, as expected, with the probability of living in an age-restricted dwelling type reduced by approximately 15 per cent for every logged dollar. Those not reporting income also elicited much lower propensities for living in either type of age-restricted dwelling. Although it is difficult to be certain, this strong negative result may have stemmed from hidden resources which respondents were reluctant to disclose in a government survey. There was no retirement effect, either as a main effect or using years since retirement, on housing type.
Similar trends could be seen in the results for nursing care dwellings. In fact, the only noticeable difference was that the ratio for being employed part-time was no longer statistically significant. For the other three characteristics that were significant in the age requirement without nursing care portion of the model (employed full-time, income not recorded, and total personal income), the same general patterns emerged, except in slightly different magnitudes. Being employed full-time reduced the probability of living in an age requirement dwelling with nursing care by 75 per cent, and income had an even stronger effect, with a 24 per cent reduction for every logged dollar.
Somewhat surprisingly, given the number of significant results, was that the value here for AIC was 7,123, nearly the same as it was for the model with health characteristics (Model 3), and not a statistically significant difference in model fit. This again suggested that support characteristics were the strongest of the three predictive clusters, but that both health and economic characteristics did appear to matter. Given that this was the case, in Model 5 we present results for the full model.
Once again, most of the trends witnessed in the earlier models are evident in Model 5. In fact, aside from slight changes in the magnitude of the coefficients, the only difference from the individual models was that self-perception of very good health was no longer a significant predictor of living in an age requirement dwelling with nursing care. The full model also appeared to be the best fitting of the five, as judged by the AIC value of 6,920. Consequently, it was the coefficients from this model that we used for the population projections that are the focus for the remainder of the article.
Projection Results
The projection procedure yielded a considerable amount of information, and to make this information easier to present, we proceed in steps. In the first set of projection results, we plotted the probability of each dwelling type by age (see Figure 1). This provided the “baseline” information by predicting the age-specific probability for each dwelling type. This information was then used to estimate future distributions, which are presented separately for each of the three dwelling types.
Figure 1: Projected percentage of Canadians in three dwelling types in 2002
Source: The Aging and Social Support Survey (GSS16)
At age 55, it seemed that nearly everyone lived in the general community. Starting at about age 65, a fairly monotonic decline, however, can be seen, ending with a roughly 70 per cent probability of community living at age 95. Across most age ranges, this decline was almost equally absorbed by the two other forms of housing used here, with age requirement dwellings without nursing care being the more popular at most ages. This lead was maintained until after age 90, when the probability of living in an age requirement with nursing care edged no-nursing care as an alternative.
As one would expect given the strong preference among older adults to age in place, it is clear from Figure 1 that community living continued to be popular, even well into the later years of a person’s life. This suggests that a primary concern in the future will not necessarily be the effect of a growing number of seniors on age requirement dwellings, but for the dwellings they are already in.Footnote 10
Projected Frequencies in the Three Residential Options. Figure 1 is useful in that it provides an overview of the three different trajectories across age groups, but it does not indicate the number of individuals in each dwelling type over time. Figures 2, 3, and 4 complement Figure 1 by providing an indication of how propensities and cohort size will affect the distribution of older Canadians across the three types of housing. Remember that behind each plot lies a vector of coefficients, helping to shape the age-specific probabilities, and that projected frequencies for each dwelling type rests, in part, on these characteristics.

Figure 2: Projected number of Canadians expected to live in a dwelling with an age requirement and no nursing care, 2002–2022
Source: The Aging and Social Support Survey (GSS16)

Figure 3: Projected number of Canadians expected to live in a dwelling with an age requirement and nursing care, 2002–2022
Source: The Aging and Social Support Survey (GSS16)

Figure 4: Projected number of Canadians expected to live in a dwelling with no age requirement, 2002–2022
Source: The Aging and Social Support Survey (GSS16)
Turning first to the projections for dwellings with an age requirement and no nursing care (Figure 2), we see a relatively steady increase in the numbers of individuals up to approximately 2012, at which point a slow and steady decline begins, and can be witnessed through to 2022. Overall, however, 2022 levels are only slightly below what they were in 2002, suggesting that there is not likely to be widespread changes in the demand for age requirement dwellings without nursing care among this cohort.
Comparing Figure 2 to Figure 3, we can expect there to be a significant increase in demand for nursing care dwellings. The number of people seeking this type of housing roughly doubles over the 20-year period. Here, the peak in popularity occurs later, at around 2018-2019, when a slight decline in numbers begins to emerge. Given that the popularity of age-required dwellings without nursing care was roughly as popular in 2002 as it is expected to be in 2022 (Figure 2), we might expect that the majority of new people seeking nursing care will come from within the general community living category.
Turning to the projections for general community living (Figure 4), we see steady declines across the projection period. In 2002, there were roughly 4.5 million people ages 55 to 75 living in the general community, and projecting this number through to 2022, this number is cut in half. Consequently, by 2022, this group can be expected to be roughly half the size it was in the general community only 20 years earlier.
There are two ways to read these trends. One is somewhat in line with so-called “apocalyptic demography,” which would forecast widespread declines in housing demand in the coming years. The movement of 55-to-75-year-olds out of general community living, it could be argued, will result in a sizable increase in the housing supply, with over 2 million people expected to make their way out of general community living in the coming years. To help contextualize this number, consider the following: between 2002 and 2006, there were roughly 200,000 new housing starts per year in Canada, yielding approximately 1.2 million new dwellings in the five year period (http://www40.statcan.ca/l01/cst01/manuf05.htm). Between 2002 and 2022, we can expect increases in housing supply from new construction to be heavily supplemented by older people moving out of their dwellings.
Another aspect of these projections, and one that moderates the apocalyptic perspective, can be achieved by looking at Figures 5, 6, and 7 (particularly Figure 7), which report the projected number of people in each age group by dwelling type. There, we can see that the number of Canadians over the age of 75 increases substantially over the 20-year span across all dwelling types. This increase is dramatic in some instances – look, for instance, at the growth in the number of people aged 90 and over living in the general community in Figure 7. Although it is difficult without looking at other age groups to understand what this might mean, steady increases in numbers among this group points to growth in the number of older people living in all three types of housing. Although we might expect about half of the 55-to-75-year-old cohort from 2002 to move out of general community living, those that remain will form a much larger group than what exists today. There will be more people at older ages living in all three dwelling types than is currently the case.

Figure 5: Projected number of Canadians by age group expected to live in a dwelling with an age requirement and no nursing care, 2002-2022
Source: The Aging and Social Survey (GSS 16)
Note: Cells represent the projected number of people in each age group (in 100s) by dwelling type. Column totals are for ages 55-75 in 2002 over time.

Figure 6: Projected number of Canadians by age group expected to live in a dwelling with an age requirement and nursing care, 2002-2022
Source: The Aging and Social Survey (GSS 16)
Note: Cells represent the projected number of people in each age group (in 100s) by dwelling type. Column totals are for ages 55-75 in 2002 over time
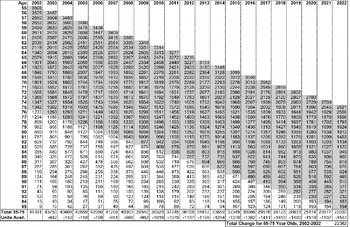
Figure 7: Projected number of Canadians by age group expected to live in a dwelling with no age requirement, 2002-2022
Source: The Aging and Social Survey (GSS 16)
Note: Cells represent the projected number of people in each age group (in 100s) by dwelling type. Column totals are for ages 55-75 in 2002 over time
To determine the future state of the Canadian housing market, and how the exodus of roughly 2 million people will affect housing supply, it would be important to look at the full age range of the population, rather than just 55-to-75-year-olds. For instance, we can see from Figures 5–7 that the future number of people aged 90 and over will grow tremendously in the coming years, suggesting that demand for all housing types among those aged 90 and over will be higher in the future than it currently is. Given this, a worthwhile question might be to ask how cohorts trailing the 55-to-75-year-olds of 2002 will offset this movement out of the general community. Will there be enough younger people to replace the roughly 2 million people aged 55 to 75 in 2002 that are projected to move out of the general community in the years to come? To what extent will this impact the price of housing? Will the Canadian housing market be prepared to handle the almost doubling of the number of people seeking age-restricted housing with nursing care? Given that we were only able to capture a portion of the baby boomer cohort (the first baby boomers are expected to turn 65 in 2011; Bélanger, Martel, & Caron-Malenfant, Reference Bélanger, Martel and Caron-Malenfant2005), how different would our projections look if we included the entire cohort?
Discussion and Conclusion
In this study, we used the 2002 Aging and Social Support Survey to identify some of the correlates of dwelling-type choice for Canadians aged 55 to 75. Guided by questions on the availability of social support, health, and economic characteristics, we were able to separately identify the factors behind living in: (a) a dwelling without an age requirement; (b) with an age requirement and no nursing care; and (c) with an age requirement and nursing care. Although each of these clusters of factors predicted dwelling-type choice, social support characteristics were found to be the most important of the three. In particular, the presence of a partner was shown to impact heavily the type of dwelling in which a person lives, with no age requirement being by far the most popular option for those with a partner. Other important factors included health (particularly Health Utility Index scores), employment status, and income. More specifically, compared to people who opted for general community living, those living in housing with an age requirement either with or without nursing care tended to have poorer health, to be not employed, and to have a lower level of income. Together, these findings correspond with precisely what we would expect based on the previous, albeit largely U.S. literature on older adults’ living arrangements as we discussed earlier. Of course, all of these factors are indicative of major life course transitions (i.e., a loss of a spouse, a decline in health, a reduction or end to employment, a decline in income) that are likely to constrain or “push” people into at least considering alternative housing types. Our findings, then, suggest that these factors may be among the most important “triggering mechanisms” that lead older adults away from an aging-in-place model.
Using the regression coefficients from a model that included all three clusters of characteristics, we also projected the future number of inhabitants across the three dwelling types. By modifying cohort-component projection techniques to allow for change in certain characteristics over time, we projected moderate increases in the numbers of people living in both types of age requirement dwellings for most of the study period, followed by a slow decline within this cohort that is likely to continue beyond 2022. Although the impact of this reduction is likely to be heavily moderated by the bulk of the baby boom cohort that will be following closely behind (our study focuses on individuals born between 1927 and 1947, and the baby boomers are generally composed of those born after this time), there is some reason to suspect an increase in supply, which might carry positive consequences for groups that are currently having difficulties in the Canadian housing market (such as immigrants).
One of the most noteworthy findings of this study is how long individuals stay in the general community. As shown in Figure 1, well over 80 per cent of individuals are expected to live in the general community well into their 80s. This suggests that the impact of Canada’s largest-ever cohort of older people (only some of which appear in this study) will continue to weigh heavily on the private, non-age requirement sector of the housing market for years to come. Even despite these high rates, however, roughly 2 million individuals who were 55 to 75 in 2002 are expected to leave general community living by 2022. This will either be due to mortality or moving into an alternative dwelling, possibly with nursing care. This suggests that housing supply may begin to increase, due to both new construction and from this age cohort beginning to move out of general community living. At the same time, future projections, however, reveal an across-the-board increase in the number of older Canadians, strongly suggesting that seniors of the future will weigh more heavily on the Canadian housing market than their current counterparts. Although the 55-to-75-year-old cohort will decline in size between 2002 and 2022, their sheer numbers will increase age-specific demand for all dwelling types in the future.
In many ways, the results of our study advance those conducted by CMHC’s Research and International Affairs Directorate (http://www.cmhc-schl.gc.ca/publications/en/rh-pr/socio/socio006.pdf), which projected housing demand for all ages up to 2011. That report argues that immigration will weigh heavily on future demand, and that future growth in housing demand will likely come from non-traditional family households (such as non-family households, multiple family dwellings, etc.). It also argues that households where the head is over the age of 45 will form an increasingly important source of demand. Although we did not assess the first two claims, we see some evidence for the growing importance of households headed by those over age 45. At the same time, we expect there to be significant declines in the numbers of people occupying certain dwelling types (particularly dwellings with no age requirement), but it is difficult to assess whether these declines will be offset by those in other age ranges. In this regard, the CMHC report provides a more comprehensive picture. However, our study is novel because we project population up to 2022 across a more diverse array of residential types, and we do so by altering several characteristics as individuals age.
As with any projection technique, we need to express caution about the accuracy of projections made into the future. We make several assumptions about how individuals age, and what will happen with their social support networks, health, and economic characteristics over the longer term (i.e., changes in their compositional characteristics), which in turn alters their distribution across the dwelling types. In addition, we assume no changes in the effects of characteristics over time, but instead posit that the effect of, say, being without siblings in 2022 would have the same effect on dwelling type that it does in 2002. Other limitations include the survival rates, which were taken from a single year (2002), and are therefore insensitive to changes in mortality rates that may occur over time. The assumption is that there is no period or cohort mortality effect, only an aging effect, and that this aging effect is constant over the 20-year projection period.
The final characteristic of this study that might hamper the inferential capacity of the results is the nature of the dependent variable. First, regarding nursing care, no formal definition of this care was provided to respondents. Second, no consistent age cut-off was provided to respondents when they were asked about whether they live in a minimum-age-requirement dwelling. Both of these omissions are very likely to introduce error or uncertainty into our derived dependent variable. Also, as mentioned several times, we do not have information on public retirement dwellings (rest homes, nursing homes, etc.), where 32 per cent of people aged 85 and over currently live (Turcotte & Schellenberg, Reference Turcotte and Schellenberg2007). An important study, then, would be one that is able to project movement into this dwelling option as well, since these dwellings become increasingly common for individuals as they age. To do so, data from either a repeated cross-sectional or longitudinal survey, which collects information on socio-demographic, social support, health, economic, and housing characteristics over many years, would be beneficial for understanding the housing careers of the soon-to-retire baby boomers and their effect on the Canadian housing market in the future. Until such data are available in Canada, we believe that this analysis has provided a practical and complementary study that helps further our understanding of the dwelling-type choices of older Canadians at present and in the years to come.


