


Introduction
Tillage has many disadvantages including increasing soil erosion potential, increasing subsurface compaction, decreasing soil C content and reducing soil quality and function (Karlen et al., Reference Karlen, Wollenhaupt, Erbach, Berry, Swan, Eash and Jordahl1994; Kladivko, Reference Kladivko2001). Despite these disadvantages, tillage is still used on 61% of national crop acreage and 51–67% of crop acreage in parts of the upper Midwest (Wade et al., Reference Wade, Claassen and Wallander2015). Use of tillage across the USA continues due to concerns about higher yields and prior beliefs supporting negative perceptions of conservation tillage, including skepticism it improves profits (Andrews et al., Reference Andrews, Clawson, Gramig and Raymond2013). Several studies support these negative perceptions, which include skepticism of environmental benefits with conservation tillage; lack of, or access to, information; and costs of new machinery (Smit and Smithers, Reference Smit and Smithers1992; Paulson, Reference Paulson1995; Davey and Furtan, Reference Davey and Furtan2008; D'Emden et al., Reference D'Emden, Llewellyn and Burton2008; Kalcic et al., Reference Kalcic, Prokopy, Frankenberger and Chaubey2014). These and other factors influencing adoption of conservation approaches are similar worldwide (Knowler and Bradshaw, Reference Knowler and Bradshaw2007; Llewellyn et al., Reference Llewellyn, D'Emden and Kuehne2012; Halbrendt et al., Reference Halbrendt, Gray, Crow, Radovich, Kimura and Tamang2014).
Some research has supported benefits of tillage; for example, tillage results in greater yields (Vyn and Raimbult, Reference Vyn and Raimbult1993). However, other research dispels these benefits. For instance, the yield benefit of tillage was found to be dependent on soil type, precipitation and geographical region (DeFelice et al., Reference DeFelice, Carter and Mitchell2006; Toliver et al., Reference Toliver, Larson, Roberts, English, De La Torre Ugarte and West2012). Tillage that promotes soil warming and drying by reducing surface coverage by crop residues (Kaspar et al., Reference Kaspar, Erbach and Cruse1990; Sharratt et al., Reference Sharratt, Benoit and Voorhees1998) might also increase decomposition and cause C loss. Using tillage to enhance the seedbed for spring planting, by improving soil structure and drainage, might be a short-lived benefit resulting in greater compaction over time (Mahboubi and Lal, Reference Mahboubi and Lal1998). Further, the reduction of weed emergence and survival with tillage (Mohler and Calloway, Reference Mohler and Calloway1992) might result in better survival and germination of buried weed seeds when they get returned to the soil surface with subsequent tillage operations (Yenish et al., Reference Yenish, Doll and Buhler1992; Forcella, Reference Forcella2003; Spokas et al., Reference Spokas, Forcella, Archer and Reicosky2007).
Low-diversity cropping systems might have disadvantages. For instance, low diversity cropping can exacerbate herbicide resistance in weeds with the repeated use of crops genetically modified to tolerate the same herbicide (Owen and Zelaya, Reference Owen and Zelaya2005), or result in over-application of herbicides, due to increased weed abundance and persistence of the weed seed bank, particularly in combination with conservation tillage (Beckie et al., Reference Beckie, Leeson, Thomas, Hall and Brenzil2008). Similar to conservation tillage, adoption of high diversity cropping systems is lagging. Nationwide crop diversity has declined since 1987 (Aguilar et al., Reference Aguilar, Gramig, Hendrickson, Archer, Forcella and Liebig2015) and it effectively is represented by the four major crops – corn, soybean, wheat and cotton (Gossypium hirsutum L.) (Wade et al., Reference Wade, Claassen and Wallander2015). Possible reasons for loss of diversity are the economic incentives of crop insurance and subsidies (Bowman and Zilberman, Reference Bowman and Zilberman2013), and greater focus on technological improvements that have decreased management complexity for dominant crops (Hendrickson et al., Reference Hendrickson, Hanson, Tanaka and Sassenrath2008). Conversely, cropping system diversity can be a beneficial cultural management strategy that can counteract the development of herbicide resistance (Beckie et al., Reference Beckie, Leeson, Thomas, Hall and Brenzil2008), mitigate weather induced instability in crop yields (Gaudin et al., Reference Gaudin, Tolhurst, Ker, Janovicek, Tortora, Martin and Deen2015) and balance economic risk (Bowman and Zilberman, Reference Bowman and Zilberman2013).
With these benefits in mind, combining diversity with reduced tillage may help counteract the loss of diversity and the negative perceptions that hinder adoption of reduced tillage. We undertook a large-scale cropping systems management experiment to determine the impacts of reduced tillage and increased crop rotation diversity on crop yields, system productivity (measured by potential gross returns) and weed dynamics. In this experiment, CT was compared with ST, a reduced zone-tillage method, in 2-year and 4-year crop rotations. We expected crop yields and total system performance to be the same, or better, when using ST in combination with a more diverse crop rotation compared with CT and a 2-year rotation. We also expected lower weed seed density with the more diverse system.
Materials and Methods
Site description
The farming systems study was established on a 3-ha area at the Swan Lake Research Farm, near Morris, MN (45°41′N, 95°48′W). Soils are primarily clay loams (USDA-SCS, 1971) that developed from glacial till and fall within the Barnes/Aastad catena. Within this experimental area, the 0–15 cm soil layer averaged 33 g kg−1 total C, 31 g kg−1 organic C, 3 g kg−1 N, 11 mg kg−1 P and 206 mg kg−1 K (Johnson et al., Reference Johnson, Archer, Weyers and Barbour2011).
A fully automated weather station, within 0.5 km of the experimental site, collected hourly precipitation and air temperatures. Climatic characteristics over the 8 years of the experiment, including precipitation, high and low seasonal temperatures and annual degree days are provided in Table 1. The 30 year (1981–2010) annual average precipitation was 672 mm, air temperatures ranged from an average of −12.2 °C in January to an average 21.4 °C in July and growing degree days averaged 1314 using a 10 °C base temperature (NOAA-NCDC, 2013).
Table 1. Average and range of climatic measurements including precipitation, temperature and total annual degree days from 2002 to 2009 at the Swan Lake Research Farm near Morris, MN compared with the 30 year average for the area.

1 NOAA-NCDC (2013).
Experimental design
The evaluation presented here focused on 48 experimental plots (6 m × 12 m) within four non-organic management systems of a larger-scale farming systems study conducted from 2002 to 2009, as described by Archer et al. (Reference Archer, Jaradat, Johnson, Weyers, Gesch, Forcella and Kludze2007) and Weyers et al. (Reference Weyers, Johnson and Archer2013). The experiment was organized as a randomized complete block design, with four replicate blocks, using a full factorial arrangement of tillage and rotation treatments, each with two-levels. The four systems compared, comprised of conventional moldboard plow + chisel tillage (CT) or strip-tillage + no-tillage (ST) and 2-year (2y) or 4-year (4y) rotations and are indicated by: CT-2y, CT-4y, ST-2y, or ST-4y. The 2y rotation was corn and soybean, the 4y rotation was corn, soybean, wheat underseeded with alfalfa and alfalfa. All crops under both rotations were grown every year, which established a single and invariable crop entry point into the rotation for each experimental plot.
Management practices
The area where this study was established was previously managed by disk tillage and cropped in a corn-soybean-spring wheat rotation, ending with soybean in 2001. Planting and harvest dates and fertilizer application rates for all crops, 2002–2009, are provided in Table 2. Row spacing for plantings were 76 cm for corn and soybean, and 18 cm for wheat and alfalfa. Starter fertilizer was used for all corn plantings, and for all soybean plantings through 2005. In CT-2y corn, a side dress of ammonium nitrate (2002–2005) or anhydrous ammonia (2006–2009) was applied in early June at rates generated by the Nitrogen Decision Aid (Olness et al., Reference Olness, Lopez, Archer, Cordes, Sweeney, Mattson, Rinke and Voorhees1999) using pre-plant soil tests; CT-4y corn received a single side-dress application of ammonium nitrate in 2002 (Table 2). Every year, wheat received a fertilizer application at planting that supplied N, P and K. Alfalfa did not receive additional fertilizer applications.
Table 2. Planting and harvest dates, and fertility management from 2002–2009 by crop or cultivar.

1 Crop variety, if common listed once, or indicated by year; P, Pioneer; DK, Dekalb, NK, Syngenta (Northrup King).
2 Wheat planted this year was Oakley.
3 Fertilizer application rates are given as actual element applied.
Field management consisted of field cultivation, row-cultivation, herbicide and insecticide application, and fall tillage with respect to tillage treatments and crops (Table 3). Field cultivation (15 cm depth) was used for seedbed preparation in all CT treatments prior to planting corn, soybean or wheat. In June of 2002, row-cultivation (10 cm depth) was used in all CT and ST corn treatments and in CT soybean treatments. In June of 2008, rotary hoeing (2.5 cm depth) was used once in all CT and ST corn and soybean treatments for weed control. Tillage in CT systems consisted of moldboard plow (20 cm depth) following corn and alfalfa, and fall CT (15 cm depth) following soybean. Tillage in ST systems consisted of fall ST, with a 20 cm deep, 10 cm wide shank spacing centered on the planting row, following all corn and alfalfa, and following 2y soybean, but not 4y soybean, which had no tillage. Wheat was not tilled in any management system as it was underseeded with alfalfa. In summation, net disturbance reach 20 cm depth in both tillage systems, but was more intense, by frequency, depth and surface coverage in CT systems than in ST systems.
Table 3. Cultivation, herbicide, insecticide and tillage activities by crop and management system from 2002–2009.

1 Abbreviations: CT-2y, conventional tillage, 2 yr rotation; CT-4y, conventional tillage, 4y rotation; ST-2y, strip-tillage, 2y rotation; ST-4y, strip-tillage, 2 yr rotation.
2 FC, field cultivation; RH, rotary hoe; RC, row-cultivation; Mow, mowing; Herb, herbicide; Pest, insecticide, MP, moldboard plow; CT, chisel tillage; ST, strip-tillage; NT, no-tillage; sp/fa tillage conducted in spring and fall.
3 Management of alfalfa here refers to the harvest year after wheat, except for 2002, which was the first year of planting for alfalfa under this entry point, when no alfalfa was harvested.
Pre-plant, in-season and post-harvest herbicides were used in all systems (Table 3). All products were applied at times and rates according to label instructions. Glyphosate was used in corn and soybean for weed control and in alfalfa for termination. Corn received applications of dicamba, mesotrione, and nicosulfuron + rimsulfuron. Bromoxynil was used in wheat and sethoxydim was applied after wheat harvest to assist the underseeded alfalfa. The only insecticide applications made were to control aphids (Family Aphididae) in soybean using applications of lambda-cyhalothrin when necessary.
Crop harvest and yields
All corn, soybean and wheat grain crops were harvested with a plot combine, and total yields obtained from the grain removed in a 1.52 m wide strip through the center of each plot. Subsamples of grain from each plot were cleaned, weighed and dried at 45 °C, to calculate clean grain dry weight. Total harvestable alfalfa forage biomass was estimated from harvested biomass composited from two 0.5 m2 subplots within each plot and dried at 45 °C to calculate total dry matter production. Alfalfa, in the second year of growth, was harvested on average three times per year, except for the 2002 entry point as insufficient biomass was produced; in this year, alfalfa was mowed three times to control weeds (Table 2). Otherwise, alfalfa was cut with a swather and baled, or a mower and hand-raked when biomass was insufficient for mechanical harvest. Final clean grain and forage weights are reported in Mg ha−1 after adjusting dry weight for US standard grain and forage test weight moisture content, which were for corn, soybean, wheat and alfalfa, respectively, 15.5, 13, 13.5 and 15% moisture.
System productivity
To compare management system productivity a common unit was needed for all yields across the rotations. Therefore, potential gross returns for each of the four management systems were calculated. This approach is similar to calculating a crop yield equivalence; i.e., crop A yield equivalent weight (to crop B) = gross sales crop A/crop B price per unit weight (Singh et al., Reference Singh, Sah, Singh, Singh and Hasan2010). Minnesota state grain and alfalfa hay prices (in US$) for the 2002–2009 marketing years were obtained from National Agricultural Statistics Service, Quick Stats Application (https://quickstats.nass.usda.gov/). Average prices in dollar amounts per Mg of yield, were used to isolate production-related effects from market effects; they were US$111 for corn, US$278 for soybean, US$175 for spring wheat and US$102 for alfalfa hay. For every year, within each replicate block, the dollar equivalent of the yield for all crops in each of the four tillage-rotation systems was calculated, summed within the system and divided by the total number of crops in the rotation. This produced a replicated data structure that allowed statistical analysis, n = 4 for each system, each year. For example, in replicate block 1, the CT-2y system productivity in US$ ha−1 = [(corn yield in Mg ha−1 × US$111 Mg−1) + (soybean yield in Mg ha−1 × US$278 Mg−1)]/ 2 . Additionally, a three-crop productivity value for CT-4y and ST-4y was evaluated to account for the lack of alfalfa harvest in 2002.
Weed seed sampling
The weed seed bank can be used as an indicator of weed populations and emergence in agricultural systems (Forcella, Reference Forcella1992; Forcella et al., Reference Forcella, Wilson, Renner, Dekker, Harvey, Alm, Buhler and Cardina1992; Buhler et al., Reference Buhler, Hartzler and Forcella1997). Weed seed bank analysis has been applied to address impacts of crop rotation and tillage management (Cardina et al., Reference Cardina, Herms and Doohan2002) and informing agricultural management of weeds (Rahman et al., Reference Rahman, James and Grbavac2001). Weed seed production is correlated with weed biomass and can represent successful competitive pressure (Wilson et al., Reference Wilson, Wright, Brain, Clements and Stephens1995; Kegode and Forcella, Reference Kegode and Forcella2006). From 2002 to 2005, we isolated in-season production of the weed seed bank by sampling the soil surface at the end of the growing season. Thus, the seeds collected were representative of the weed species that escaped control (by tillage or herbicide) and completed their lifecycle. In this sense, the weed seed analysis was a proxy measure of weed pressure likely experienced by the crop during each growing season. This approach allowed simultaneous measurements and comparisons across all system components regardless of phenological diversity of the crops and variable harvest dates. Other measures like biomass and adult plant density would not have been amenable to comparisons across such diverse crops with their differing phenologies and harvest schedules.
Immediately prior to fall tillage, twenty 6-cm diameter areas along a diagonal transect in the central 3 m of each plot were sampled for weed seeds each year from 2002 to 2005. In each area the soil surface was vacuumed using a 5 gal, 5.5 horsepower Shop-Vac®, and all seeds, debris and loose soil removed. Samples within plots were aggregated. Seeds were washed from the soil, dried and separated from debris using an air column. Seeds were identified to species and placed into one of the following groups: green foxtail (Setaria viridis [L] Beauv.), common lambsquarters (Chenopodium album L.), redroot pigweed (Amaranthus retroflexus L.) and all others, which primarily included barnyardgrass (Echinochloa crus-galli [L.] Beauv.), common ragweed (Ambrosia artemisiifolia L.), wild mustard (Sinapis arvensis L.) and wood sorrel (Oxalis stricta L.). Densities are reported as seeds m−2.
Statistics
Crop yields and potential gross returns for each management system were analyzed using a mixed model procedure (GLIMMIX), with replicate block treated as a random variable, in SAS 9.4 statistical software (SAS Institute, 2014a). Overall trends were evaluated by treating year as a random effect, which controls variability that could be due to yearly climatic differences and other unknown variables. Within-year differences were evaluated by repeating the mixed model analysis and treating year as a main effect. Multiple comparison procedures for main effects and interactions were used to identify treatment differences for planned comparisons, with a Bonferroni adjustment used when necessary. An alpha of 0.05 was used and significance established for all P < 0.05.
Total weed seed density was evaluated among crops with a mixed model procedure (GLIMMIX) in SAS 9.4, with year as a random effect and multiple comparison tests to determine differences among crops and management systems, using a Bonferroni adjustment when necessary. Total and categorical weed seed densities were analyzed within crops with a mixed model and multiple comparison procedures as above, with year as a random effect. For the preceding two analyses, data were loge(x + 1) transformed to fit normality. A regression analysis, using JMP 11 statistical software (SAS Institute, 2014b), was performed on transformed data to evaluate linear changes in total weed seed density over time within management systems. To explore further these potential changes over time, the regression analysis was repeated within crops and within entry points to the rotation. The within crop analysis would establish how weed seed densities might be influenced by specific crops. The entry point analysis would establish if a specific succession of crops in rotation influenced change over time. Entry points, established in 2002, were either corn or soybean under the 2y rotation, or corn, soybean, wheat or alfalfa under the 4y rotation. The relationship of weed seed density (total and groups) and crop yields was evaluated with a multivariate analysis to produce non-parametric (rank) correlations (Spearman's Rho, ρ) was conducted in JMP 11 (SAS Institute, 2014c). Significance was determined when P < 0.05.
Results
Crop yields
Averaged over all years, grain yields of corn were greater in CT treatments (9.2 Mg ha−1) than ST treatments (8 Mg ha−1), with no difference in yield between rotations within a tillage strategy (Table 4). Soybean grain yields averaged over all years were significantly different only between the CT-4y treatment and the ST-2y treatment, where they were 2.7 and 2.4 Mg ha−1 yr−1, respectively. Grain yields of wheat and forage yields of alfalfa did not differ between tillage strategies.
Table 4. Average annual crop yields, Mg ha−1 yr−1 (standard error) and system productivity, US$ ha−1 yr−1 (standard error), from 2002 to 2009, for the four management systems.

1 Abbreviations are: CT-2y conventional tillage, 2 yr rotation; CT-4y, conventional tillage, 4y rotation; ST-2y, strip-tillage, 2y rotation; ST-4y, strip-tillage, 2 yr rotation.
2 Lowercase letters indicate significant differences (P < 0.05) among management systems within a crop.
These overall trends were confirmed with analysis of year as a fixed effect. However, this within-year analysis indicated that differences in corn and soybean grain yields were limited (Fig. 1). Corn grain yields were different in only 3 of 8 years, but were generally higher in the CT treatments (Fig. 1a). Soybean grain yields were significantly greater in the CT-4y than the ST-2y treatment in only 1 year (Fig. 1b). Though no overall differences were found, the within-year analysis did indicate that wheat grain yields were significantly greater in the CT-4y system in 2006 (Fig. 1c). Though no differences in alfalfa forage yield occurred within years, yield did appear to decline over time (Fig. 1d). Some of these yield differences may relate to growing season rainfall (April–September), which was low from 2006 through 2009; though 2009 had the lowest total rainfall during the growing season, 2006 had the lowest annual rainfall (Table 1).
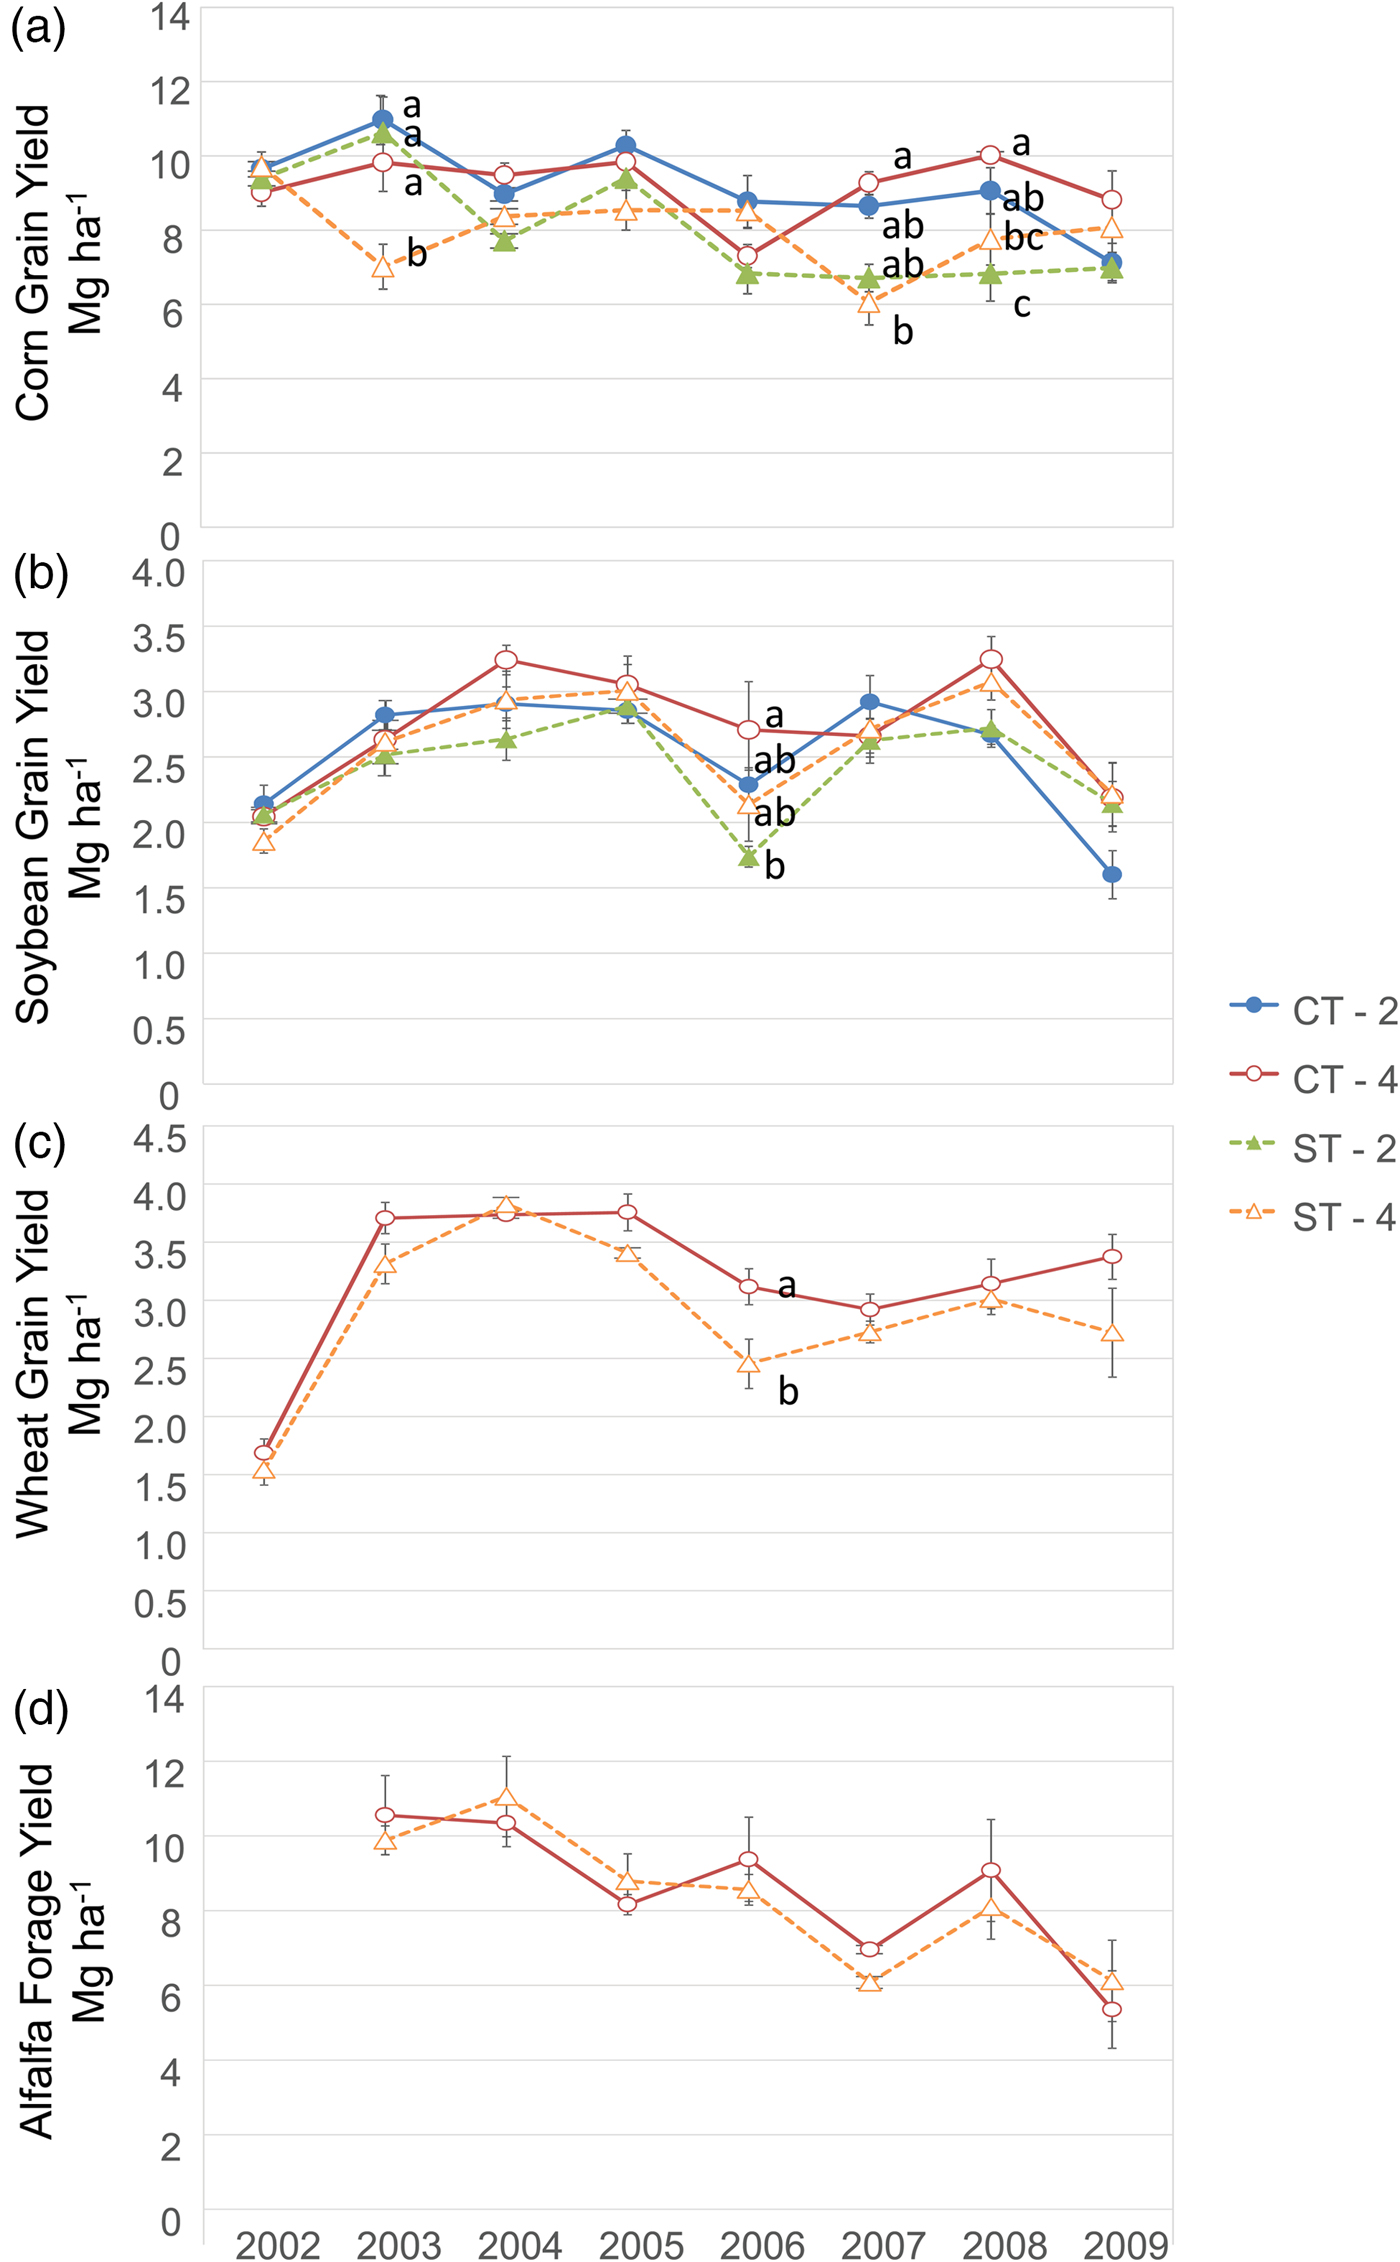
Figure 1. Average crop grain and forage yields, 2002–2009, for the fertilized management systems, (A) corn grain, (B) soybean grain, (C) wheat grain, (D) alfalfa biomass. Bars indicate standard error (n = 16); where lowercase letters appear significant difference among systems were determined (P < 0.05). Abbreviations: CT-2, conventional tillage, 2y rotation; CT-4, conventional tillage, 4y rotation; ST-2, strip-tillage, 2y rotation; ST-4, strip-tillage, 4y rotation.
System productivity
Due to significantly greater corn grain yields, potential gross returns over all years (with a random year effect) were significantly greater in the CT-2y rotation, and equal between CT-4y, and ST-2y and lowest in the ST-4y (P < 0.001) (Table 4). This pattern was consistent even when accounting for the lack of alfalfa harvest in 2002. Within years, productivity in CT-2 was similar to at least two other production systems, never differing from all three systems at once (Fig. 2). Potential gross returns were equal between CT-2y and CT-4y and between ST-2y and CT-4y in all but the first year, when alfalfa was too immature to harvest; this was true even when accounting for the lack of alfalfa by estimating returns on just the three grain crops (data not shown). Only in 2003 did productivity of one system, the ST-4y, significantly differ from all three other systems.
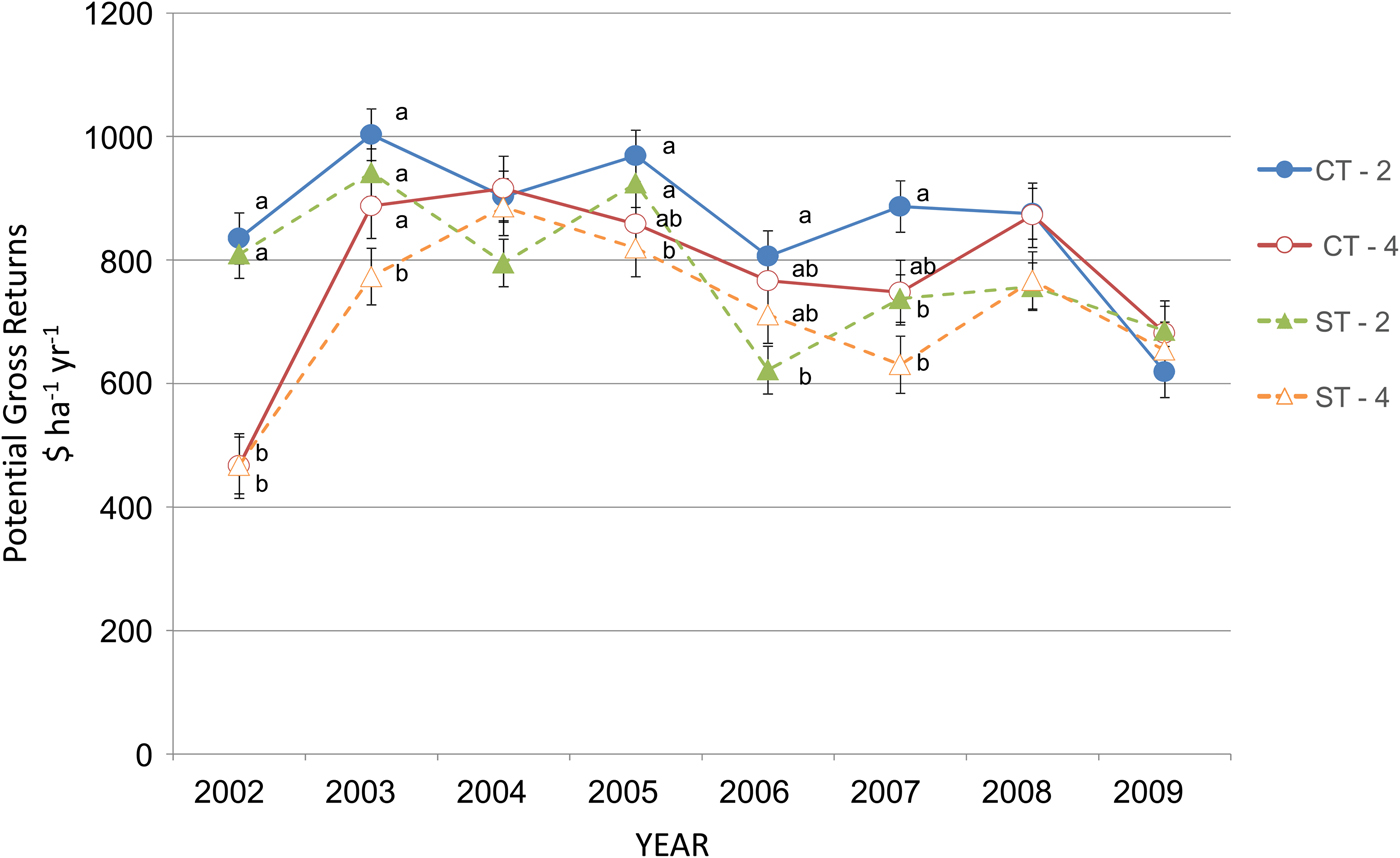
Figure 2. Potential gross returns, average dollars US$ ha−1 yr−1, for 2002–2009, calculated for the across crops within tillage and rotation systems. Bars indicate standard error (n = 4). Where present, lowercase letters indicate significant differences among management systems within a year. Management system abbreviations are listed in Fig. 1.
Weed seed density
Averaged over 4 years, total weed seed densities were significantly greater following wheat and alfalfa crops than soybean crops, regardless of cropping system (Fig. 3). In CT-2y and CT-4y systems, soybean had significantly lower total weed seed densities than corn. The majority of the weed seeds were green foxtail in corn, wheat and alfalfa, followed by common lambsquarters. Following soybean, weed seeds were distributed more evenly among green foxtail, common lambsquarters, red root pigweed and others, respectively, averaging 29, 19, 30 and 23%.

Figure 3. Average total weed seed density, 2002–2005, by management systems within crops. Left y-axis is ln(seeds + 1) m−2, right y-axis indicates the total weed seed density by transformation of means, Bars represent standard errors of the ln(x + 1) means on the left axis (n = 16). Proportions of the four different weed seed groups are relevant only to left axis scale. Lowercase letters indicate significant differences among systems and crops. Management system abbreviations are listed in Fig. 1.
For the four management systems, regressions of weed seed densities over time were linear and significant for ST-2y and ST-4y systems and linear but not significant for CT-2y or CT-4y systems (Fig. 4). The low r2 values, indicating generally poor fit, did not support a definitive increase in weed seed densities over time. Additional regression analysis by crop entry points into the rotation of each management systems were polynomial in nature, indicating that weed seed density varied more due to a specific crop influence, generally with declines reflecting when soybean occurred in the rotation (data not shown). When evaluated by crops within systems, total weed seed density appeared to increase over time in CT-2y soybean (P = 0.03, r 2 = 0.24), ST-4y soybean (P < 0.001, r 2 = 0.55) and ST-4y wheat (P < 0.001, r 2 = 0.66).

Figure 4. Change in total weed seed density, ln(x + 1), within management systems over time. Means, ln(x + 1), are total weed seeds averaged over crops within systems. Bars indicate standard errors of the ln(x + 1) means (2y, n = 8; 4y, n = 16). Linear regressions equations, r 2 values and P-values are given, with significant regression lines also shown for ST-4y (solid) and ST-2y (dotted) systems. Management system abbreviations are listed in Fig. 1.
In addition to the regression analyses, weed seeds densities, for total and groups, were evaluated for relationships to crop yields. For all entry points, significant relationships indicated positive correlations of weed seed densities with yield (typically, ρ ranged from 0.50 to 0.88, with P < 0.05). However, when analyzed by crops, only green foxtail seeds collected in ST-4y corn had a negative correlation with yields (ρ = −0.63, P < 0.01). All other significant correlations within crops indicated positive relationships of crop yields and weed seed densities (data not shown).
Discussion
Except for corn, all management systems resulted in comparable overall crop yields. Corn appears to be the crop most responsive to moldboard plow in this experiment. During the first 4 years of production, total weed seed densities did not differ among management systems within corn crops. However, green foxtail seed densities were negatively correlated to corn grain yields in the ST-4y treatments. Similarly, greater weed seed production of green foxtail in corn crops occurred under no-till than moldboard plow and was correlated with greater weed biomass (Kegode and Forcella, Reference Kegode and Forcella2006). This positive correlation to biomass might explain the significantly lower corn grain yields observed in 2003 in the ST-4y system. As this 4-year assessment did not indicate that weed seed densities were increasing in this system, we cannot unequivocally attribute any differences in corn grain yields in the last 4 years to weeds. Monitoring and application of herbicides might have kept weed pressures low.
Corn grain yields were inconsistent with research that has linked differences in nutrient availability to differences in grain yield. In the current system, greater fertilization in 2y over 4y rotations did not always result in higher grain yields, nor within rotations did CT always have greater yields over ST. Supporting expectations, Rice et al. (Reference Rice, Smith and Blevins1986) attributed greater corn grain yields in unfertilized conventional moldboard plow-disk tillage systems compared with no-till systems to increased nutrient availability from organic matter turnover, with intensive tillage activity resulting in organic matter turnover and increase nutrient availability (Van Den Bossche et al., Reference Van Den Bossche, De Bolle, De Neve and Hofman2009). In contrast, grain yields in systems established long-term (>5–12 yr) were similar between conventional tillage and conservation tillage systems despite that mineralization and nutrient availability was found to increase in the conservation system (Rice et al., Reference Rice, Smith and Blevins1986; Ziadi et al., Reference Ziadi, Angers, Gagnon, Lalande, Morel, Rochette and Chantigny2014). These inconsistencies with established expectations need deeper investigation.
Soybean yields rarely differed among the four cropping systems. Herbicide and insecticide applications may have been sufficient to control pressure of related external factors. A reason tillage strategy might have had little influence on soybean yields, is that soybean has access to nitrogen fixed by symbiotic rhizobia, which could negate any influence of tillage on nutrient availability. Across seven Iowa locations, Al-Kaisi et al. (Reference Al-Kaisi, Archontoulis and Kwaw-Mensah2016) found no effect of tillage, which included comparisons of ST, no-tillage, chisel plow, moldboard plow and deep ripping, on soybean yields within corn-soybean rotations. Although in poorly drained soils in the Upper Midwest, no-till reduced yields in comparison with moldboard plowed fields (Al-Kaisi et al., Reference Al-Kaisi, Archontoulis and Kwaw-Mensah2016) while ST did not (Licht and Al-Kaisi, Reference Licht and Al-Kaisi2005; Archer and Reicosky, Reference Archer and Reicosky2009). On the other hand, the lack of soybean yield differences does not support the possibility of yield gains under ST in response to a positive influence of reduced tillage on the rhizobial community and soybean root colonization observed elsewhere (Andrade et al., Reference Andrade, Colozzi-Filho, Giller and El Titi2003; Dogan et al., Reference Dogan, Celik, Gok and Coskan2011; Köhl et al., Reference Köhl, Oehl and van der Heijden2014), even though we have observed greater total soil microbial biomass in these very same ST systems (Weyers et al., Reference Weyers, Johnson and Archer2013).
Wheat and alfalfa were planted at the same time following CT in the CT management system and ST or no-tillage in the ST management system. Overall yields of these two crops were not influenced by tillage strategy except for wheat in 2006, which likely was due to the low rainfall that year. These findings were similar to those of a meta-analysis comparing no-till with conventional till that showed wheat yields in the Northern Crescent and Northern Great Plains areas of the Upper Midwest were within 98% of the yields under conventional management (Toliver et al., Reference Toliver, Larson, Roberts, English, De La Torre Ugarte and West2012). However, the decline over time in alfalfa biomass in both tillage treatments might indicate a P or K-limitation (Crews, Reference Crews1993; Berg et al., Reference Berg, Cunningham, Brouder, Joern, Johnson, Santini and Volenec2005).
Overall system productivity was better using a CT-2y management system, due to greater corn yields. Although this was an overall effect, the lack of differences between the CT-2y and CT-4y in all years except 2002 (with no alfalfa harvest) and the limited differences compared with the ST-2y or ST-4y, indicated uncontrolled factors, such as yearly climate changes, or variability across the landscape, overwhelmed management influences. Landscape variability, as expected on farm, would likely require precision management to achieve consistent performance with the CT-2y system (Whelan and McBratney, Reference Whelan and McBratney2000). In addition to uncontrolled variables, input costs and market variability might also influence net performance of the CT-2y system, particularly because of corn, but also high fuel use associated with moldboard plowing. Corn grain prices have appreciable variability from year to year, depending on economic pressures of ethanol availability and demand relative to energy and food prices (de Nicola et al., Reference de Nicola, De Pace and Hernandez2016; Fernandez-Perez et al., Reference Fernandez-Perez, Frijns and Tourani-Rad2016). Further, several studies in the Upper Midwest demonstrated higher input costs with conventional tillage systems (DeVuyst et al., Reference DeVuyst, Foissey and Kegode2006; Archer et al., Reference Archer, Jaradat, Johnson, Weyers, Gesch, Forcella and Kludze2007) and these higher costs resulted in lower net returns compared with reduced or no-till systems (Archer and Reicosky, Reference Archer and Reicosky2009; Al-Kaisi et al., Reference Al-Kaisi, Archontoulis and Kwaw-Mensah2016).
Contrary to expectations, productivity of the ST-2y, ST-4y or CT-4y management systems was not always the same, or better, compared with the CT-2y, a common management system in the Upper Midwest. In general, these findings seem to support the perception that conventional moldboard tillage, at least for corn, is necessary for higher yields. However, the other outcomes from this study, such as absence of tillage effects on yields of soybean, wheat or alfalfa and no tillage effects on weed seed densities, might encourage adoption of the ST, diverse rotation approach. These current findings suggest that future research on conservation strategies should focus on methods to maintain or improve corn yields. One approach suggested for further evaluation might be a rotational tillage strategy (Hill, Reference Hill2001; Vetsch et al., Reference Vetsch, Randall and Lamb2007) that combines moldboard plow for corn with ST or no-tillage for soybean, wheat and alfalfa, keeping in mind that soil quality outcomes need to be evaluated at the same time.
Acknowledgements
The authors are grateful to Jim Eklund, Charles Hennen, Scott Larson, Dean Peterson, Nancy Barbour, Alan Wilts, Joe Boots, Chris Wente, Jay Hanson, Steve VanKempen and numerous students for their expertise in field management, sample collection and data management. This work contributes to the USDA-ARS GRACEnet program. Mention of trade names or commercial products in this publication is solely for the purpose of providing specific information and does not imply recommendation or endorsement by the US Department of Agriculture. USDA is an equal opportunity employer and provider.


