INTRODUCTION
Cryoplanation terraces (also known as altiplanation or goletz terraces and by several other terms) are periglacial landforms consisting of nearly horizontal bedrock surfaces or benches backed by frost-weathered bedrock cliffs (Demek, Reference Demek1969b; Washburn, Reference Washburn1979; Ballantyne, Reference Ballantyne2018; French, Reference French2018; Harris et al., Reference Harris, Brouchkov and Cheng2018). The terraces are typically tens of metres wide and hundreds of metres long, with a thin cover of regolith. They may occur singly or as an altitudinal sequence of hillslope “steps” that sometimes culminate in “summit flats” (Czudek, Reference Czudek1995; Lauriol et al., Reference Lauriol, Lamirande and Lalonde2006; Křižek, Reference Křižek, Goudie and Kalvoda2007; Hall and André, Reference Hall and André2010; Nelson and Nyland, Reference Nelson and Nyland2017).
The terraces are generally supposed to have developed by processes of “cryoplanation”—commonly interpreted to include a combination of frost weathering on bedrock cliffs and the removal of the weathered debris by solifluction and/or flowing water—resulting in cliff recession and terrace extension (Boch and Krasnov, Reference Boch, Krasnov and Evans1994; Demek, Reference Demek1969a; Priesnitz, Reference Priesnitz and Clark1988; Lauriol, Reference Lauriol1990; Ballantyne, Reference Ballantyne2018). Indeed, Schunke (Reference Schunke1977) suggested that cryoplanation terraces may be the only mesoscale landforms that can be used to characterise the periglacial zone, and hence define a truly periglacial environment. The processes of cryoplanation also underpin attempts to define distinctive models of periglacial hillslope and landscape evolution (cf. Peltier, Reference Peltier1950; Richter et al., Reference Richter, Haase and Barthel1963; French, Reference French2016).
However, although cryoplanation terraces have been widely recognised in regions with present or former nonglacial cold climates, such as Siberia (Boch and Krasnov, Reference Boch, Krasnov and Evans1994; Demek, Reference Demek1968; Czudek, Reference Czudek1995), Mongolia (Richter et al., Reference Richter, Haase and Barthel1963), Alaska (Reger and Péwé, Reference Reger and Péwé1976; Nelson, Reference Nelson1998; Nelson and Nyland, Reference Nelson and Nyland2017), northern Canada (Lauriol and Godbout, Reference Lauriol and Godbout1988; Lauriol et al., Reference Lauriol, Lamirande and Lalonde2006), Central Europe (Demek, Reference Demek1969b; Traczyk and Migon, Reference Traczyk and Migon2000; Křížek, Reference Křižek, Goudie and Kalvoda2007), Iceland (Schunke and Heckendorff, Reference Schunke and Heckendorff1976; Schunke, Reference Schunke1977), the Andes (Grosso and Corte, Reference Grosso and Corte1991), Antarctica (Hall, Reference Hall1997; Hall and André, Reference Hall and André2010), and the British Isles (Te Punga, Reference Te Punga1956; Waters, Reference Waters1962), criteria for the recognition of active features are largely lacking. In the absence of dating evidence, moreover, most examples discussed in the literature are of unknown age, and many are regarded as relict. Furthermore, there is disagreement over the necessary climatic conditions under which cryoplanation terraces can form, and whether cryoplanation terraces are characteristic of permafrost environments, as advocated by Reger and Péwé (Reference Reger and Péwé1976), or can also form under climatic regimes characterised only by seasonal frost (Demek, Reference Demek1969b).
The precise processes constituting cryoplanation and the rate of development of cryoplanation terraces, their status as palaeoclimatic indicators, and their role in the evolution of periglacial landscapes all remain highly controversial topics. Furthermore, as cryoplanation terraces are often the sites of long-lasting snow beds, this has led to the suggestion that cryoplanation is essentially similar to “nivation”—the suite of weathering and transport processes that may be enhanced by the presence of late-lying or perennial snow—which is another problematic subject (St-Onge, Reference St-Onge1964, Reference St-Onge1969; Hall, Reference Hall1998; Thorn and Hall, Reference Thorn and Hall2002; Margold et al., Reference Margold, Treml, Petr and Nyplová2011; Rixhon and Demoulin, Reference Rixhon, Demoulin, Giardino and Harbor2013). Arguably, despite recent research from the Antarctic, there has been little progress in understanding cryoplanation terraces since the definitive monograph of Demek (Reference Demek1969b): new insights are therefore long overdue.
This paper presents the results of an investigation of active cryoplanation terraces recently discovered at Svartkampan in the permafrost zone of northeastern Jotunheimen, alpine southern Norway. These landforms are believed to be the first active cryoplanation terraces to be recognised as such in Norway and have the potential to resolve several of the aforementioned controversies regarding the nature and significance of cryoplanation and related topics. Our specific objectives are as follows:
1. To describe the morphology of the proposed cryoplanation terraces.
2. To date the terraces using SHD, complemented by radiocarbon dating, and hence provide firm evidence of landform age and present levels of activity.
3. To assess observational evidence of the environmental controls on terrace formation at the site, including geologic structure, climate, permafrost, snow, and groundwater hydrology.
4. To test current ideas on cryoplanation processes in light of new evidence from Svartkampan and propose a process-based conceptual model of cryoplanation terrace development.
LOCATION AND ENVIRONMENT
Svartkampan is a spur located on the northern slope of the Galdhøpiggen massif of northeastern Jotunheimen, the highest mountains in Norway (Fig. 1). The cryoplanation terraces (sites 1–10) occur as a series of north-facing steps with backing cliffs cut into bedrock at an altitude of 1540–1575 m above sea level (m asl) (Figs. 1c and 2a). These terraces sit on the northern rim of Juvflye, a high-altitude plateau, where related forms have been mapped as perennial snow beds but not as cryoplanation terraces (Ødegård et al., Reference Ødegård, Sollid and Liestøl1987). The study sites lie at least 500 m above the tree line, close to the upper altitudinal limit of the mid-alpine belt, which occurs locally at ~1600 m (Matthews et al., Reference Matthews, Hill, Winkler, Owen and Vater2018a; see also NIJOS, 1991). Extensive areas of active and relict periglacial patterned ground (sorted circles, garlands, and stripes) characterise the largely till-covered landscape at and above the altitude of the sites (Ødegård et al., Reference Ødegård, Sollid and Liestøl1987, Reference Ødegård, Sollid and Liestøl1988; Winkler et al., Reference Winkler, Matthews, Mourne and Wilson2016) where bedrock outcrops are relatively rare. Beneath the bedrock cliffs, the treads of the cryoplanation terraces have a similar surface cover of regolith with an extensive pavement of boulders and cobbles, disturbed soils, and a sparse vegetation cover (Fig. 2b).
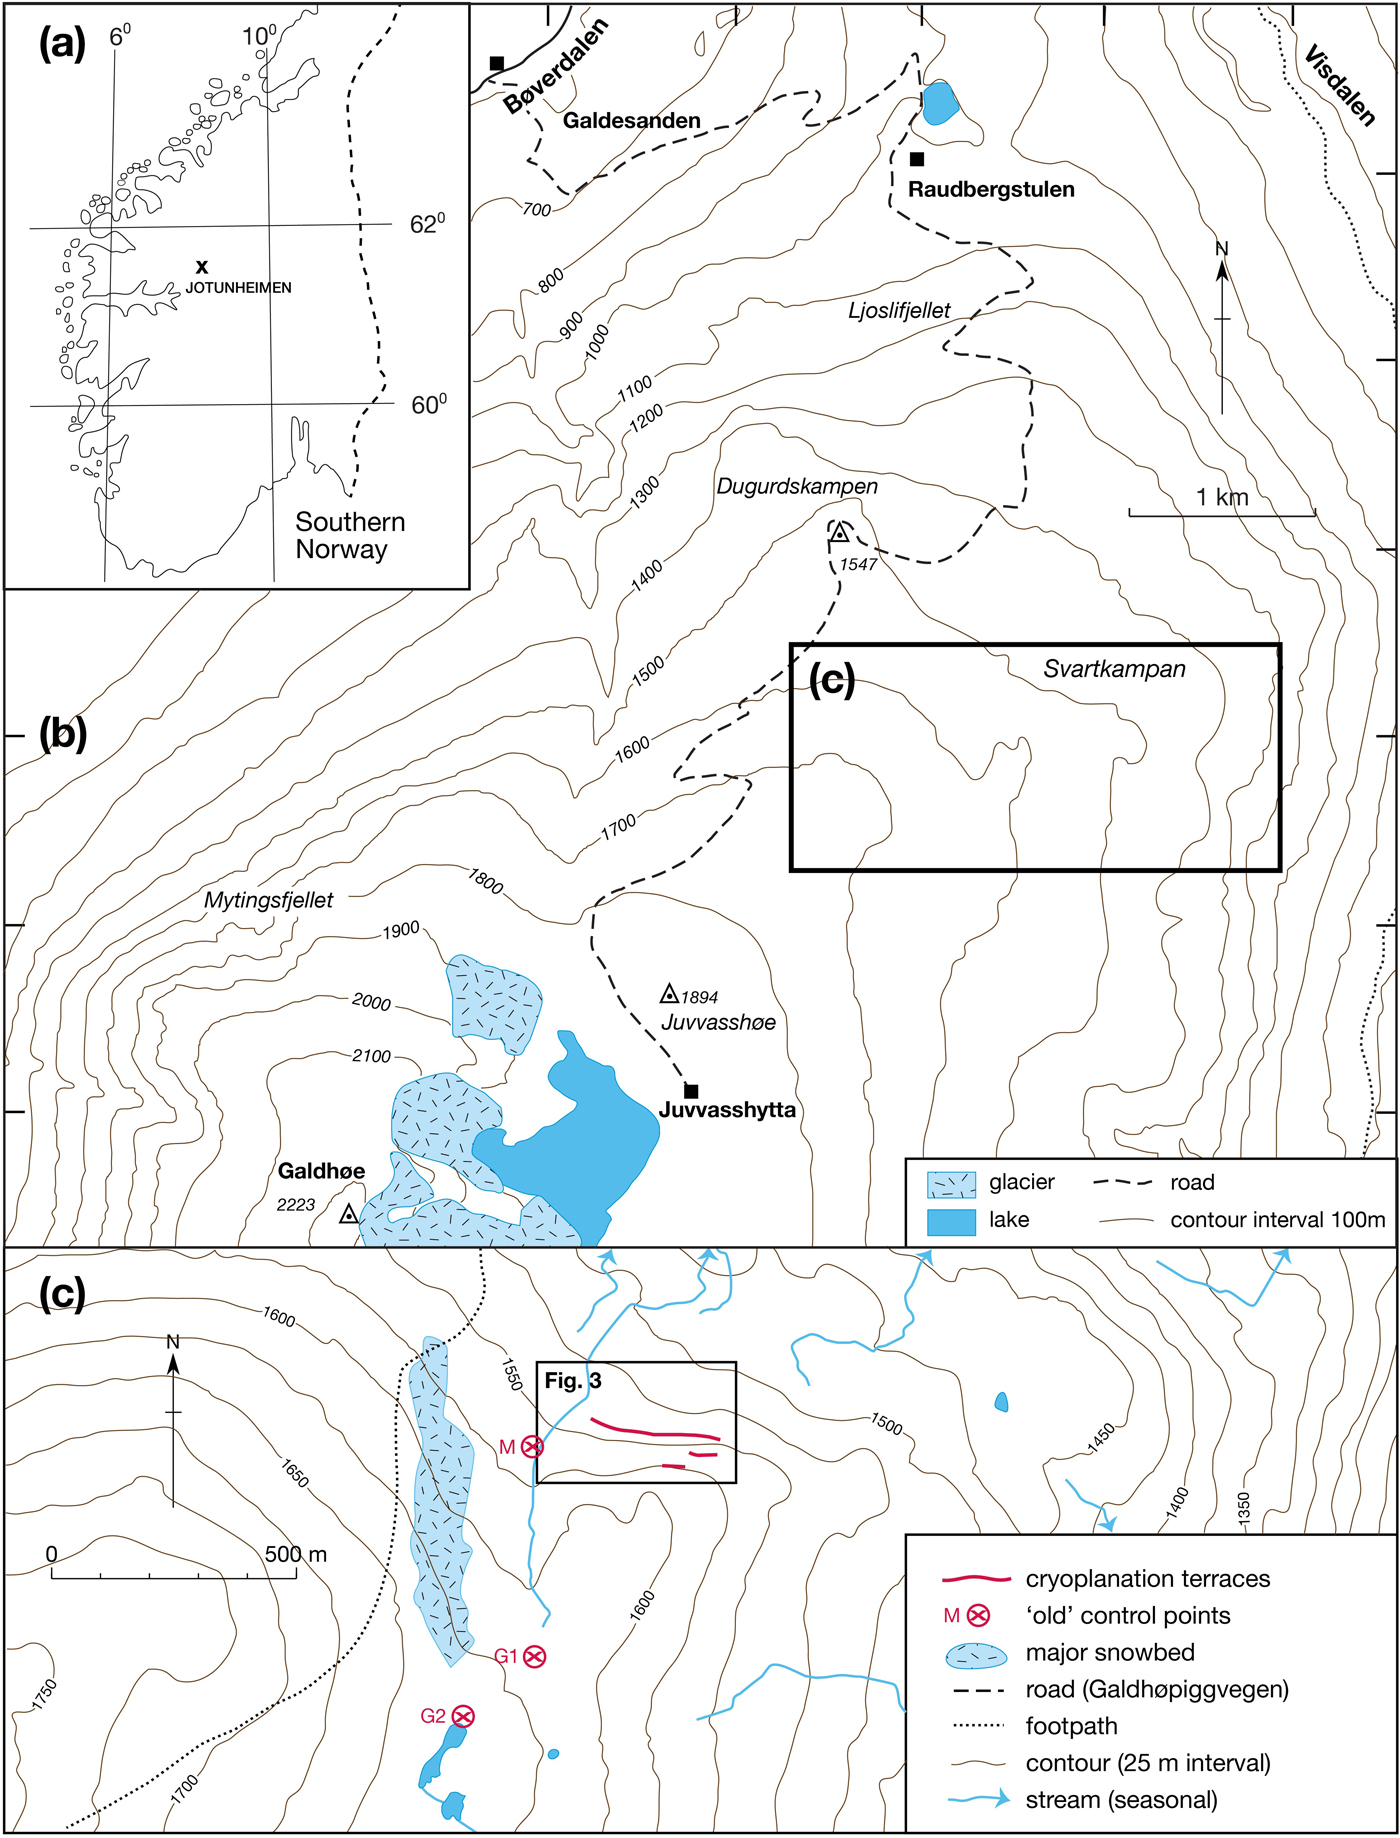
Figure 1. (colour online) (a) Location of Jotunheimen, southern Norway; (b) location of Svartkampan, NE Jotunheimen; and (c) location of the cryoplanation terraces at Svartkampan (source: http://www.norgeskart.no). Sites of control points for Schmidt-hammer exposure-age dating (M, G1, and G2; explained in the text) and location of Figure 3 are also shown.
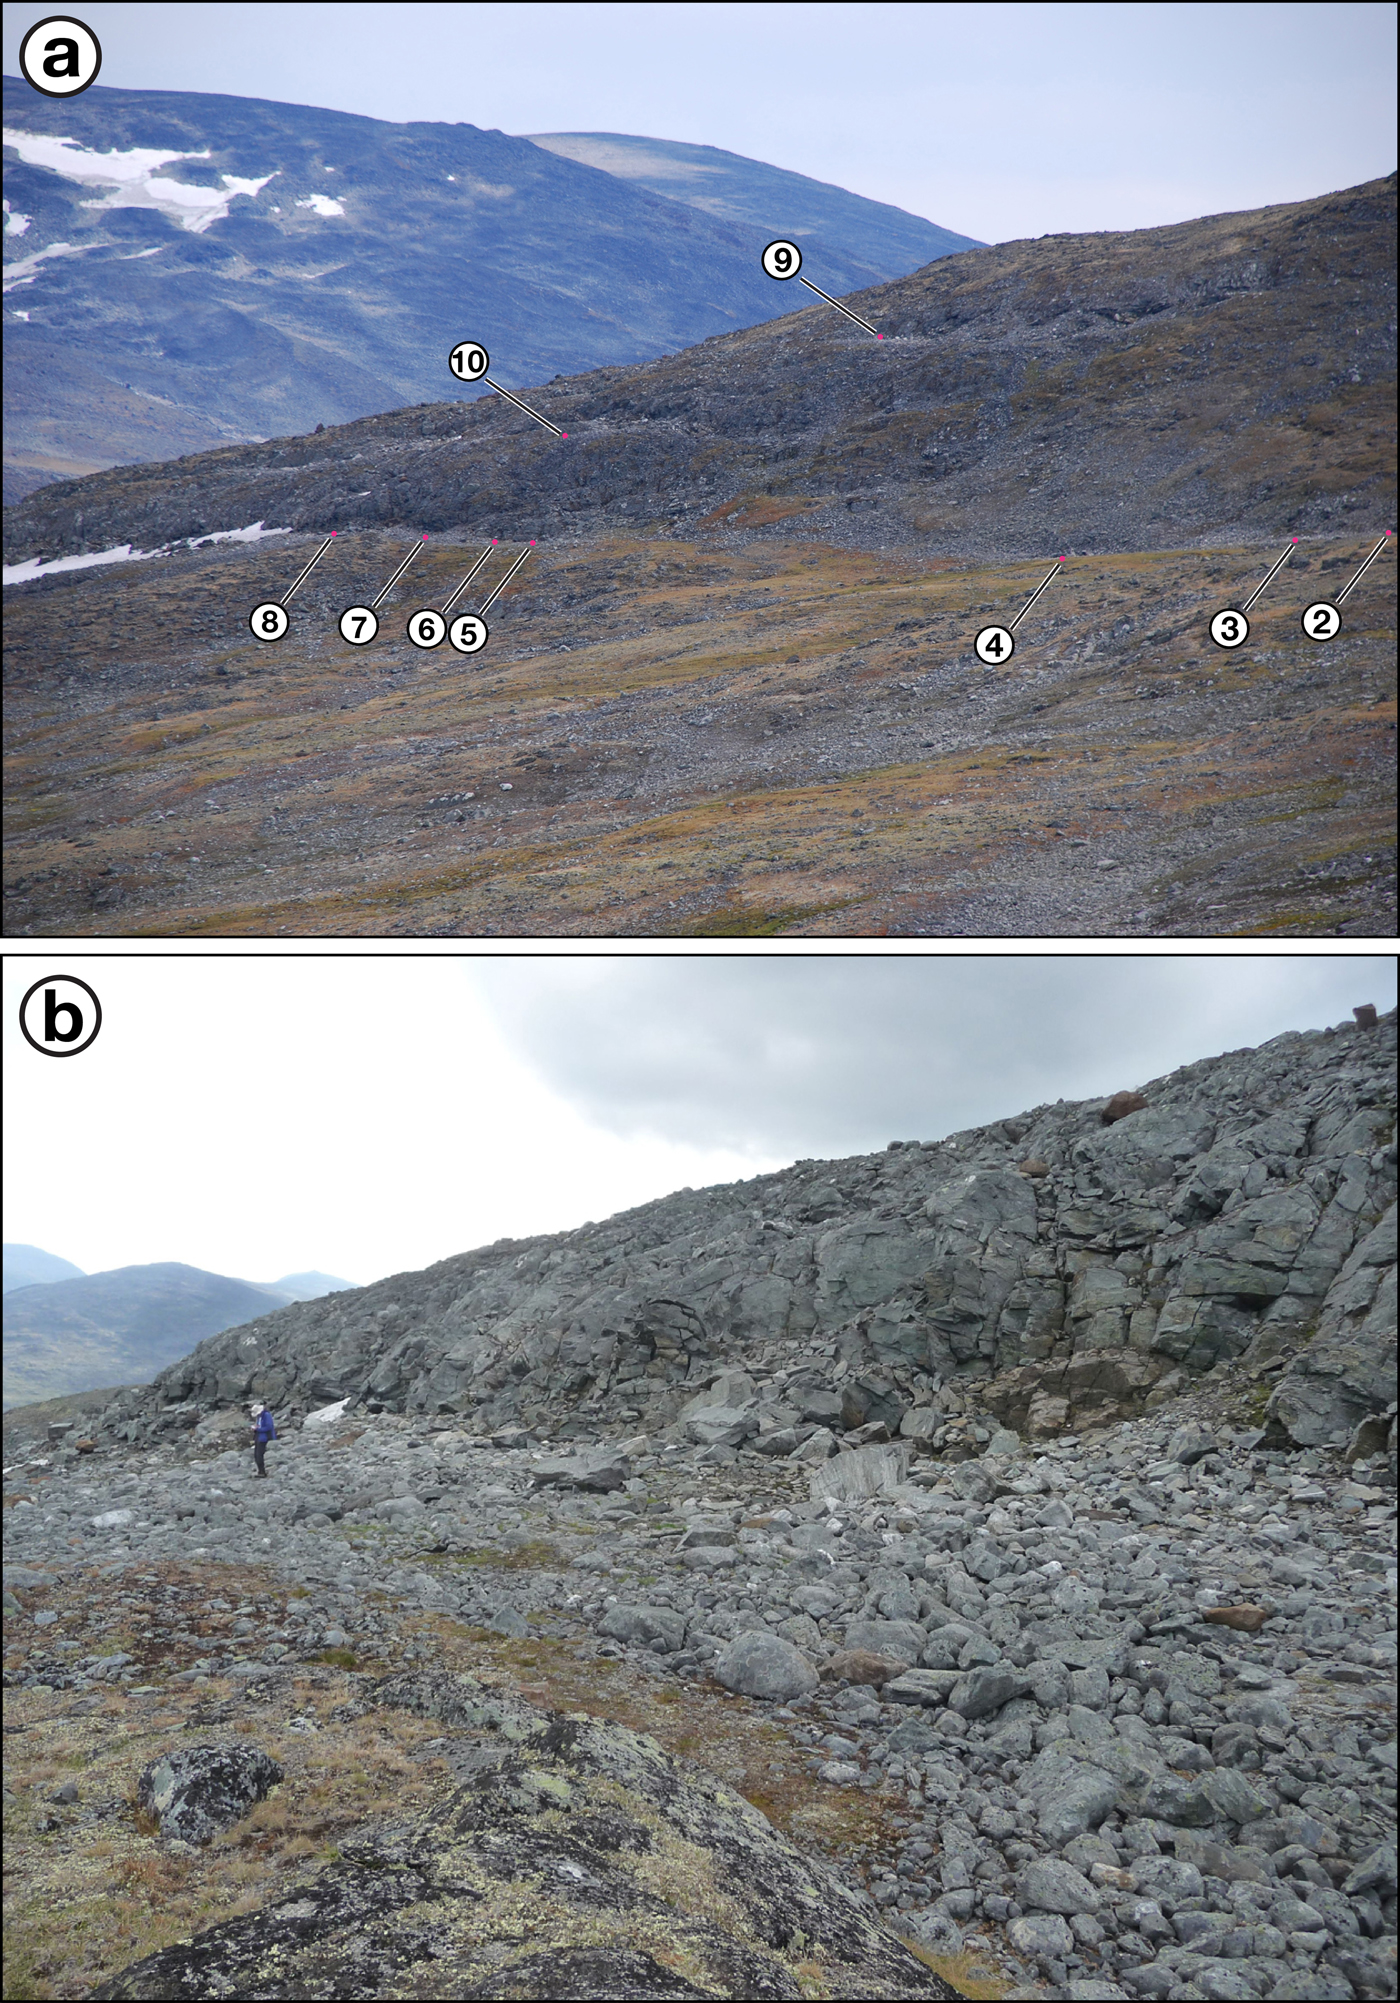
Figure 2. (colour online) (a) The sequence of cryoplanation terraces at Svartkampan viewed from the northwest (July 23, 2018). Numbers indicate the positions of cross profiles and measurement sites 2–10. Note also the late-lying snow bed at the eastern end of the main terrace (to the left of site 8) and the near absence of snow elsewhere on this terrace and on the two upper terraces (sites 9 and 10). (b) Detail of the eastern end of the main terrace (including sites 7 and 8; July 22, 2017). Note person for scale.
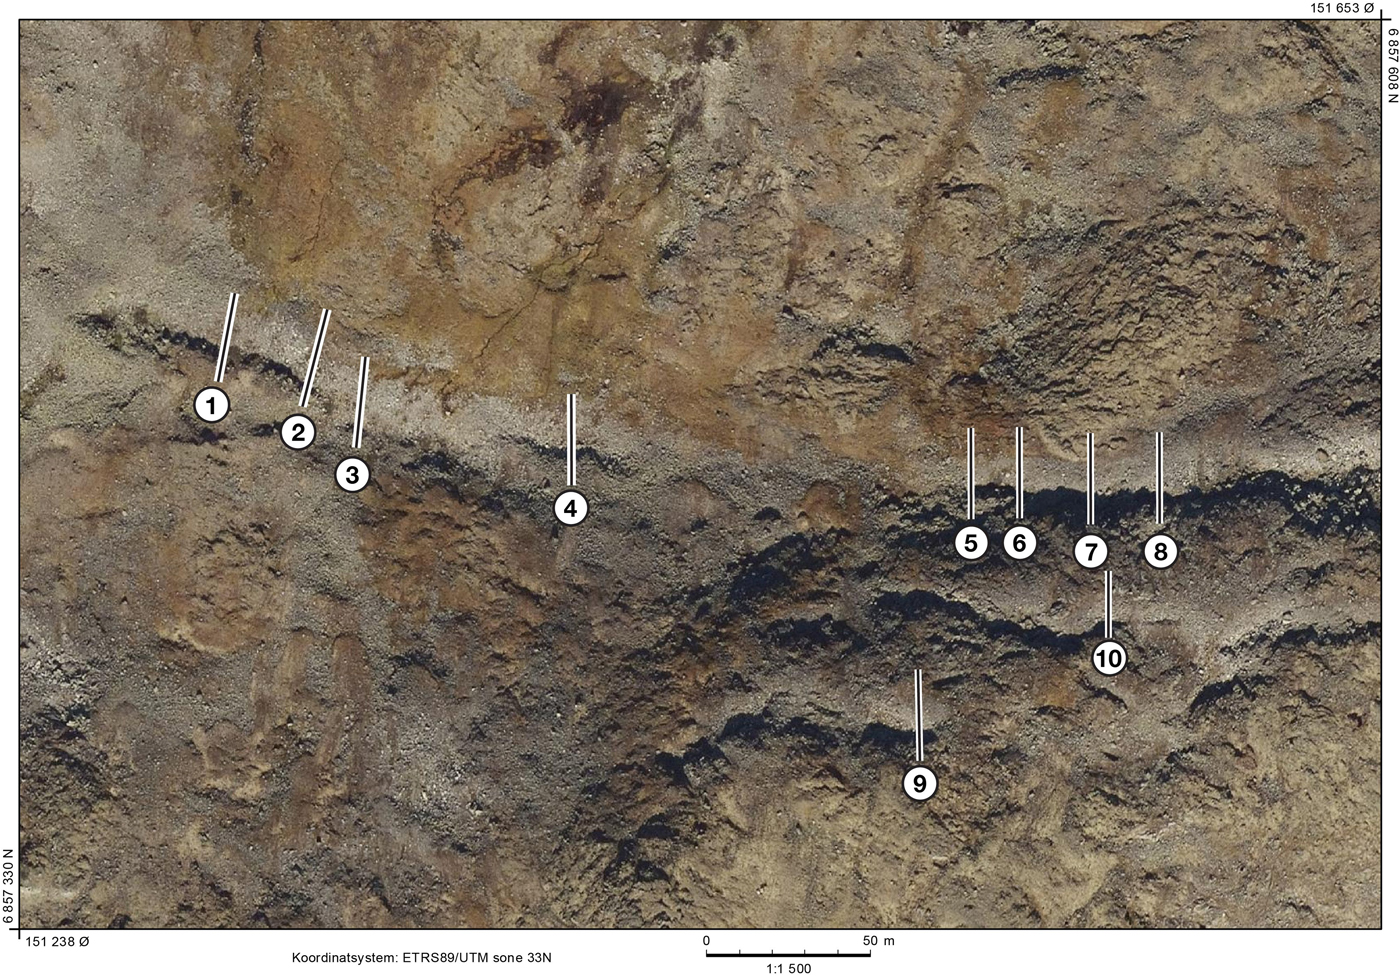
Figure 3. (colour online) Vertical aerial photograph of the cryoplanation terraces flown on September 25, 2017 (source: http://www.norgeibilder.no). Numbers indicate the positions of cross profiles and measurement sites 1–10.
Most of the study area is composed of pyroxene-granulite gneiss (Lutro and Tveten, Reference Lutro and Tveten1996) but the location of the terraces coincides with a shear zone within the gneiss. Observations from the backing cliffs of the terraces show that this zone consists mainly of alternating flaggy layers of varied lithologies, including fine-grained black to dark-green mylonite and coarser-grained grey, sheared gneiss. Both lithologies have lozenge-shaped rotated feldspar crystals and larger pods (>5 cm) of relatively unsheared but rotated gneiss. Also present are rounded feldspar crystals (typically 1–2 cm), which give a “pebbly” appearance resembling augen gneiss, white quartz-feldspar layers (possibly pre-deformational), and occasional larger intrusions of peridotite, which weathers to a distinctive orange-brown colour. Although not very common at the main terrace (sites 1–8) and the upper terraces (sites 9 and 10), the pebbly gneiss predominates at another prominent terrace located below and to the northwest of the main terrace at 1525 m asl.
Mean annual air temperature (MAAT) estimated from boreholes near the study site at 1560 m asl, where permafrost is present, is −2°C, with a mean July air temperature of + 5°C and a mean January air temperature of −8°C (Farbrot et al., Reference Farbrot, Hipp, Etzelmüller, Isaksen, Ødegård, Schuler and Humlum2011; Lilleøren et al., Reference Lilleøren, Etzelmüller, Schuler, Ginås and Humlum2012). These temperature data are consistent with the earlier estimate of −2.6°C for MAAT at 1500 m asl interpolated from MAAT measurements at 11 meteorological stations around Jotunheimen (Ødegård et al., Reference Ødegård, Sollid and Liestøl1992). Annual snow depth is 1.0–1.5 m (www.se.norge.no), while mean annual precipitation is 800–1000 mm (Isaksen et al., Reference Isaksen, Ødegård, Etzelmüller, Hilbich, Hauck, Farbrot, Eiken, Hagen and Hipp2011), with a late-summer maximum characteristic of the continental climatic regime of eastern Norway. However, strong winds on Juvflye result in comparatively little snow cover and a late maximum snow depth of only 0.5 m in May (Ødegård et al., Reference Ødegård, Sollid and Liestøl1992): our study sites in a leeward position accumulate significantly higher values than this.
Permafrost is widespread in this area of Jotunheimen, where the lower limit of discontinuous permafrost lies at ~1450 m asl (Ødegård et al., Reference Ødegård, Hoelzle, Johanen and Sollid1996; Isaksen et al., Reference Isaksen, Hauck, Gudevang, Ødegård and Sollid2002; Harris et al., Reference Harris, Arenson, Christiansen, Etzelmüller, Frauenfelder, Gruber and Haeberli2009; Farbrot et al., Reference Farbrot, Hipp, Etzelmüller, Isaksen, Ødegård, Schuler and Humlum2011), and active-layer thickness may be up to 5 m at 1600 m asl (Hipp et al., Reference Hipp, Etzelmüller and Westermann2014). However, the lower limit of permafrost in alpine rock walls in the area is highly dependent on aspect and is likely to descend to at least 1300 m asl where these face north (Hipp et al., Reference Hipp, Etzelmüller and Westermann2014), possibly within the range 1250–1400 m asl (Steiger et al., Reference Steiger, Etzelmüller, Westermann and Myhra2016). There can be no doubt, therefore, that the bedrock cliffs characterising the cryoplanation terraces at Svartkampan are underlain by permafrost. Permafrost is likely to have existed throughout the Holocene at altitudes >1600 m asl in the study area (Lilleøren et al., Reference Lilleøren, Etzelmüller, Schuler, Ginås and Humlum2012). At the slightly lower altitude of the study sites, therefore, permafrost could have been absent during the Holocene thermal maximum of the early Holocene, although it may well have survived in the north-facing bedrock cliffs. The lowest permafrost limits of the Holocene seem to have occurred during the Little Ice Age (Lilleøren et al., Reference Lilleøren, Etzelmüller, Schuler, Ginås and Humlum2012), when MAAT was ~1.0°C lower than in AD 1960–1990 (Nesje et al., Reference Nesje, Dahl, Thun and Nordli2008).
At the maximum of the last (Weichselian) glaciation, the highest areas of Jotunheimen were located close to the main ice divide and ice accumulation area of the Scandinavian ice sheet. Deglaciation is considered to have occurred in the early Holocene by 9.7 ka, following the Preboreal Erdalen event (cf. Dahl et al., Reference Dahl, Nesje, Lie, Fordheim and Matthews2002; Matthews and Dresser, Reference Matthews and Dresser2008). This conventional interpretation is consistent with basal radiocarbon dates obtained from peat bogs and lakes from the valleys surrounding the Galdhøpiggen massif (Barnett et al., Reference Barnett, Dumayne-Peaty and Matthews2000; Nesje and Dahl, Reference Nesje and Dahl2001; Matthews et al., Reference Matthews, Berrisford, Dresser, Nesje, Dahl, Bjune and Bakke2005, Reference Matthews, Winkler, Wilson, Tomkins, Dortch, Mourne, Hill, Owen and Vater2018b; Hormes et al., Reference Hormes, Blaauw, Dahl, Nesje and Possnert2009), empirical evidence of deglaciation elsewhere in southern Norway, and broad-scale reconstruction of the Scandinavian ice-sheet deglaciation (Goehring et al., Reference Goehring, Brook, Linge, Raisbeck and Yiou2008; Nesje, Reference Nesje2009; Mangerud et al., Reference Mangerud, Gyllencreutz, Lohne, Svendsen, Ehlers, Gibbard and Hughes2011; Hughes et al., Reference Hughes, Gyllencreutz, Lohne, Mangerud and Svendsen2016; Stroeven et al., Reference Stroeven, Hättestrand, Kleman, Heyman, Fabel, Fredin and Goodfellow2016; Marr et al., Reference Marr, Winkler and Löffler2018).
METHODOLOGY
Observations and measurements were made at 10 sites on three cryoplanation terraces (Figs. 1c and 3). Cross profiles of the terrace tread and backing cliff were measured at each site to define the overall terrace morphology, using a 30 m tape and an Abney level between breaks of slope. Two excavations were made in the tread of the main terrace (where the boulder cover was least extensive) to examine the subsurface, particularly the bedrock profile beneath the regolith cover.
At each site, a total of 300 Schmidt-hammer R-values were measured: 100 boulders each from the inner and outer halves of the tread (one impact per boulder) and a sample of 100 impacts from the backing cliff (impacts widely spaced across the cliff face). A mechanical N-type Schmidt hammer (Proceq, 2004) was used throughout and periodically tested on the manufacturer's test anvil to ensure no deterioration in performance following a large number of impacts (cf. McCarroll, Reference McCarroll1987, Reference McCarroll and Beck1994). Schmidt-hammer measurements were restricted to boulders or bedrock of the dominant local lithology, namely mylonitised pyroxene-granulite gneiss. Unstable or small boulders were avoided, as were boulder or bedrock edges, joints, or cracks and lichen-covered or wet surfaces (cf. Shakesby et al., Reference Shakesby, Matthews and Owen2006; Viles et al., Reference Viles, Goudie, Grabb and Lalley2011; Matthews and Owen, Reference Matthews, Owen, Winkler, Vater, Wilson, Mourne and Hill2016).
High-resolution, calibrated-age, Schmidt-hammer exposure-age dating (SHD) techniques followed the approach developed by Matthews and Owen (Reference Matthews and Owen2010), Matthews and Winkler (Reference Matthews and Winkler2011), and Matthews and McEwen (Reference Matthews and McEwen2013). This approach is based on establishing a local, linear calibration equation relating mean Schmidt-hammer R-value to rock-surface exposure age based on two surfaces of known age (“old” and “young” control points). The control points used in this study relate to the local mylonitised pyroxene-granulite gneiss. The old control point, which is located within 200 m of the western end of the main terrace (M in Fig. 1c), consists of glacially scoured bedrock surfaces. The age of 9.7 ka assigned to these surfaces is the conventional age of deglaciation in central Jotunheimen (Matthews et al., Reference Matthews, Winkler, Wilson, Tomkins, Dortch, Mourne, Hill, Owen and Vater2018b; see references in last paragraph of the previous section). The surfaces are exposed in a small channel last occupied by meltwater during deglaciation, when water flowed north from three small lakes that currently drain towards the southeast (Fig. 1c). The bedrock surface of the modern cliff at site 8 was used as the young control point with an age of zero years. This is justified on two grounds. First, this cliff surface was lichen free when the R-values were measured, which indicates a surface age of <25 yr based on various estimates of the time required for the establishment of crustose Rhizocarpon lichens in Jotunheimen (Matthews, Reference Matthews2005; Matthews and Vater, Reference Matthews and Vater2015). Second, R-values from this cliff surface are similar but slightly higher than those characterising angular boulders located about 100 m from the Vesle-Juvbreen glacier snout on terrain that, according to aerial photographic evidence, has an estimated age of 50 yr (Matthews et al., Reference Matthews, Winkler and Wilson2014).
The resulting Schmidt-hammer exposure ages are derived with 95% confidence intervals (Ct) that depend on the error associated with the calibration equation (Cc) and the error of the surface to be dated (Cs). This particular approach to SHD has been successfully applied to many different types of landforms composed of coarse rock particles and/or bedrock in southern Norway and elsewhere, including raised beaches (Shakesby et al., Reference Shakesby, Matthews, Karlén and Los2011), rock glaciers (Matthews et al., Reference Matthews, Nesje and Linge2013), moraines (Matthews et al., Reference Matthews, Winkler and Wilson2014), pronival ramparts (Matthews and Wilson, Reference Matthews and Wilson2015), snow-avalanche impact landforms (Matthews et al., Reference Matthews, McEwen and Owen2015), periglacial patterned ground (Winkler et al., Reference Winkler, Matthews, Mourne and Wilson2016), blockfields (Wilson and Matthews, Reference Wilson and Matthews2016; Marr et al., Reference Marr, Winkler and Löffler2018), blockstreams (Wilson et al., Reference Wilson, Matthews and Mourne2017), and rock-slope failures (Matthews et al., Reference Matthews, Winkler, Wilson, Tomkins, Dortch, Mourne, Hill, Owen and Vater2018b).
SHD was complemented by accelerator mass spectrometry radiocarbon dating of soil material within the regolith that overlies the bedrock beneath the terrace tread. The dated material constitutes a disturbed Humic Regosol (Ellis, Reference Ellis1979). Dating was carried out on bulk samples following acid-wash pretreatment by Beta Analytic Inc. using the INTCAL13 database (Reimer et al., Reference Reimer, Bard, Bayliss, Beck, Blackwell, Bronk Ramsey and Buck2013) and Bayesian probability analysis (Bronk Ramsey, Reference Bronk Ramsey2009).
Organic content and particle size were measured for samples of soil and subsoil. Weight loss-on-ignition at 550°C (Heiri et al., Reference Heiri, Lotter and Lemcke2001) was determined for samples dried at 105°C. Particle size analysis involved sieving and further analysis of the <1 mm fraction by laser diffraction using a Mastersizer 2000 (Malvern Instruments Ltd, 2007; Mingard et al., Reference Mingard, Morrell, Jackson, Lawson, Patel and Buxton2009).
Clast roundness and size and the proportion of in situ fractured clasts were measured on the terrace treads and cliffs as a basis for inferring the possible origins of clasts and the effectiveness of frost-weathering processes. Clast roundness was assessed for boulders and cobbles comprising the surface of the inner and outer parts of the tread separately at each site using a five-point roundness scale (Powers, Reference Powers1953) and a sample size of 150 clasts. Comparable samples of clasts resting on cliff ledges were also examined. The size (longest visible axis) of the largest 25 clasts was recorded separately for angular (roundness classes: very angular and angular) and edge-rounded clasts (roundness classes: subangular, subrounded, and rounded) on the terrace treads. The proportion of fractured clasts on each terrace tread was determined, based on a sample size of 200 clasts.
Structural geologic measurements made of the bedrock cliff included horizontal and vertical joint spacing (n = 25): joints were defined as fractures or cracks >1 m long and >1 mm wide. The strike and dip of metamorphic layering in the cliff face were also measured using a compass clinometer for comparison with layering in the buried bedrock terrace revealed by excavation of the regolith cover.
RESULTS
Terrace morphology
Morphology of the terraces is summarised by the cross profiles from the 10 sites (Fig. 4) and illustrated further by general views of selected sites (Fig. 5). All profiles have a similar northerly aspect. Terrace treads are 7.0–22.0 m wide and backing cliffs are 1.5–6.0 m high. Slope angles of the treads and cliffs are 2°–12° and 35°–80°, respectively, with a sharp break of slope or “knickpoint” at the cliff base, sometimes resulting in an overhang (Fig. 5c). No bedrock is visible at site 4, where a steep (30°) boulder “ramp” is assumed to bury a bedrock cliff. It should also be noted that the outer edge of the terraces at sites 5 and 6 terminate at low bedrock outcrops. At the other sites, the outer edge of the terrace tread is defined by a marked steepening of the slope. The height of the backing cliff is defined here conservatively as the relatively steep lowest part of the cliff, excluding the often degraded upper parts where there is a marked break of slope.

Figure 4. Cross profiles of the cryoplanation terraces: sites 1–8 relate to the main terrace; sites 9 and 10 are on the upper terraces. Small numbers are slope angles of the slope segments (degrees). On each profile, the length of the terrace tread was halved to define the inner (closest to the cliff) and outer tread. Dashed lines suggest the volume of rock removed to form each terrace.
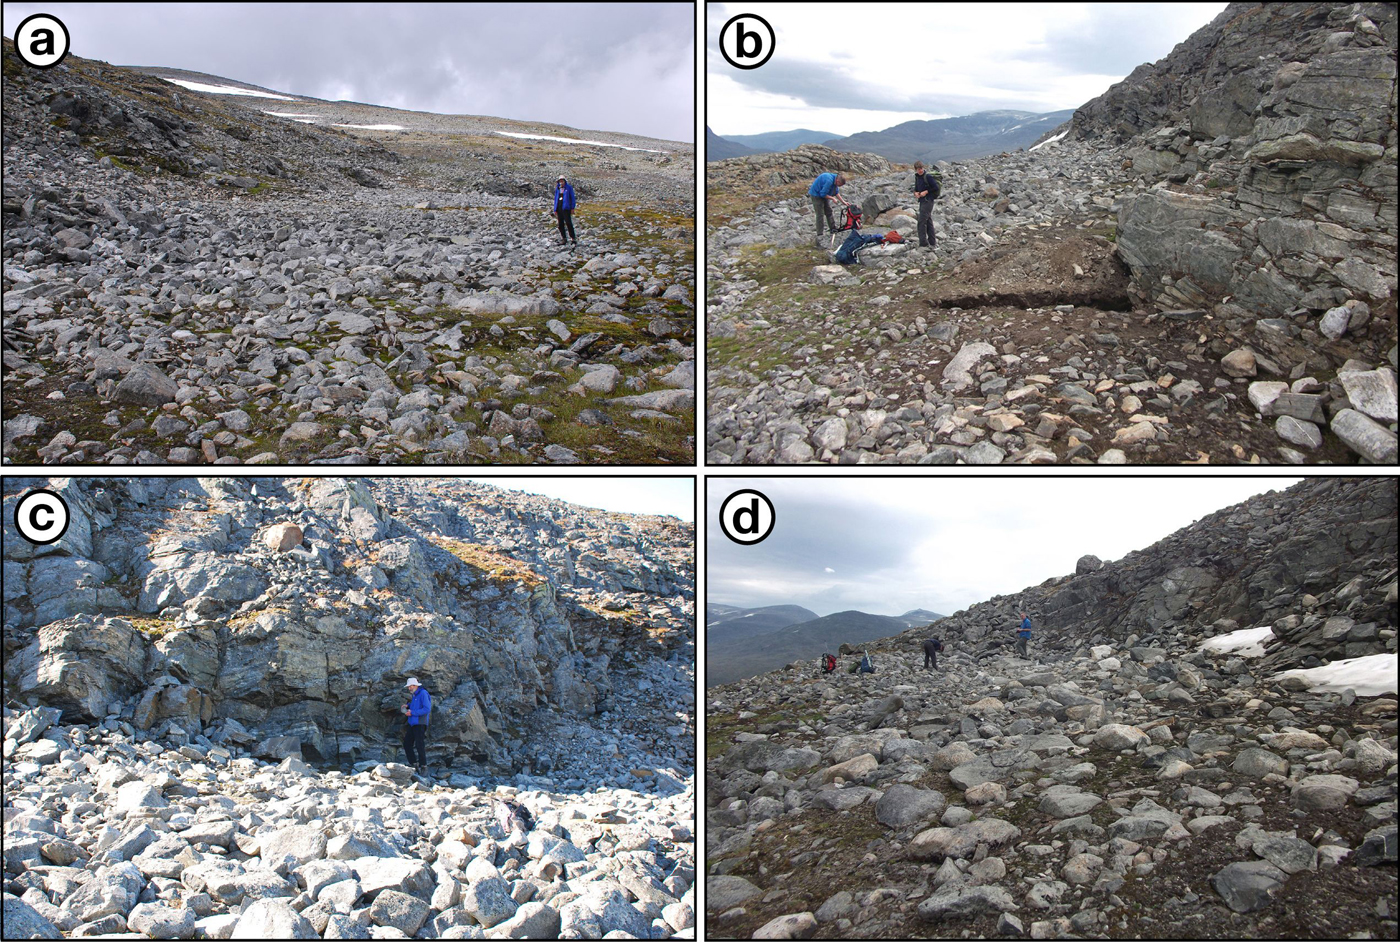
Figure 5. (colour online) Photographs of selected cryoplanation terraces: (a) general view of sites 1–3 on the main terrace viewed from the east (July 30, 2017); (b) general view of sites 6–8 on the main terrace from the northwest with excavation in the foreground (July 21, 2018); (c) site 6 from the north (July 21, 2017); and (d) site 10 from the west (July 17, 2018).
Clast characteristics on terrace treads and cliffs
Clasts on the inner part of the terrace tread (Table 1) are invariably more angular (combined angular and very angular clasts, 14%–77%) than those on the outer part (5%–35%). Furthermore, excluding site 4 (where the cliff is buried), the clasts on the cliffs are substantially more angular (49%–97%) than the clasts on the inner terrace treads. Although there is no trend in roundness or size of clasts along the length of the main terrace, site 8 has consistently higher proportions of angular clasts than any of the other sites on both the inner and outer treads and on the backing cliff. Angular clasts predominate on cliffs at most sites, but it is only at site 8 where the proportion approaches 100%. Elsewhere, there is a variable mixture of angular and edge-rounded clasts, the proportion of angular clasts reaching only 13% on the boulder ramp at site 4.
Table 1. Clast characteristics associated with terrace treads and cliffs: angular clasts include angular and very angular roundness categories; edge-rounded clasts include subangular, subrounded, and rounded categories; clast size = mean size of the 25 largest clasts in angular or edge-rounded categories (±95% confidence interval).
The size of the angular clasts on the treads tends to be larger (79–120 cm) than the size of the edge-rounded clasts (59–94 cm) with, in most cases, non-overlapping 95% confidence intervals. The proportion of in situ fractured clasts (Fig. 6a) on the treads is consistently low at all sites (3.1%–12.8%) with <6% at most sites.
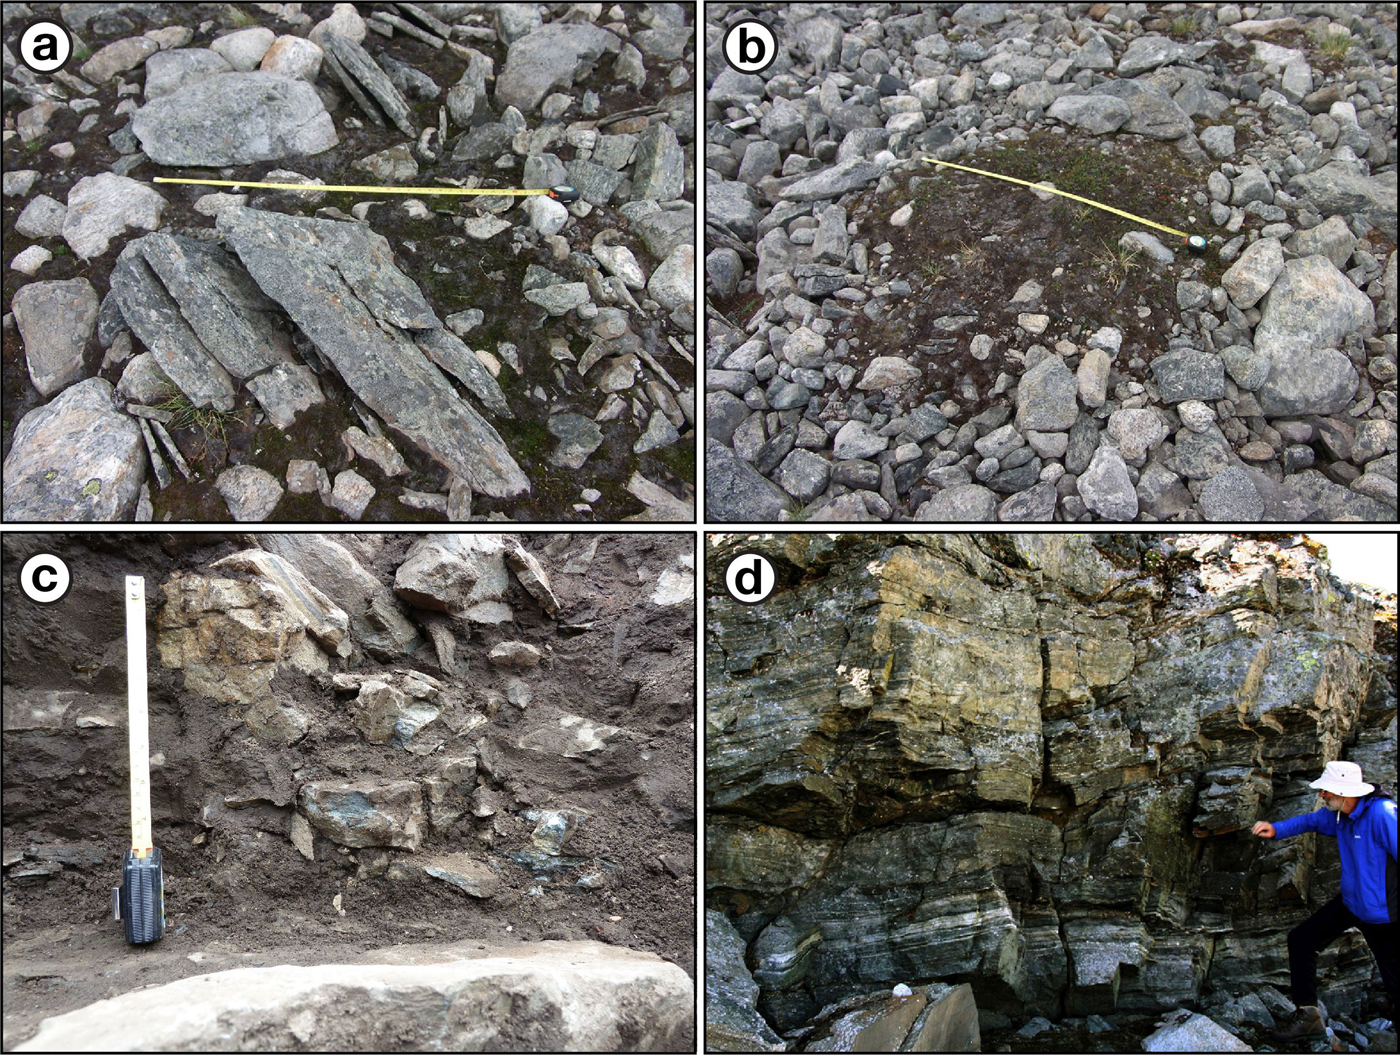
Figure 6. (colour online) Details from cryoplanation terrace treads and cliffs: (a) in situ split clasts at site 2 (scale length = 1.0 m); (b) sorted circle on the terrace tread at site 2 (scale = 1.0 m); (c) breccia below soil level at the base of the cliff at the site of the excavation shown in Figure 7 (scale = 20 cm); and (d) fractured bedrock close to the base of the cliff at site 6.
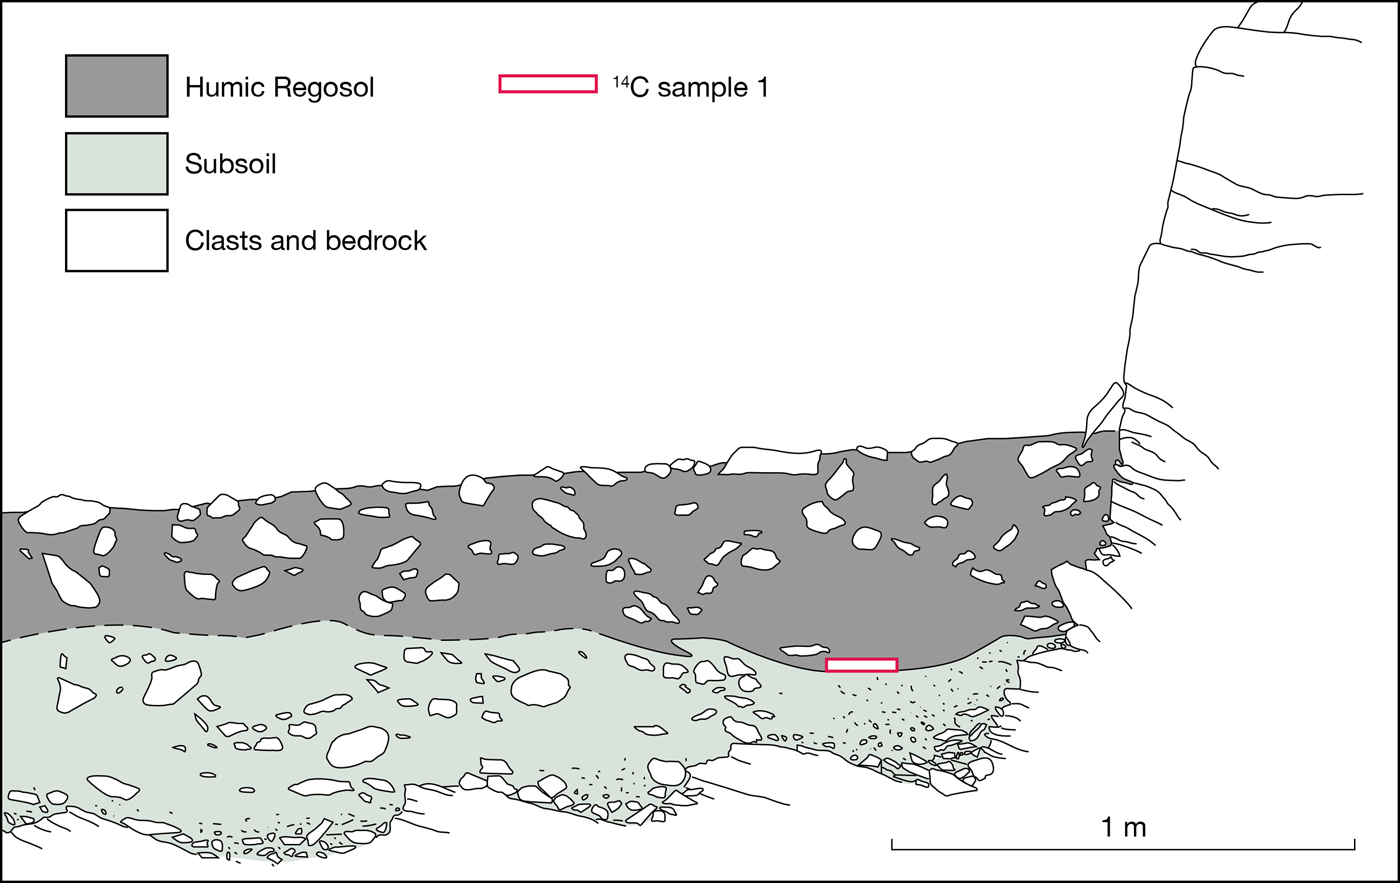
Figure 7. (colour online) Subsurface characteristics revealed by excavation of the main cryoplanation terrace between sites 5 and 6. Note especially the subsurface bedrock profile and the position of the radiocarbon dating sample at the base of the Humic Regosol.
Patterned ground on treads
Sorted circles (Fig. 6b) up to 2 m in diameter occasionally occur individually or in small groups in the low-angle tread surfaces. Their fine centres are clearly recognisable, but the outer boundaries of the clast-rich borders are poorly defined against the clast-covered tread surface. Poorly defined solifluction lobes also occur in a few places on the treads. However, most tread surfaces are characterised by a thin cover of angular and edge-rounded clasts forming a largely undifferentiated pavement of boulders and cobbles. Where present, patches of fines are generally vegetated with mid-alpine grass–heath and snow-bed plant communities.
Subsurface bedrock, regolith, and soil characteristics
The underlying bedrock terrace was located beneath 60–80 cm of regolith at the excavation between sites 5 and 6 (Fig. 7). The regolith consists of a matrix-supported diamicton, the <2 mm fraction of which consists of 43%–83% sand, 16%–49% silt, and 2%–8% clay (n = 6 samples). Median grain sizes of all six samples (50–150 µm) are frost susceptible according to textural limits for frost-susceptible sediments (Beskow, Reference Beskow1935; Harris, Reference Harris1981).
A well-developed Humic Regosol (Ellis, Reference Ellis1979, Reference Ellis1980) has developed in the uppermost part of the regolith. This soil is up to 45 cm thick and characterised by disturbed organic-rich, dark grey-brown layers and streaks (organic content 13.1%–15.2%) but no mineral horizon differentiation. With distance from the cliff base, the soil becomes lighter in colour and thinner and has more of the characteristics of an alpine Brown Soil (Ellis, Reference Ellis1979, Reference Ellis1980). Beneath the deepest organic-rich material, the lower part of the regolith (subsoil) has a much lower organic content (0.7%–2.6%) and an increasing density of rock fragments towards the underlying bedrock (see also Fig. 6c).
The bedrock terrace at the base of the excavation (Fig. 7) has a slope of 3°, which is comparable to the slope of the terrace tread at the site (5°). That the bedrock terrace is indeed in situ is confirmed by the strike and dip of 167° (range 154°–188°; n = 3) and 22° NE (range 18°–26°), which agree closely with the strike and dip in the exposed adjacent cliff of 138° (range 125°–177°; n = 9) and 18° NE (range 10°–26°). It should be noted that the second excavation failed to reach bedrock because of the presence of many large boulders throughout the regolith.
Joint spacing in cliffs
Vertical and horizontal joints occur frequently in the cliffs, commonly with an increase in density near the cliff base (Fig. 6d). The spacing of both vertical and horizontal joints is very variable, ranging from a few centimetres to 185 cm with no systematic pattern discernible between sites. Mean vertical and horizontal joint spacing (with 95% confidence intervals) for all sites is 50 ± 10 and 26 ± 2 cm, respectively; the closer spacing of horizontal joints reflecting the greater density of joints parallel to metamorphic layering, as seen in Figure 6d.
Seepage water at the cliff/tread junction
Water was observed seeping from joints at the base of the cliff at several sites despite former snow beds having melted away earlier in the summer (Fig. 8). The soil at the site of both excavations was damp, saturated with water in several places, and one of the trenches was slowly filling with water in late July 2018, despite the sites having experienced a severe drought for at least a month before these observations were made. Furthermore, a dry drainage channel crossed the tread of the terrace at site 2, beneath which the sound of flowing water could be heard, possibly indicative of piping.
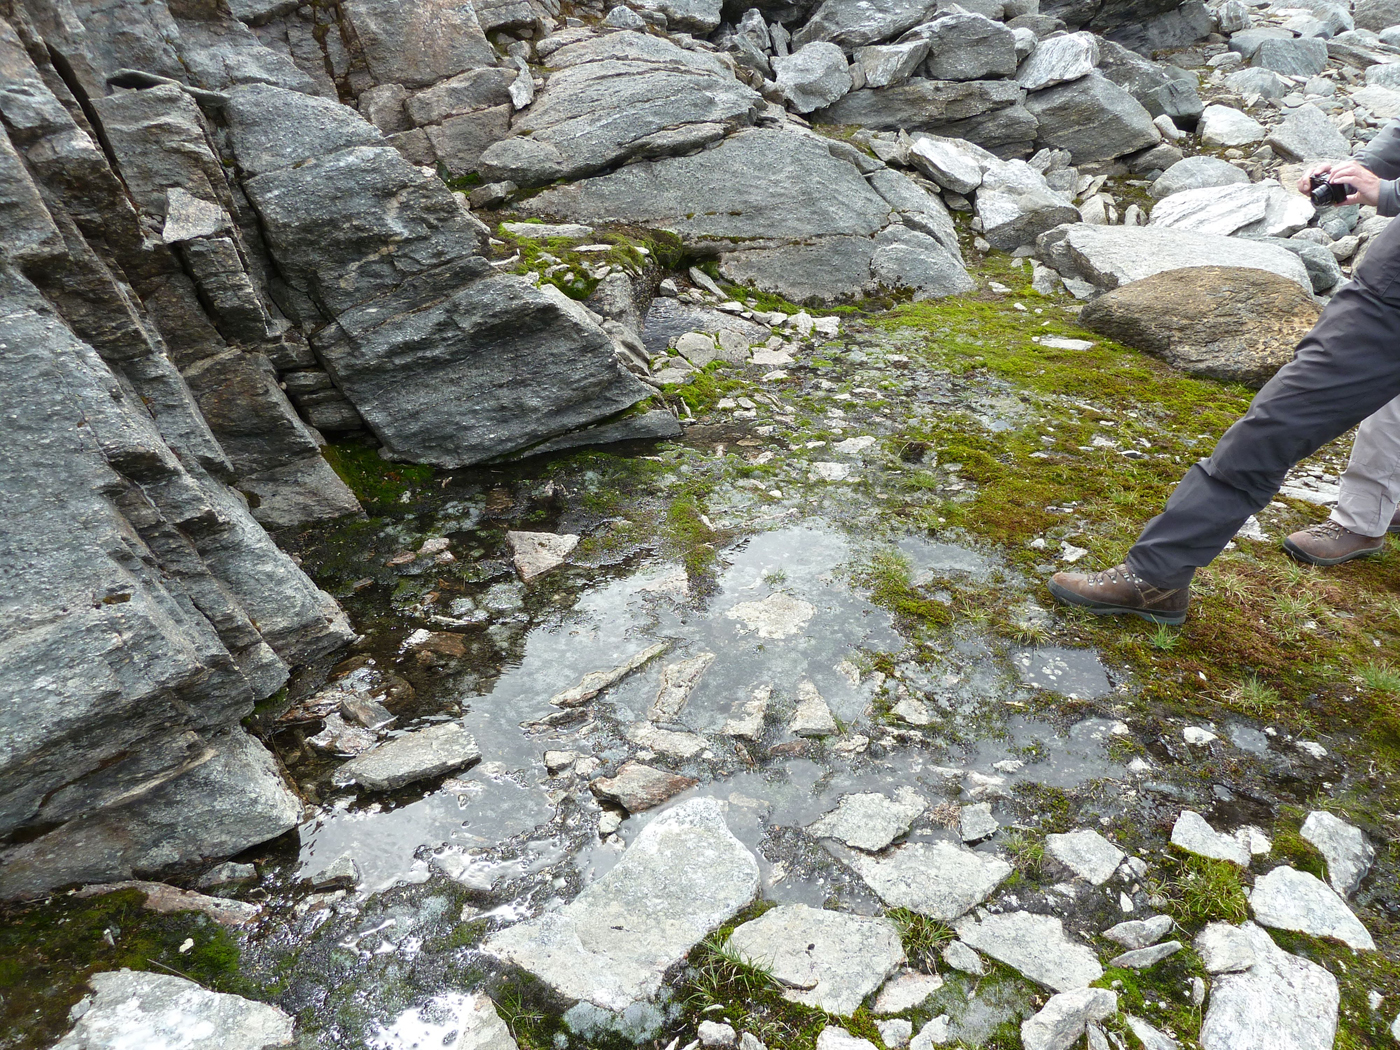
Figure 8. (colour online) Standing water at the cliff/tread junction produced by water seeping from the cliff base near site 6 (July 8, 2018).
R-values from terrace treads and cliffs
R-values for cliffs vary consistently along the length of the main terrace from a mean value of 42.59 ± 2.26 at site 1 to 59.66 ± 1.24 at site 8 (Table 2). The 95% confidence intervals demonstrate, moreover, that this spatial variation along the main terrace is highly statistically significant. Cliff sites from the upper terraces (sites 9 and 10) exhibit intermediate values. The R-value distributions (Fig. 9) consolidate these results and show highly variable, multimodal, negatively skewed, and/or relatively broad platykurtic distributions indicative of mixed-age populations and, hence, diachronous surfaces (Matthews et al., Reference Matthews, Winkler and Wilson2014, Reference Matthews, McEwen and Owen2015; Winkler et al., Reference Winkler, Matthews, Mourne and Wilson2016; Marr et al., Reference Marr, Winkler and Löffler2018). Only cliff site 8 exhibits the low-variability, unimodal, symmetrical distribution of R-values that is expected for a surface of uniform age. There is also a strong inverse relationship for cliff sites between R-value variability (as reflected in standard deviation values and confidence intervals) and mean R-values, which is consistent with an increase in variability as the extent of chemical weathering of the rock surfaces and the increase in mean rock surface age results in decreasing R-values (Aydin and Basu, Reference Aydin and Basu2005; Matthews et al., Reference Matthews, Nesje and Linge2013, Reference Matthews, Owen, Winkler, Vater, Wilson, Mourne and Hill2016).
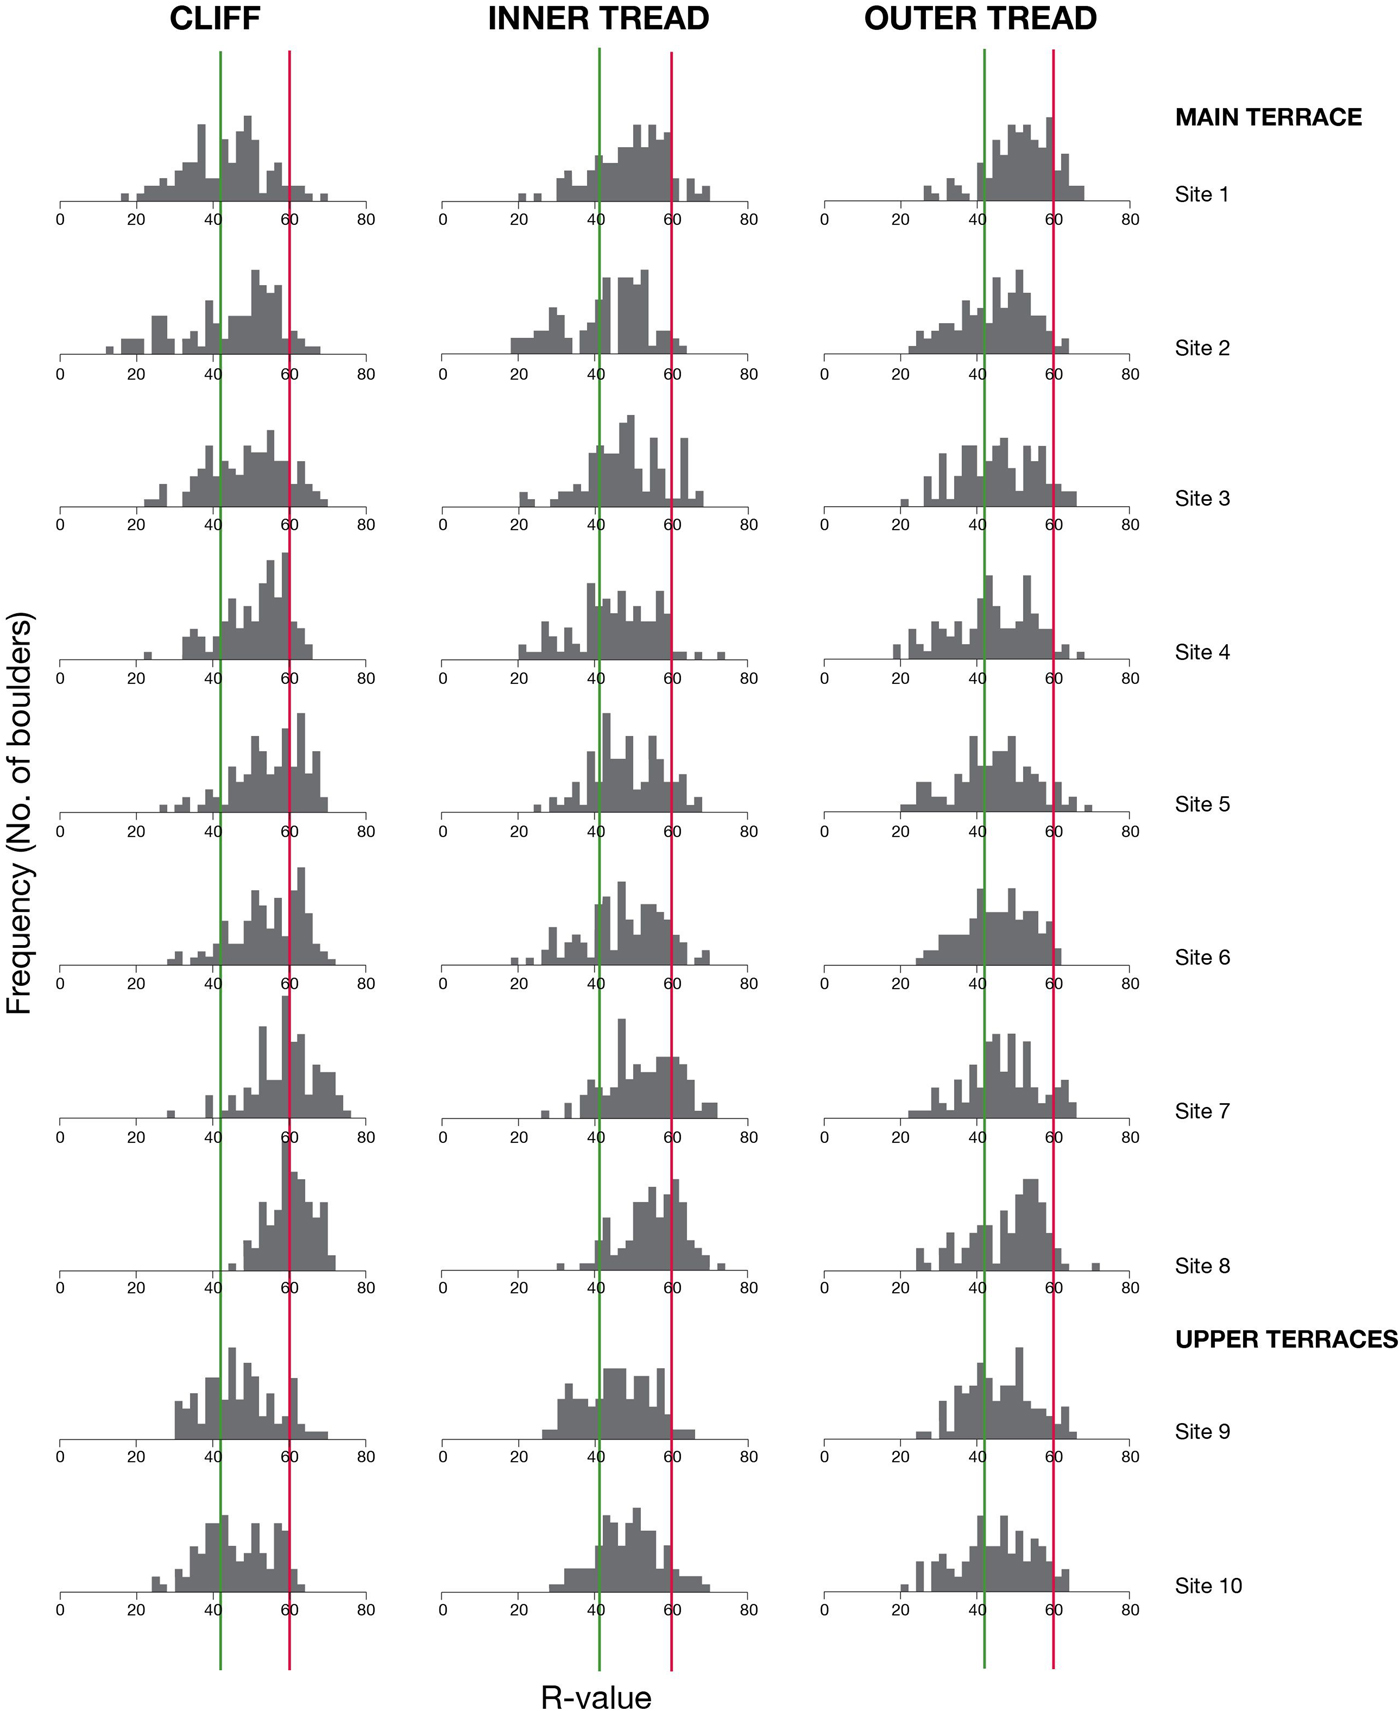
Figure 9. (colour online) Frequency histograms of R-values for cliffs and for inner and outer terrace treads, from the 10 sites. Vertical lines represent mean R-values for old and young control points, respectively.
Table 2. Schmidt-hammer R-values from cryoplanation terraces (surface boulders) and associated bedrock cliffs: SD, standard deviation; CI, 95% confidence interval; n = 100 impacts.
Mean R-values from inner terrace treads at sites 2–8 are, in most cases, significantly lower than those from the corresponding cliffs by up to 7 units, and mean R-values from outer terrace treads tend to be even lower, though not significantly lower than those from the inner treads (Table 2). These patterns suggest that the mixed-age boulder populations on the inner terraces are older than those on the bedrock cliffs and that the boulder populations on the outer terraces are even older. Furthermore, the long tails that characterise most of the R-value distributions in Figure 9 are clearly the result of the relatively old component of mixed-age populations. Apart from site 1, all the outer tread sites have mean R-values within the relatively narrow range of 43.19–47.47 and are therefore relatively old compared with the inner tread and cliff sites. Mean R-values from both the inner and outer treads at site 1 are, however, significantly higher than those of the corresponding cliff, which is not consistent with the results from the other sites and requires further explanation (see “Discussion”). At the upper terraces (sites 9 and 10), mean R-values from the terrace treads do not differ significantly from those of their cliffs and again exhibit intermediate values compared with the sites from the main terrace.
Control point R-values and calibration equation
R-values characterising potential control point surfaces from the local area (Table 3) include data from the mylonitised pyroxene-granulite gneiss surfaces used to derive the SHD calibration equation and calibration curve for this study (Fig. 10). These data are close to but differ slightly from those relating to non-mylonitised pyroxene-granulite gneiss obtained in this study (G1 and G2 in Fig. 1c and Table 3) and available from previous work (G3, from Matthews et al., Reference Matthews, Winkler and Wilson2014). Broad confidence intervals of the order of 1.0 R-value units reflect the variability of the local bedrock and suggest that R-values may be relatively high on recently exposed mylonite surfaces.

Figure 10. SHD calibration equation and calibration curve with 95% confidence interval for mylonitised pyroxene-granulite gneiss at Svartkampan.
Table 3. Schmidt-hammer R-values from local control-point surfaces of known age: SD, standard deviation; CI, 95% confidence interval; M, mylonitised pyroxene-granulite gneiss; G, pyroxene-granulite gneiss; n = no. of impacts; age of old control points = 9700 yr; age of young control points = 0–50 yr.
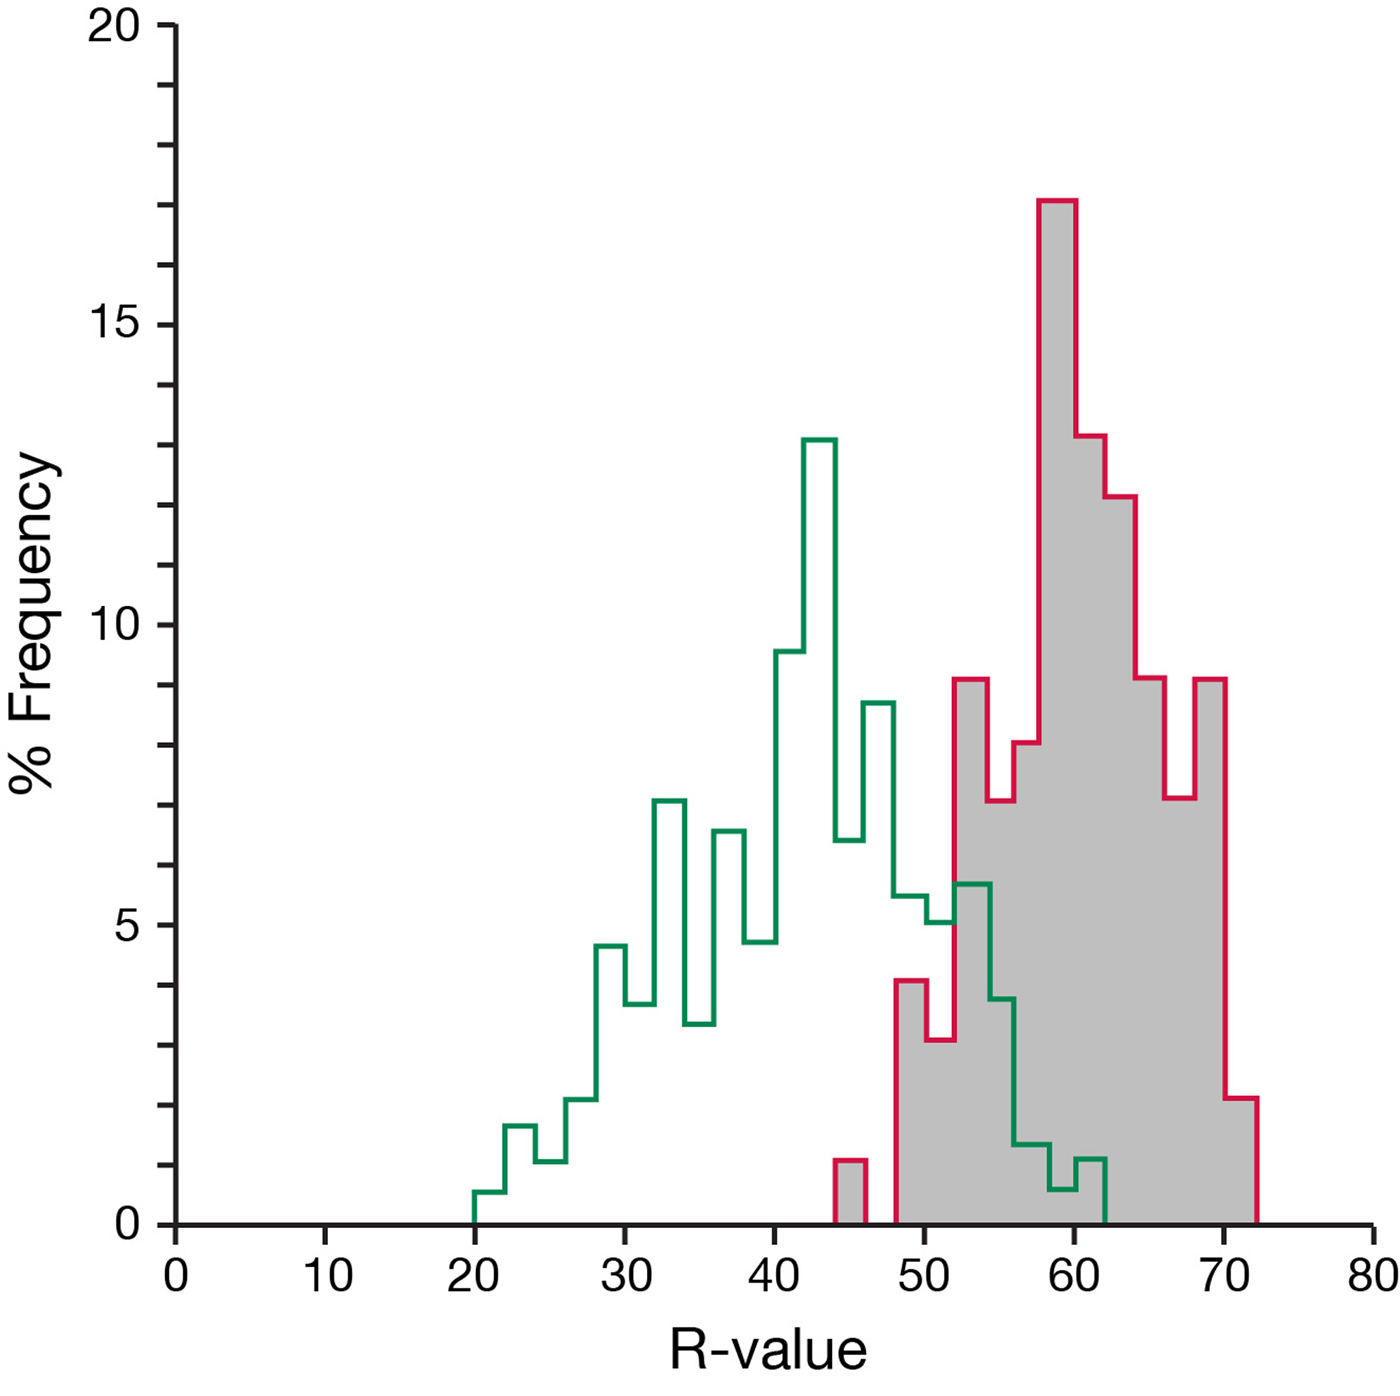
Although the old control point derived from mylonite has yielded intermediate R-values with respect to non-mylonitised surfaces of the same known age, it nevertheless represents the best surface available for obtaining calibrated ages for the cryoplanation terraces. The fact that the mean R-value of the mylonitised young control-point surface exceeds that of non-mylonitised boulders recently exposed on the Vesl Juvbreen glacier foreland (Matthews et al., Reference Matthews, Winkler and Wilson2014) supports our use of the cliff surface as a modern control surface. Furthermore, the percentage frequency distributions of R-values for both control points (Fig. 11) exhibit symmetrical distributions with no reason to doubt they are representative of single-age surfaces. It is particularly noteworthy that the distribution for the old control point lacks the low R-values and negatively skewed distributions that are characteristic features of most of the terrace treads and cliffs.

Figure 11. (colour online) Percentage frequency histograms of R-values for the old (9700 ka) and young (0 ka; grey shading) control points used in this study. Note that these symmetrical statistical distributions characteristic of single-age surfaces contrast with most of the distributions associated with the cryoplanation terraces in Figure 8.
SHD ages
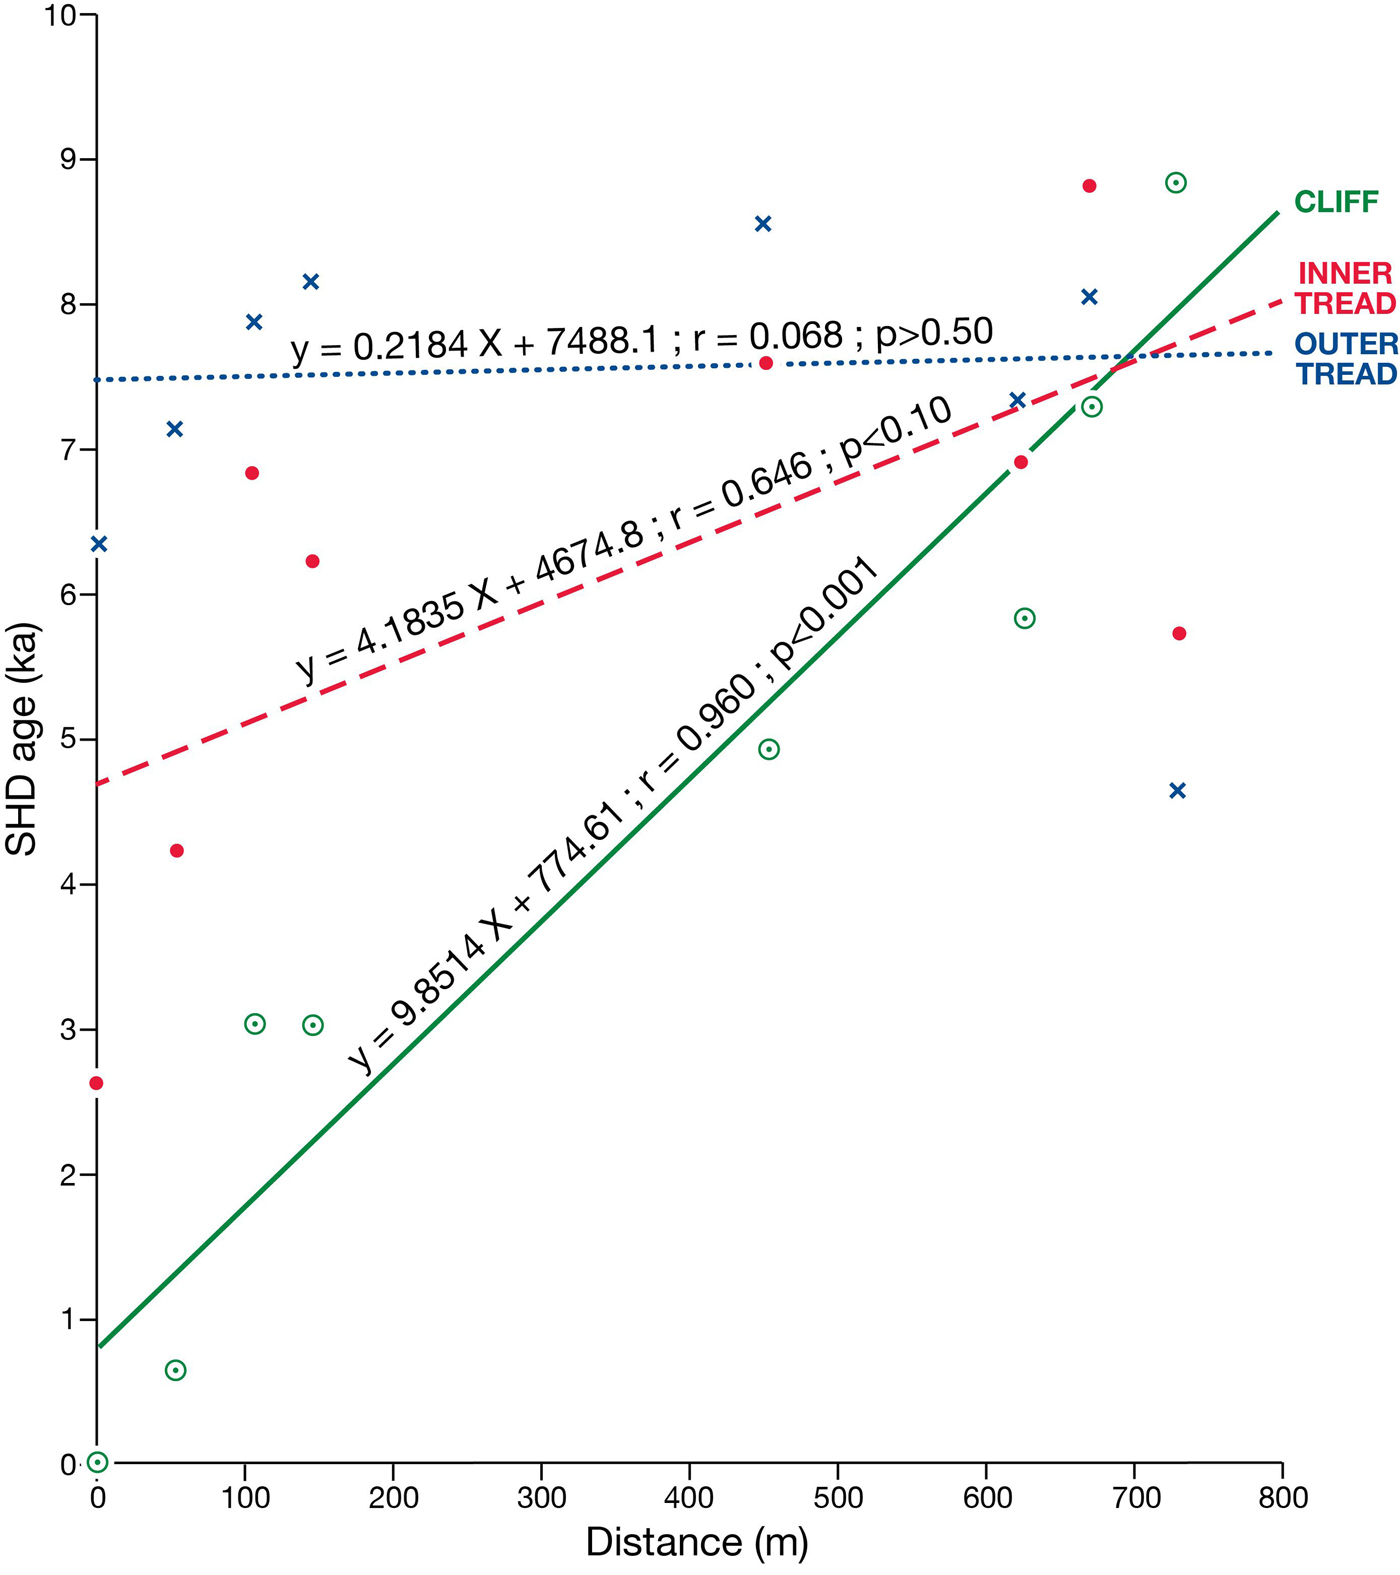
The consistent decrease in SHD age of the cliffs along the length of the main terrace from 8890 ± 1185 yr at site 1 to 0 ± 825 yr at site 8 clearly shows spatial variation in exposure age from west to east (Fig. 12; Table 4). Indeed, there is a statistically significant linear relationship (r = 0.96; p < 0.001) between SHD age and distance from site 1 (Fig. 13).

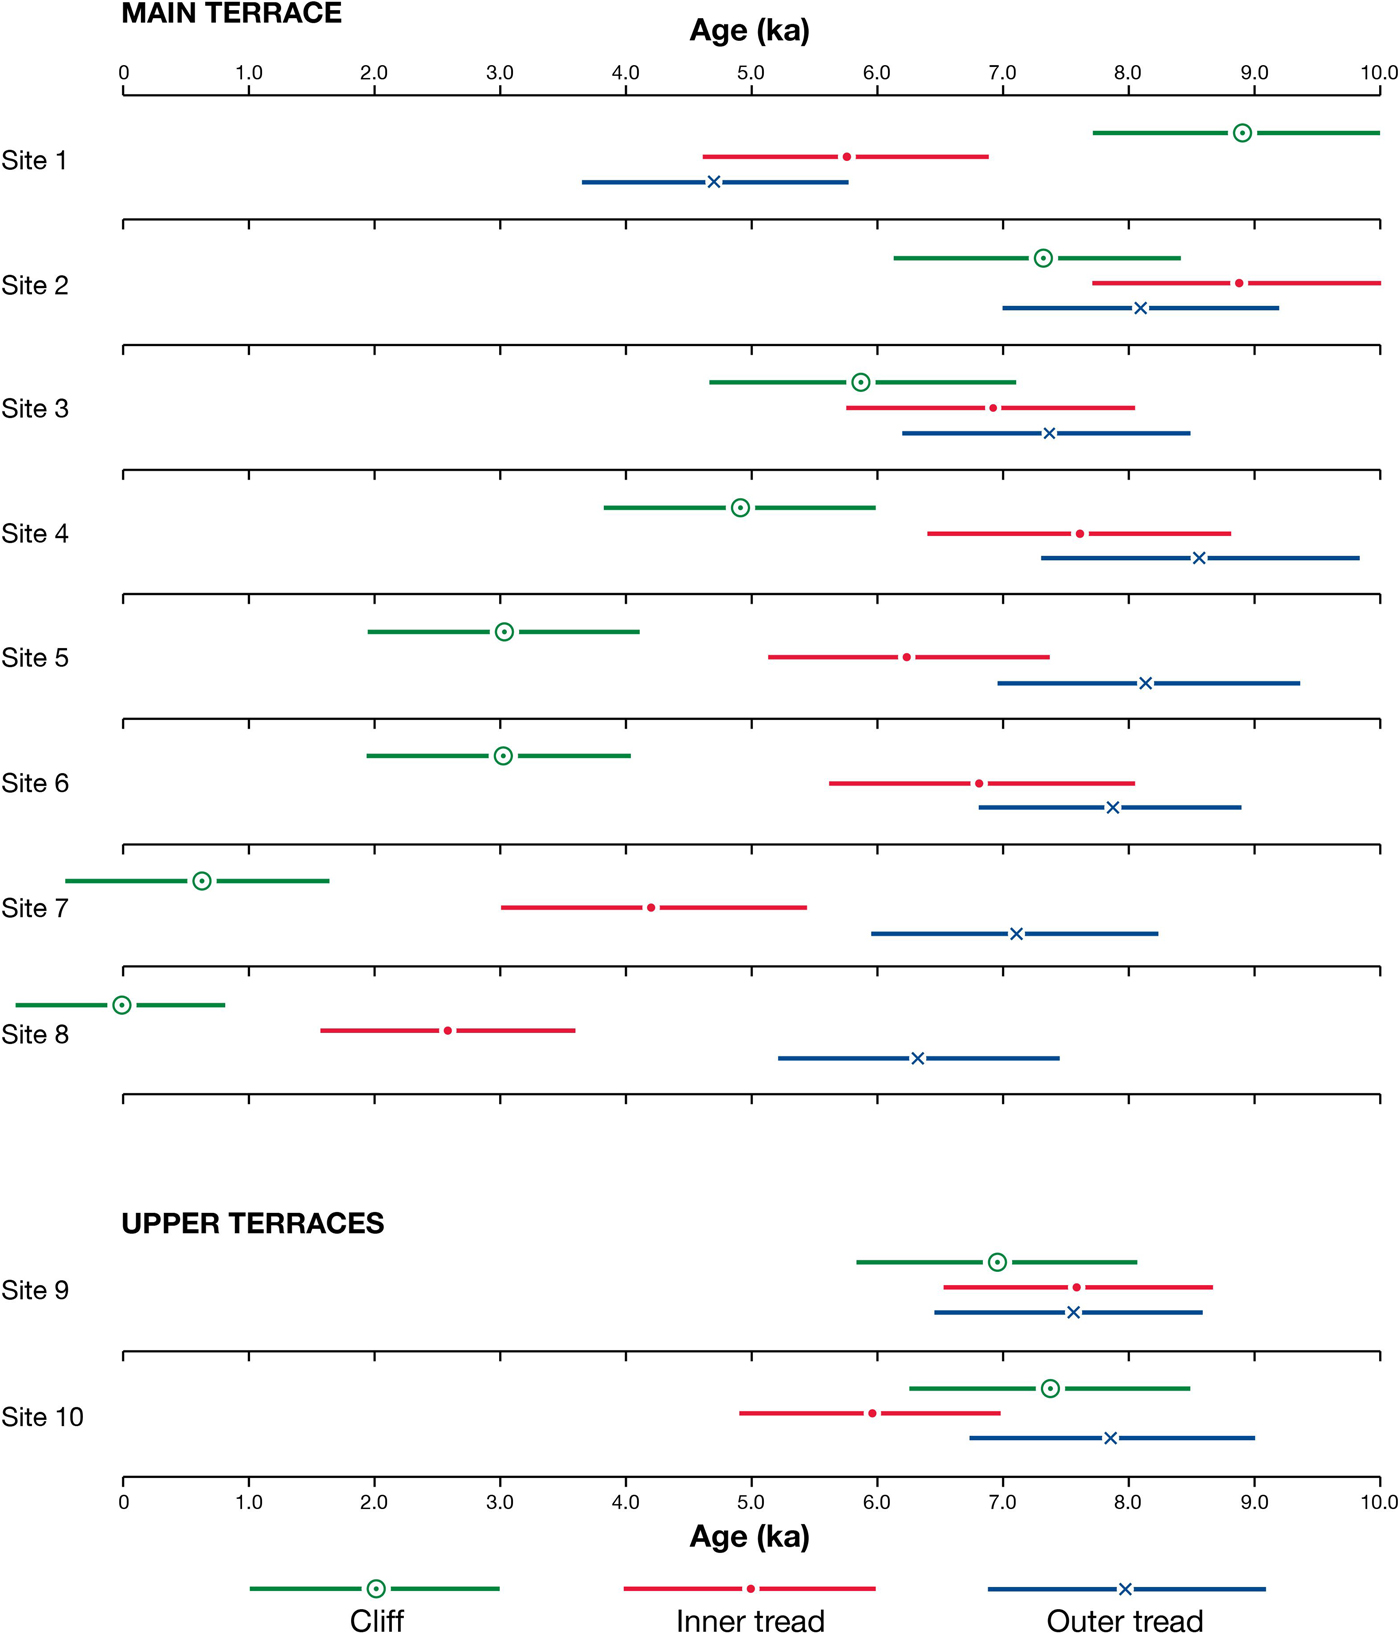
Figure 12. (colour online) SHD ages for cliffs, inner treads, and outer treads at sites from the main terrace (1–8) and the upper terraces (9 and 10). Horizontal bars are 95% confidence intervals.

Figure 13. (colour online) Linear regression analyses and correlation coefficients between SHD age and distance west from site 1 for cliffs, inner treads, and outer treads. Note differences in the slope, strength, and statistical significance of the relationships (n = 8 for each).
Table 4. Schmidt-hammer exposure-ages (years) from cryoplanation terraces and associated cliffs: SHD age = mean age ± 95% confidence intervals of surface boulders or bedrock cliffs; Cs and Cc are the error components used to calculate the confidence intervals (see text). All ages are rounded to the nearest 5 yr.

With the exception of site 1, confidence intervals show that the inner treads on the main terrace are consistently older than the cliffs, and there is a clear decrease in SHD age from sites 4 (7610 ± 1210 yr) through 8 (2605 ± 1000 yr), all of which have inner terraces that are significantly older than their cliffs. Although the linear relationship between SHD age and distance along the inner terrace is only marginally statistically significant when data from all eight sites are included (r = 0.65; p < 0.10; Fig. 13), there is considerable improvement in the strength of this relationship (r = 0.80; p < 0.05) if anomalous site 1 is omitted. The overlap in the confidence intervals for cliffs and inner treads at sites 2 and 3 indicate, however, little evidence of a significant difference in age. Also, again with the exception of site 1, the SHD ages of outer treads tend to be older than the inner treads but the age difference is relatively small and statistically significant only at sites 7 and 8 (Fig. 12). Thus, in general, terrace treads are older than their corresponding cliffs, and outer treads are the oldest parts of the terraces, the SHD ages of which range from 4690 ± 1025 yr at site 1 to 8575 ± 1270 yr at site 4. However, there is little evidence of any systematic variation in SHD age within the outer treads.
The upper terraces exhibit little variation in SHD age between the two sites or between cliffs and treads. With all ages between 5940 ± 1040 yr and 7855 ± 1130 yr, the exposure ages of the upper terraces are clearly intermediate between those of the youngest and oldest parts of the main terrace.
The anomalous pattern exhibited by site 1, where the cliff has a very much older exposure age than both the inner and outer treads (the SHD ages of which do not differ significantly from each other) is difficult to explain. Disturbance of the terrace tread by frost heave and frost sorting, bringing relatively unweathered boulders to the ground surface, provides a possible explanation.
14C ages
Two radiocarbon dates from two sides of the same trench, sampled at a distance of 50–60 cm from the cliff base, yielded a calibrated age between 3854 and 4821 cal yr BP at the 2σ range (Fig. 7, Table 5). This age estimate represents the maximum age of the overlying sedimentary material of the tread and a minimum age for the underlying bedrock platform at the sample point. The single date from the second excavation, sampled at a distance of 30 cm from the cliff, yielded the somewhat younger age estimate of 3345–3084 cal yr BP.
Table 5. Radiocarbon dates from the main terrace at Svartkampan. Depth = depth from the terrace surface; distance = distance from the bedrock cliff base.
DISCUSSION
Recognising cryoplanation terraces
Cryoplanation terraces are problematic, largely because their recognition and characterisation are based almost entirely on morphological evidence. There is a tendency, moreover, to attribute all bench-like landforms on hillslopes in periglacial environments to cryoplanation (Ballantyne, Reference Ballantyne2018). Furthermore, most examples referred to in the literature appear to be relict, and it has even been suggested that some such terraces are not characteristic of a periglacial environment at all, may be pre-Quaternary in age, and/or may simply reflect geologic structure (Büdel, Reference Büdel1982; French, Reference French2016, Reference French2018). Although this study is heavily reliant on morphological evidence, an advantage of the cryoplanation terraces at Svartkampan is that they are currently active, at least in part. We are confident, therefore, that the combination of morphological evidence with dating evidence, field observations relevant to structure and process, and the general climatic characteristics of the sites provides a firm basis for attributing their origin to cryoplanation.
Dating cryoplanation terraces
There have been few previous attempts to date cryoplanation terraces, none of which have had much success. Vague generalisations have resulted from relative-age dating based on morphostratigraphy, weathering-rind thickness, vegetation, or lichen cover (Péwé, Reference Péwé1970; Reger, Reference Reger1975; Lauriol et al., Reference Lauriol, Lalonde and Dewez1997; Nelson, Reference Nelson1998). However, it has been concluded that they probably develop over very long periods of time, which supports similar ideas based on the observation that they are well developed in terrain that has never been glaciated or was not glaciated during the last glaciation (Reger and Péwé, Reference Reger and Péwé1976; Lauriol and Godbout, Reference Lauriol and Godbout1988; Nelson and Nyland, Reference Nelson and Nyland2017). To the authors’ knowledge, the results of numerical-age dating techniques have been presented in two published papers only (Cremeens et al., Reference Cremeens, Darmody and George2005; Lauriol et al., Reference Lauriol, Lamirande and Lalonde2006): the first applied 36Cl cosmogenic-nuclide exposure-age dating to two possible cryoplanation summit flats; the second obtained nine 14C dates from the regolith cover of the treads of undoubted cryoplanation terraces.
In the present study, we have used two numerical-age dating techniques in the context of cryoplanation terraces for the first time, including the first application of SHD. Comparable results have been achieved from the extensive use of SHD on bedrock exposed in the backing cliffs and on the boulder cover of treads; and these results are in turn compatible with the 14C dating of organic sediments buried beneath the surface of treads. The SHD ages provide evidence of the extent to which the terraces are currently active, while the 14C ages provide estimates of maximum rates of cliff recession and terrace extension during the late Holocene. However, neither approach yields close estimates of landform age defined as the period of time over which the cryoplanation terraces formed.
SHD ages and current activity
For a diachronous surface, SHD age estimates the average exposure age of the sampled surface (Matthews et al., Reference Matthews, Winkler and Wilson2014, Reference Matthews, McEwen and Owen2015; Winkler et al., Reference Winkler, Matthews, Mourne and Wilson2016). The bedrock and boulder surfaces sampled from the cryoplanation terraces in this study vary considerably in their average exposure age (Fig. 12, Table 4). Only the bedrock cliff sampled at site 8, with an SHD age of zero, is representative of a uniformly modern, active surface. All the other surfaces represent mixed-age populations, with increasing levels of activity and decreasing exposure age and current activity along the length of the main terrace from west to east (sites 1 to 8). The remarkable linear SHD age and, hence, activity gradient exhibited by the cliffs (Fig. 13) show not only that the cliffs at the eastern end of the main terrace are the most active but also that those at the western end are essentially relict. Indeed, the SHD age of the cliff at site 1 (8890 ± 1185 yr) indicates very little activity except <1000 yr after deglaciation.
The pattern of SHD ages between the cliffs, inner treads, and outer treads, which is most apparent towards the eastern end of the main terrace (sites 5 to 8), is also enlightening (Fig. 12). The fact that the inner tread is significantly older than the cliff at these sites and that the outer tread is even older (significantly so at sites 7 and 8) points to the cliffs being the source of the relatively fresh boulders in the treads. These relatively fresh boulders, having been added to an older boulder population, would have reduced the average exposure age of the surface boulders of the tread. This interpretation of the ages is supported by the clast roundness analyses, which demonstrate that the proportion of angular clasts in the cliffs is higher than on the treads and that the proportion on the inner treads tends to be higher than on the outer treads. Thus, the greater proportion of weathered clasts on the treads gives rise to the older SHD ages.
In theory, frost disturbance may reduce the exposure age of clasts on the treads. Frost heave and frost sorting have the potential to bring relatively unweathered clasts to the surface, and frost fracturing of clasts embedded in the tread may expose fresh, unweathered rock surfaces. However, as the observed pattern of SHD ages (i.e., inner treads are older than cliffs and outer treads are characterised by the oldest ages) is the opposite of what would be the expected outcome of these disturbances, none of these disturbances are likely to have had an appreciable effect on the SHD ages (except, perhaps, at site 1).
Rate of terrace formation and landform age
The radiocarbon dates of ~3000, 4000, and 5000 cal yr BP for organic material at the base of the Humic Regosol at distances of 30, 50, and 60 cm, respectively, from the bedrock cliff (Fig. 7, Table 5) provide maximum estimates for the rate of bedrock cliff recession and terrace extension of ~0.10, 0.125, and 0.12 mm/yr, respectively. These values are comparable to the measured rockwall recession rates compiled from a wide range of lithologies in arctic and alpine periglacial environments (Murton, Reference Murton and Elias2013; Ballantyne, Reference Ballantyne2018; French, Reference French2018).
Given that the deglaciation of Svartkampan occurred 9700 yr ago, maximum cliff recession rates on the order of 0.1 mm/yr are insufficient for the cryoplanation terraces to have been eroded entirely within the Holocene. Indeed, extrapolation of this rate implies that at least 56–176 ka would be required to erode the terraces, the widths of which range from 7 to 22 m. We conclude, therefore, that the onset of terrace formation is likely to have occurred before the last (Weichselian) glacial maximum, in periods with a periglacial climate. Subsequent survival of terraces also seems likely, which would have been possible under a relatively thin, cold-based ice sheet (cf. Kleman, Reference Kleman1994; Hättestrand and Stroeven, Reference Hättestrand and Stroeven2002; Juliussen and Humlum, Reference Juliussen and Humlum2007; Marr et al., Reference Marr, Winkler and Löffler2018).
It must be acknowledged, however, that the inference of a wholly periglacial origin for the terraces depends on several assumptions, namely: (1) our estimated maximum rate of cliff recession is representative for the late Holocene; (2) similar rates can be applied to the entire Holocene and also to pre-Holocene periglacial regimes; and (3) alternative processes (such as differential subglacial erosion) did not contribute to these landforms. The third assumption may not be reasonable, given the nature of the regolith that covers the bedrock surface of the treads. It is apparent that much of the regolith consists of a diamicton, with many edge-rounded clasts and abundant fine matrix. Similar edge-rounded clasts occur on the cliffs and completely bury the cliff at site 4. Both the diamicton and the edge-rounded clasts most likely originated as till, deposited during deglaciation and subsequently reworked by periglacial mass wasting. It is not unrealistic to suggest, therefore, that subglacial erosion through plucking contributed to preparation and erosion of the cliff before the Holocene and hence could account for a substantial share of the present-day width of the terraces.
Frost-weathering processes on the cliffs
Frost weathering is conventionally regarded as the primary process in explaining the backwearing of cliffs in the context of cryoplanation terraces (Boch and Krasnov, Reference Boch, Krasnov and Evans1994; Demek, Reference Demek1969a; Reference Demek1969b; Priesnitz, Reference Priesnitz and Clark1988; Czudek, Reference Czudek1995). However, the sparsity of direct-process studies has been universally recognised as a major problem in their interpretation. Nevertheless, several lines of indirect evidence from Svartkampan point strongly to the main process being the production of relatively large rock fragments by frost wedging (alternatively termed “macrogelivation”) as a result of the freezing of water in preexisting cracks (Murton, Reference Murton and Elias2013; Ballantyne, Reference Ballantyne2018).
First, the modern cliff at site 8 and active parts of cliffs at the other sites are clearly the main source of the clasts littering the inner treads of the terraces. These well-jointed cliffs (frost-riven cliffs, to use the term commonly employed in cryoplanation research) produce clasts that match those on the inner treads in terms of exposure age, angularity, and size. The low proportions of in situ fractured clasts on the treads indicate, moreover, that comminution of existing clasts is not a feasible alternative source for abundant, large angular clasts on the treads (cf. Berrisford, Reference Berrisford1991).
Second, abundant moisture is available at the base of the cliffs from groundwater, which originates from permafrost thaw and summer rainfall as well as snowmelt. Water is as essential as subzero temperatures for frost weathering (Hall et al., Reference Hall, Thorn, Matsuoka and Prick2002; Thorn and Hall, Reference Thorn and Hall2002; Thorn et al., Reference Thorn, Darmody, Dixon, Martini, French and Pérez Albertini2011). It remains available at the Svartkampan sites during freezeback, enabling ice to form in preexisting joints and cracks. Frost wedging is most likely to occur at this time in response not only to the volumetric expansion of ice in the cracks but also to the growth of segregation ice as water migrates towards a freezing front that is penetrating deep into the cliff (cf. Walder and Hallet, Reference Walder and Hallet1985; Matthews et al., Reference Matthews, Dawson and Shakesby1986; Hallet et al., Reference Hallet, Walder and Stubbs1991; Murton et al., Reference Murton, Peterson and Osouf2006; Matsuoka and Murton, Reference Matsuoka and Murton2008). Although the development of segregation ice has been investigated and discussed largely in relation to porous rocks, it would also be expected in association with interconnected microcracks in the layered mylonitised gneiss at Svartkampan. Significantly, cryoplanation terraces and other frost-riven cliffs in the Sudetes Mountains (Central Europe) appear to be preferentially associated with gneissic and schistose bedrock (Traczyk and Migon, Reference Traczyk and Migon2000).
Third, evidence for fractured bedrock and in situ, loosely attached rock fragments forming breccia is particularly abundant close to the foot of the cliff, both above (Fig. 6d) and below (Fig. 6c) the surface of the tread. This is precisely where groundwater seepage occurs and, hence, where most water is available for ice formation in cracks, and where frost weathering would be expected to undercut the cliff, producing the sharp cliff/tread junction and maintaining the terrace cross-profile shape. Maximum seepage at the cliff base is attributed to the topography of the ground surface, combined with high joint density and the configuration of the still-frozen substrate.
Fourth, both cliff and buried bedrock surfaces (Fig. 7) cut across bedrock structures, effectively excluding an explanation based purely on geology. In the absence of evidence for alternative processes capable of producing flights of such terraces, this has generally been accepted as strong evidence for cliff recession as a result of frost weathering, provided debris removal by mass wasting is sufficient to prevent the accumulation of debris at the cliff base (Demek, Reference Demek1969b; Priesnitz, Reference Priesnitz and Clark1988; Czudek, Reference Czudek1995; Nelson and Nyland, Reference Nelson and Nyland2017).
Transport processes on the treads
Transport of sediments across the treads of cryoplanation terraces is commonly attributed to solifluction and flowing water, with gelifluction, frost creep, slopewash, sheet wash, snow meltwater, suprapermafrost meltwater, infiltration water, subsurface flow, piping, and suffosion all having been mentioned in the literature (Demek, Reference Demek1969b; Czudek and Demek, Reference Czudek and Demek1971; Reger and Péwé, Reference Reger1975; Priesnitz, Reference Priesnitz and Clark1988; Lauriol, Reference Lauriol1990; Czudek, Reference Czudek1995). Solifluction and various types of water flow occur at Svartkampan, but the observational and dating evidence presented earlier indicate that such transport must have been extremely slow throughout the Holocene. Although supranival transport cannot be ruled out as a contributory process, the coarser material could not have been moved by most of the water-flow processes. Furthermore, many of the edge-rounded surface clasts and most of the silty-sand matrix comprising the regolith seem to have originated as till that was deposited during deglaciation. Subsequently, the frost-susceptible regolith was disturbed by solifluction but, according to our dating, it was transported no more than a few metres across the terraces during the Holocene.
Solution (Rapp, Reference Rapp1960; Lauriol et al., Reference Lauriol, Lalonde and Dewez1997; Thorn et al., Reference Thorn, Darmody, Dixon, Martini, French and Pérez Albertini2011) and wind transport (Demek, Reference Demek1969b; Lauriol et al., Reference Lauriol, Lalonde and Dewez1997; Lamirande et al., Reference Lamirande, Lauriol, Lalonde and Clark1999) probably contributed to the removal of some fines from the regolith at some places and times, but these processes cannot have had a major effect on the overall volume and fabric of the regolith over the Holocene time scale. Similarly, cryoturbation and frost sorting undoubtedly contributed to disturbance of the frost-susceptible regolith and may well have favoured infiltration, the concentration of surface and subsurface water flow, and piping (Priesnitz, Reference Priesnitz and Clark1988), while leaving the bulk of the regolith intact.
Developmental model of cryoplanation terraces
Various seasonal processes contribute to the development of active cryoplanation terraces at Svartkampan. The presence of groundwater near the cliff base during autumn and early winter freezeback is of critical importance (Fig. 14a). At this time, groundwater is moving downslope under gravity along cracks and joints within the active layer of the cliff and emerging near the base of the cliff where the groundwater table intersects the ground surface. Permafrost and/or infiltration of rainwater must be the major water source as, by this time, the late-lying snow beds have melted away. Also, groundwater in the active layer cannot penetrate the permafrost, which is acting as an aquiclude, or at least an aquitard (Woo, Reference Woo2012; Liao and Zhuang, Reference Liao and Zuang2017). Thus, above the permafrost table, and especially at the cliff base, groundwater is available for ice wedging and/or the growth of segregation ice during refreezing of the active layer.
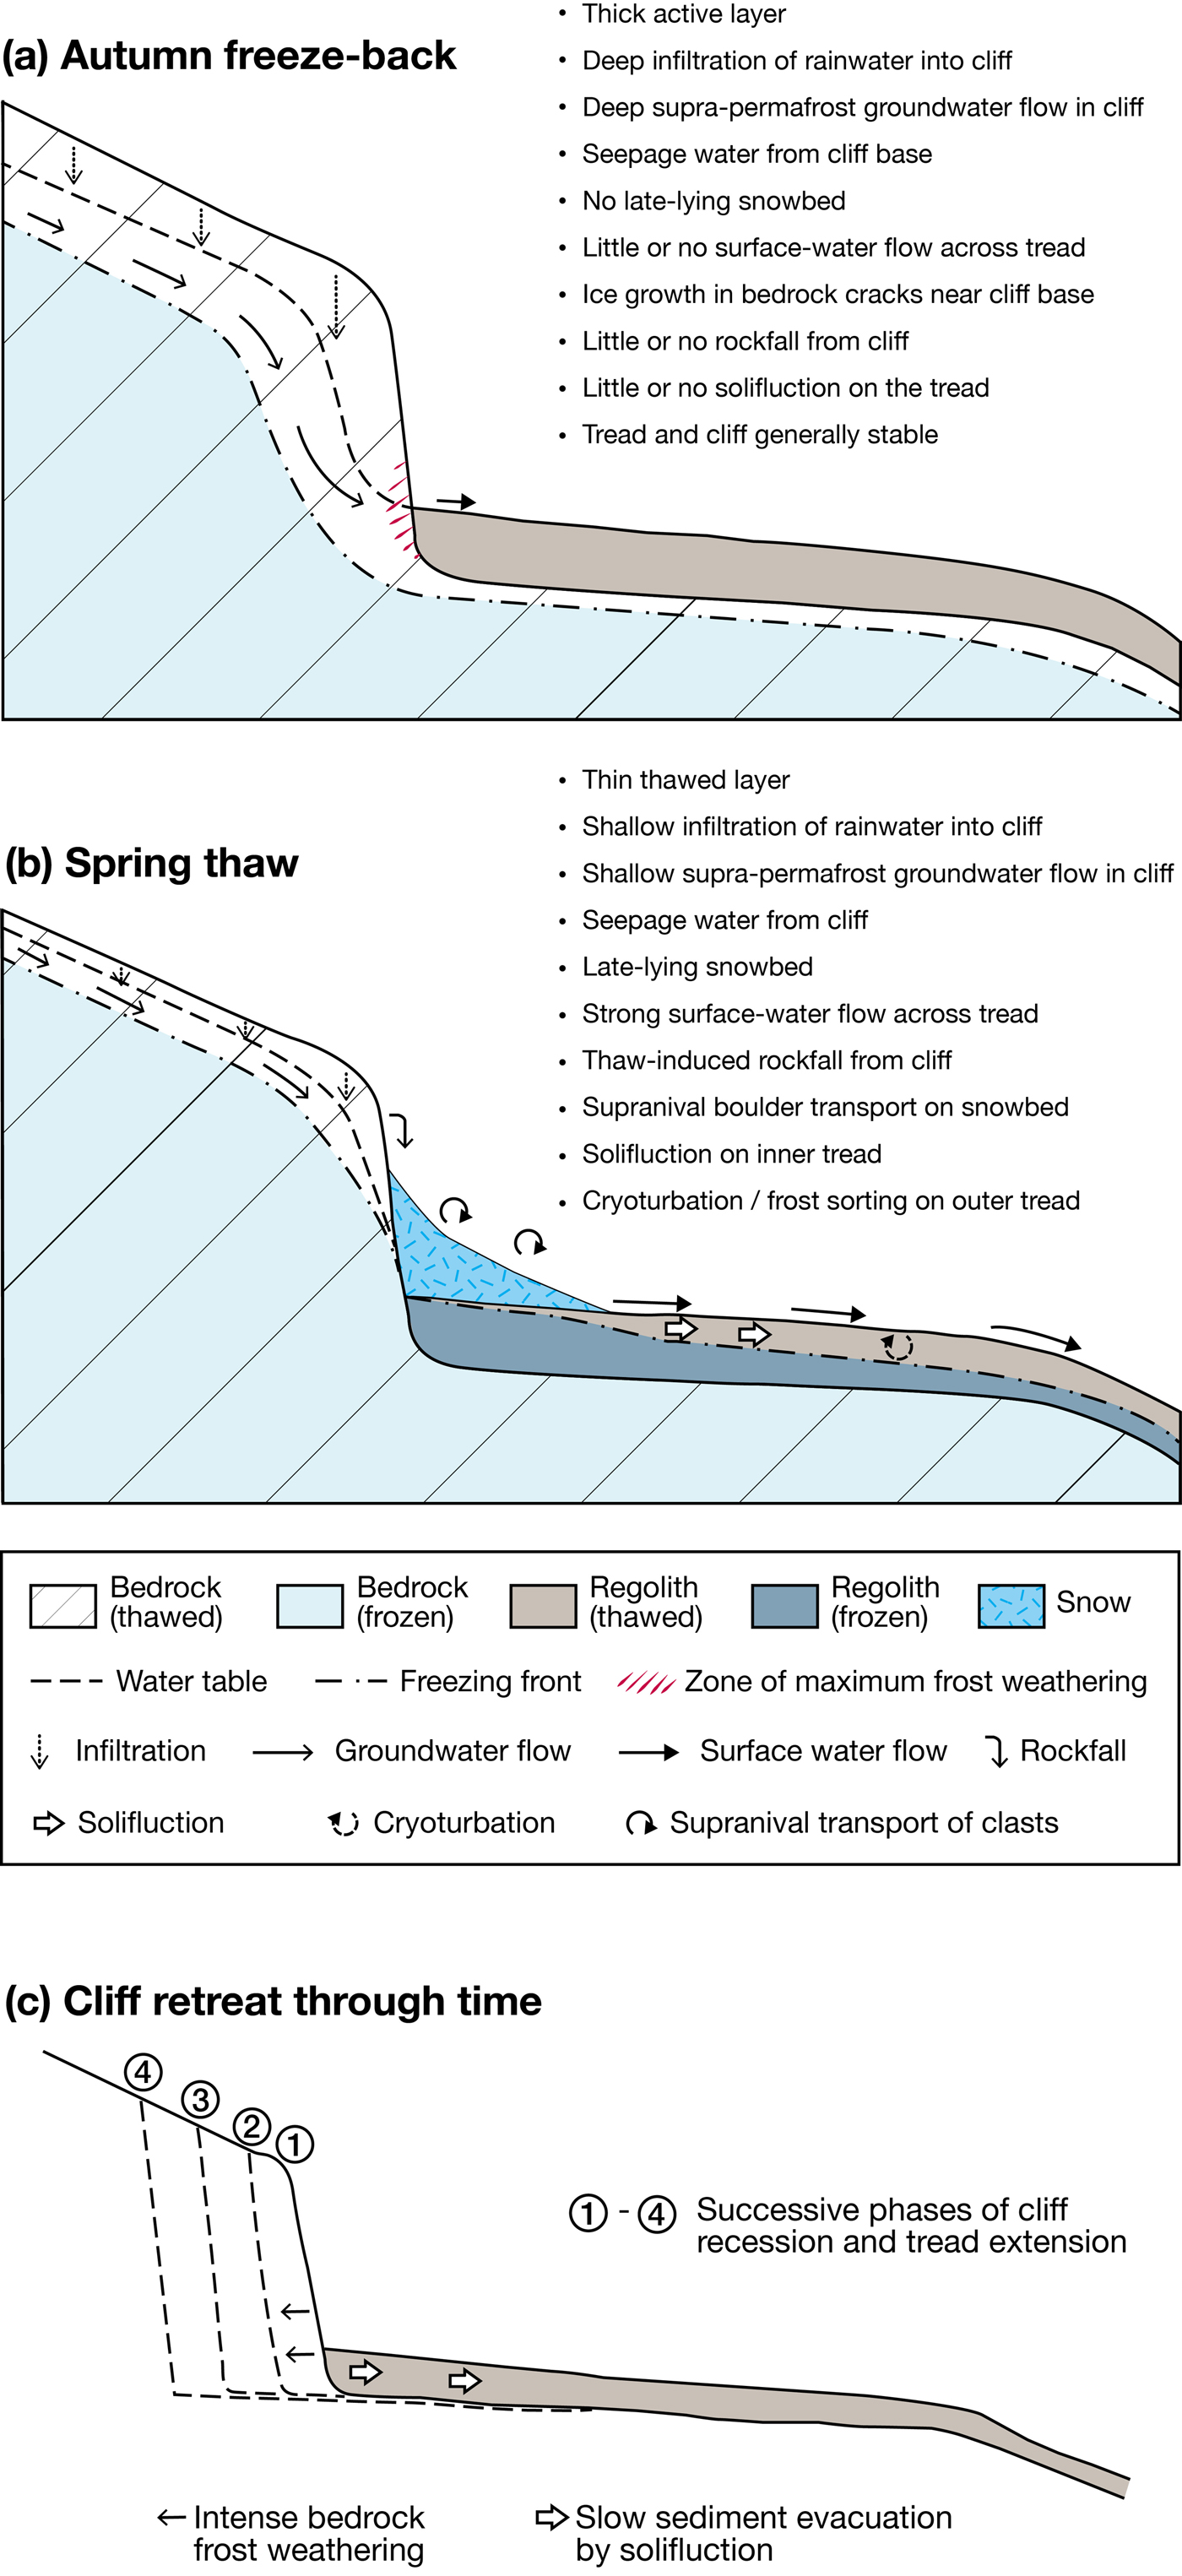
Figure 14. (colour online) Schematic process-based model of cryoplanation terrace development: processes associated with an active cryoplanation terrace at Svartkampan during (a) autumn freezeback (before the start of freezing) and (b) spring thaw (after thawing has started); and (c) the developmental sequence of parallel cliff retreat due primarily to frost weathering of bedrock close to the cliff/tread junction. Note that diagonal lines in the bedrock represent the orientation of the mylonitic layering.
Transportation of debris across the terrace tread takes place mainly during the spring and early summer, when thaw consolidation leads to solifluction and snow meltwater is abundant (Fig. 14b). Also in spring and summer, melting of ice in the cliff is likely to trigger rockfall onto the terrace tread, either directly or indirectly via the snow bed surviving at that time on the inner tread. However, rates of solifluction are very slow due to the low gradient of the tread and the outer tread tends to be more stable than the inner tread, affected less by solifluction and perhaps more by cryoturbation and frost sorting. Beneath the regolith-covered inner terrace tread, the active layer is likely to be thinner than beneath the bedrock cliff because of its higher ice content and the consequent greater amount of latent heat required to thaw the ground. In addition, the active layer will tend to be thinner under the snow bed due to the insulating properties of late-lying snow. Conditions are different on the tread during freezeback: the snow bed has melted away, surface sediments are drier, and the reduced availability of water leads to relatively low rates of bedrock frost weathering beneath the tread.
Over the long term, the zone of maximum frost weathering close to the cliff base leads to the cliff being undercut and to parallel retreat of a near-vertical cliff (Fig. 14c). This model bears some similarity to that originally proposed by Boch and Krasnov (Reference Boch, Krasnov and Evans1994), namely enhanced frost weathering towards the cliff base, comparatively little lowering of the bedrock beneath the terrace tread, parallel retreat of the cliff over time, and solifluction as the main process evacuating sediment across the tread. However, several important new features of our model should be highlighted, particularly: (1) undercutting of the cliff by frost weathering at the cliff/tread junction, which produces and maintains a near-vertical cliff; (2) provision of a groundwater-based mechanism for cliff recession; (3) seasonal dimensions to both cliff recession and sediment evacuation from the tread; and (4) negligible lowering over time of the near-horizontal bedrock surface beneath the tread, attributed to the thermal properties of the regolith cover, leading to a relatively thin active layer that may not penetrate far into the bedrock.
Structural control of terrace initiation?
As with earlier models that more or less require an initial cliff-like form, our model does not provide an explanation for the initiation of cryoplanation terrace development. Without an appropriate preexisting landform, it is difficult to see how enhanced frost weathering would produce such a cliff on a land surface with a uniform slope angle. Possible precursors (proto-cliffs) might be controlled by geologic structure and/or accentuated by selective glacial erosion at times when a Pleistocene ice sheet was not cold based and protective. Dilatation joints and exfoliation following repeated glacial loading and unloading might also be considered, but ultimately, no definite answer can be given. From the alignment and location of the terraces, at least some form of structural control of a proto-cliff seems likely (though subsequent cliff retreat does not follow the smaller-scale bedrock structures).
Permafrost promotes cryoplanation
Reger and Péwé (Reference Reger and Péwé1976) argued strongly that cryoplanation requires permafrost, and it seems to be accepted that the most favourable conditions occur where permafrost is present under relatively continental climates (Crudek, Reference Czudek1995; Hall, Reference Hall1998; Nelson and Nyland, Reference Nelson and Nyland2017). Our research at Svartkampan indicates that permafrost is an important water source for frost weathering and solifluction and that an impermeable permafrost table confines meltwater flow to the active layer, contributes to the focusing of frost weathering towards the cliff base, and provides a “base level” below which frost weathering is ineffective. Apparently active cryoplanation terraces have nevertheless been described from areas with deep seasonal ground freezing, such as low-alpine zones and maritime polar regions (Demek Reference Demek1969b; Schunke and Heckendorff, Reference Schunke and Heckendorff1976; Crudek Reference Czudek1995). In view of slow rates of development, however, it is difficult to establish whether such terraces experienced seasonal freezing throughout their development. Thus, we conclude that although permafrost promotes cryoplanation, it cannot yet be said to be a necessary condition.
Cryoplanation is not the same as nivation
It has been suggested that there are similarities in the morphology and genesis of cryoplanation terraces and nivation benches or hollows (Margold et al., Reference Margold, Treml, Petr and Nyplová2011; Ballantyne, Reference Ballantyne2018) and that cryoplanation and nivation can be conceptualised as representing different parts of a single process spectrum (Hall, Reference Hall1998; Thorn and Hall, Reference Thorn and Hall2002). An important insight following from our research on the Svartkampan terraces, however, is that snow and processes of nivation play only a secondary role in cryoplanation and the formation of cryoplanation terraces. This is in agreement with the proposal of Hall (Reference Hall1998) and Thorn and Hall (Reference Thorn and Hall2002) that cryoplanation is associated with relatively cold climates, permafrost, and snow-free conditions, whereas nivation is characterised by the presence of snow in milder and wetter climates. Thus, we propose that cryoplanation should be regarded as essentially distinct from nivation.
The characteristic process of cryoplanation and our model of cryoplanation terrace development is frost weathering at the cliff base: this leads, over time, to the parallel retreat of the cliff and terrace extension (Fig. 14c). Thermal insulation by snow dampens rather than accentuates the annual freeze–thaw cycle (Draebing et al., Reference Draebing, Haberkorn, Krautblatter, Kenner and Phillips2017) and, most importantly, snow is normally no longer available as a moisture source during freezeback. Water for ice growth at this time comes from groundwater—supra-permafrost meltwater flow and infiltration water from autumn rainfall—rather than snow beds. Thus, any late snow beds on the terrace treads (e.g., see Fig. 2) are an effect rather than a cause of the cryoplanation terrace and, more likely than not, slow down the rate of cliff recession and terrace extension. Interestingly, the original definition of nivation (Matthes, Reference Matthes1900) did not include frost weathering of bedrock.
Processes of nivation (snow-generated processes capable of enhancing geomorphic work) (cf. Thorn, Reference Thorn1976, Reference Thorn and Clark1988; Thorn and Hall, Reference Thorn and Hall1980, Reference Thorn and Hall2002; Nyberg, Reference Nyberg1991; Christiansen, Reference Christiansen1998a, Reference Christiansen1998b) do contribute to the transport of material across the terrace tread. During spring and summer thaw, solifluction occurs beneath and in front of snow beds on the tread, and snow meltwater transports fine sediments away from the cliff, while rockfall material from the cliff may undergo supranival transport (Fig. 14a). However, the dates obtained on both organic sediments and surface boulders in this study demonstrate extremely slow Holocene transport rates with relatively small quantities of material being transported for a short distance across the inner terrace tread, which leaves the outer tread in an essentially relict state.
SUMMARY AND CONCLUSIONS
We have dated cryoplanation terraces for the first time using two different dating techniques and present a process-based conceptual model of cryoplanation terrace development. SHD was applied to surface boulders on terrace treads and bedrock cliffs and 14C dating was applied to organic-rich sediment within the regolith on the tread. This chronological information, combined with observational evidence, has enabled several controversial aspects of cryoplanation to be addressed.
The statistically significant decrease in SHD mean age (±95% confidence interval) of the cliffs along the length of the main terrace, from 8890 ± 1185 yr at site 1 to 0 ± 825 yr at site 8, demonstrates significant spatial variation in exposure age and activity. This strong west–east age gradient seems to reflect subtle topographic variations with consequent effects on groundwater hydrology and frost weathering. With the exception of site 1, the inner treads on the main terrace yielded consistently older SHD ages than the cliffs, and the SHD ages of outer treads tend to be older than the inner tread SHD ages. None of the SHD ages are older than the Holocene, but most terraces have active and relict elements. The SHD ages are complemented by three 14C dates of between 3854 and 4821 cal yr BP (2σ range), indicating a maximum rate of cliff recession of the order of 0.1 mm/yr. Extrapolation of this rate suggests that the terraces began to form before the last glacial maximum, survived glaciation beneath cold-based ice, and resumed active development in the Holocene.
Excavation has demonstrated that the terraces cut across bedrock structures, yet most of the regolith on the terrace treads is interpreted as diamicton derived from till deposited during deglaciation and subsequently reworked by solifluction and cryoturbation. Boulder pavement caps much of the regolith on the inner treads, and the pavement tends to be formed of angular boulders derived from the cliffs; whereas on the outer treads, edge-rounded clasts are characteristic. The age, angularity, and size of clasts on the inner treads supports frost weathering as the primary process leading to cliff recession and terrace extension. During autumn freezeback, snow beds have melted, yet seepage water is still available at the cliff base, where effective frost wedging and/or the growth of segregation ice in joints and cracks is inferred to occur during prolonged winter frost penetration. Thus, the availability of groundwater during freezeback is considered to be critical for cryoplanation, which proceeds slowly by parallel retreat of a cliff undercut by frost weathering.
Permafrost seems to promote the formation of well-developed cryoplanation terraces by providing an impermeable frost table beneath the active layer, focusing groundwater flow towards the cliff base and supplying water during spring and summer thaw. Together with snowmelt, supra-permafrost meltwater promotes the transport of regolith across the terrace surface, especially by solifluction following thaw consolidation. However, such transport processes are very slow under the relatively continental climatic conditions of northeastern Jotunheimen. It is argued that seasonal frost is less likely to promote cryoplanation and terrace development.
Contrary to the view expressed in several recent publications, our results suggest that cryoplanation should be seen as different from nivation. Snow appears to play, at most, only a secondary role in cryoplanation. And enhanced frost weathering linked to groundwater hydrology during freezeback, which is so important for cryoplanation, does not constitute a nivational process.
ACKNOWLEDGMENTS
Fieldwork was carried out on the Swansea University Jotunheimen Research Expeditions, 2017 and 2018. We thank Anika Donner for assistance in the field, Charles Harris for discussions on the possible effects of permafrost, named (Martin Margold and Atle Nesje) and unnamed reviewers for comments leading to improvement of the paper, Ole Jakob and Tove Grindvold for logistical support, and Anna Ratcliffe for drawing up the figures for publication. This paper constitutes Jotunheimen Research Expeditions Contribution No. 207 (see: http://jotunheimenresearch.wixsite.com/home)