Introduction
Compared with diversity elsewhere, that of Antarctic terrestrial ecosystems is low, largely because of the continent’s extended isolation, severe climatic conditions and the relative scarcity of habitat suitable for colonization (Chown & Convey Reference Chown and Convey2007, Reference Chown and Convey2016). This apparently low diversity belies much biogeographical complexity (McGaughran et al. Reference McGaughran, Stevens, Hogg and Carapelli2011, Terauds et al. Reference Terauds, Chown, Morgan, Peat, Watts, Keys, Convey and Bergstrom2012, Chown et al. Reference Chown, Clarke, Fraser, Cary, Moon and McGeoch2015) and, as a result, the biogeography and evolutionary origins of the Antarctic biota have remained a topic of lively debate. Mostly through the application of innovative molecular approaches, a renewed focus has developed on understanding the glacial history of the region and how this has shaped the diversity and distribution of its biota (Convey et al. Reference Convey, Chown, Clarke, Barnes, Bokhorst, Cummings, Ducklow, Frati, Green, Gordon, Griffiths, Howard-Williams, Huiskes, Laybourn-Parry, Lyons, McMinn, Morley, Peck, Quesada, Robinson, Schiaparelli and Wall2014 and references therein). Although model reconstructions of past ice sheet extent suggest that most of the presently ice-free areas would have been completely covered during previous glacial maxima, molecular studies of freshwater and terrestrial communities indicate that multiple species must have survived in isolated refugia for millions to tens of millions of years (Convey et al. Reference Convey, Gibson, Hillenbrand, Hodgson, Pugh, Smellie and Stevens2008, Fraser et al. Reference Fraser, Terauds, Smellie, Convey and Chown2014, Reference Fraser, Connell, Lee and Cary2017).
Populations that become restricted to refugia for sufficiently prolonged periods become genetically differentiated, leading to the formation of unique genetic lineages, perhaps ultimately resulting in speciation. In some Antarctic regions, such as Victoria Land, evidence of genetic differentiation between populations over both small (<1 km) and intermediate (tens to hundreds of kilometres) spatial scales exists for several terrestrial invertebrates (Fanciulli et al. Reference Fanciulli, Summa, Dallai and Frati2001, Frati et al. Reference Frati, Spinsanti and Dallai2001, Stevens & Hogg Reference Stevens and Hogg2003, Nolan et al. Reference Nolan, Hogg, Stevens and Haase2006, Bennett et al. Reference Bennett, Hogg, Adams and Hebert2016). Whilst isolation in refugia has undoubtedly had a profound effect on shaping ancient lineages, recent examination of the population genetic structure of the springtail Cryptopygus terranovus (Wise) in Terra Nova Bay indicates that post-Holocene dispersal events have been relatively frequent and are already beginning to mask the phylogenetic signal from earlier, Pliocene, divergence events (Hawes et al. Reference Hawes, Torricelli and Stevens2010, Carapelli et al. Reference Carapelli, Leo and Frati2017). However, elsewhere in Antarctica information is limited about how either ancient or contemporary dispersal events have affected the genetic structure of individual populations or biogeographical complexity for a species as a whole (although see McGaughran et al. Reference McGaughran, Stevens, Hogg and Carapelli2011).
Understanding the spatial distribution of genetic variation of the Antarctic biota is not only important for elucidating its biogeography and notably the influence of glacial history and long-term glacial habitat fragmentation, but is also of considerable conservation significance (see Chown et al. Reference Chown, Brooks, Terauds, Le Bohec, van Klaveren-Impagliazzo, Whittington, Butchart, Coetzee, Collen, Convey, Gaston, Gilbert, Gill, Hoft, Johnston, Kennicutt, Kriesell, Le Maho, Lynch, Palomares, Puig-Marco, Stoett and McGeoch2017). Indeed, much concern now exists about the potential risks associated with the anthropogenic movement of distinct lineages or species among climatically similar, yet biogeographically distinct, areas of Antarctica (Hughes & Convey Reference Hughes and Convey2010, Lee & Chown Reference Lee and Chown2011, McGeoch et al. Reference McGeoch, Shaw, Terauds, Lee and Chown2015). Such intra-regional propagule movements pose a significant potential conservation problem. Biota which have already successfully established in, or are indigenous to, one region of the Antarctic clearly possess the physiological adaptations and life-cycles that are necessary to survive there and are therefore likely to be able to survive in another region with similar abiotic characteristics. As Morgan et al. (Reference Morgan, Barker, Briggs, Price and Keys2007) have shown with their Antarctic environmental domains analysis, such environmental similarity across the continent is not uncommon. Moreover, in the last decade, numbers of visitors to the Antarctic have increased rapidly, and these visitors are engaging in an increasingly diverse range of activities (Tin et al. Reference Tin, Fleming, Hughes, Ainley, Convey, Moreno, Pfeiffer, Scott and Snape2009). Each of these visitors has the potential both to introduce exogenous propagules into the region (Whinam et al. Reference Whinam, Chilcott and Bergstrom2005, Chown et al. Reference Chown, Huskies, Gremmen, Lee, Terauds, Crosbie, Frenot, Hughes, Imura, Kiefer, Lebouvier, Raymond, Tsujimoto, Ware, van de Vijver and Bergstrom2012) and to move locally indigenous species between isolated localities (Hughes & Convey Reference Hughes and Convey2010, Lee & Chown Reference Lee and Chown2011) and the Antarctic’s Conservation Biogeographic Regions, many of which share similar abiotic conditions but differ in their biotic composition (Terauds et al. Reference Terauds, Chown, Morgan, Peat, Watts, Keys, Convey and Bergstrom2012).
The Scotia Arc and Antarctic Peninsula are of particular concern in this respect. They have a complex geology and recent phylogeographical work on springtails and traditional investigations of other taxa have suggested that distinct bioregions are present (Maslen & Convey Reference Maslen and Convey2006, Chown & Convey Reference Chown and Convey2007, McGaughran et al. Reference McGaughran, Torricelli, Carapelli, Frati, Stevens, Convey and Hogg2010, Terauds et al. Reference Terauds, Chown, Morgan, Peat, Watts, Keys, Convey and Bergstrom2012). Moreover, this area is showing the fastest warming (Trusel et al. Reference Trusel, Frey, Das, Karnauskas, Munneke, van Meijgaard and van den Broeke2015, Spence et al. Reference Spence, Holmes, Hogg, Griffies, Stewart and England2017) and the sharpest rise in numbers of tourists and other visitors (Student et al. Reference Student, Amelung and Lamers2016). Consequently, understanding the extent to which the biogeographical regions identified in the Scotia Arc and Antarctic Peninsula are consistent among taxa, notably in terms of spatial genetic structure across taxa (see McGaughran et al. Reference McGaughran, Torricelli, Carapelli, Frati, Stevens, Convey and Hogg2010, Reference McGaughran, Stevens, Hogg and Carapelli2011) and how these may change given the opening of new ice-free areas (Lee et al. Reference Lee, Raymond, Bracegirdle, Chadès, Fuller, Shaw and Terauds2017), will inform how enhanced biosecurity protocols should be implemented for movement between areas to conserve this structure.
In our study the spatial genetic structures of the ameronothroid mites Alaskozetes antarcticus (Michael) and Halozetes belgicae (Michael) were examined across several major localities on the Antarctic Peninsula and Scotia Arc. These species are important components of the terrestrial system (Block Reference Block1984), but have not been investigated from this perspective in contrast with other important groups in the area, such as midges and springtails (McGaughran et al. Reference McGaughran, Torricelli, Carapelli, Frati, Stevens, Convey and Hogg2010, Allegrucci et al. Reference Allegrucci, Carchini, Convey and Sbordoni2012). Specifically, three key questions are addressed: i) Do populations of mites across the Antarctic Peninsula and Scotia Arc constitute distinct genetic lineages? ii) What implications does phylogeographical structure in these species have for current understanding of the region’s glacial history? iii) What are the conservation implications of these findings?
Materials and methods
DNA extraction and sequencing
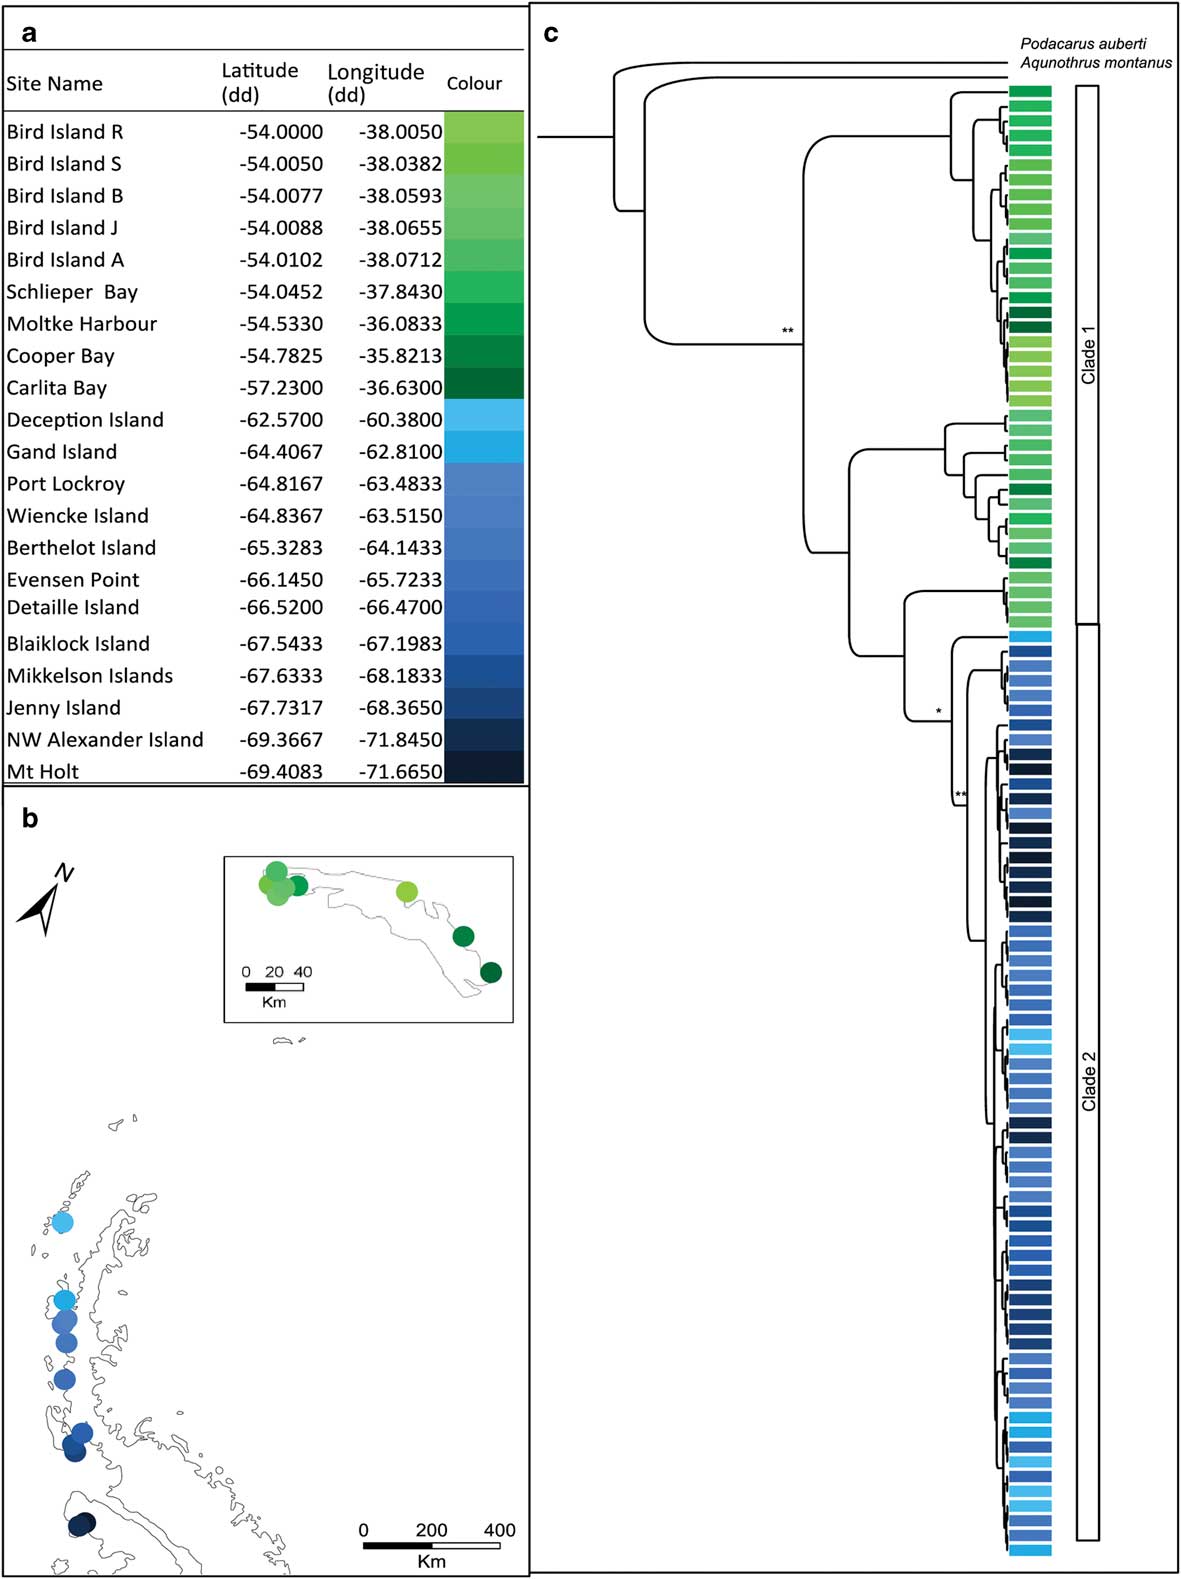
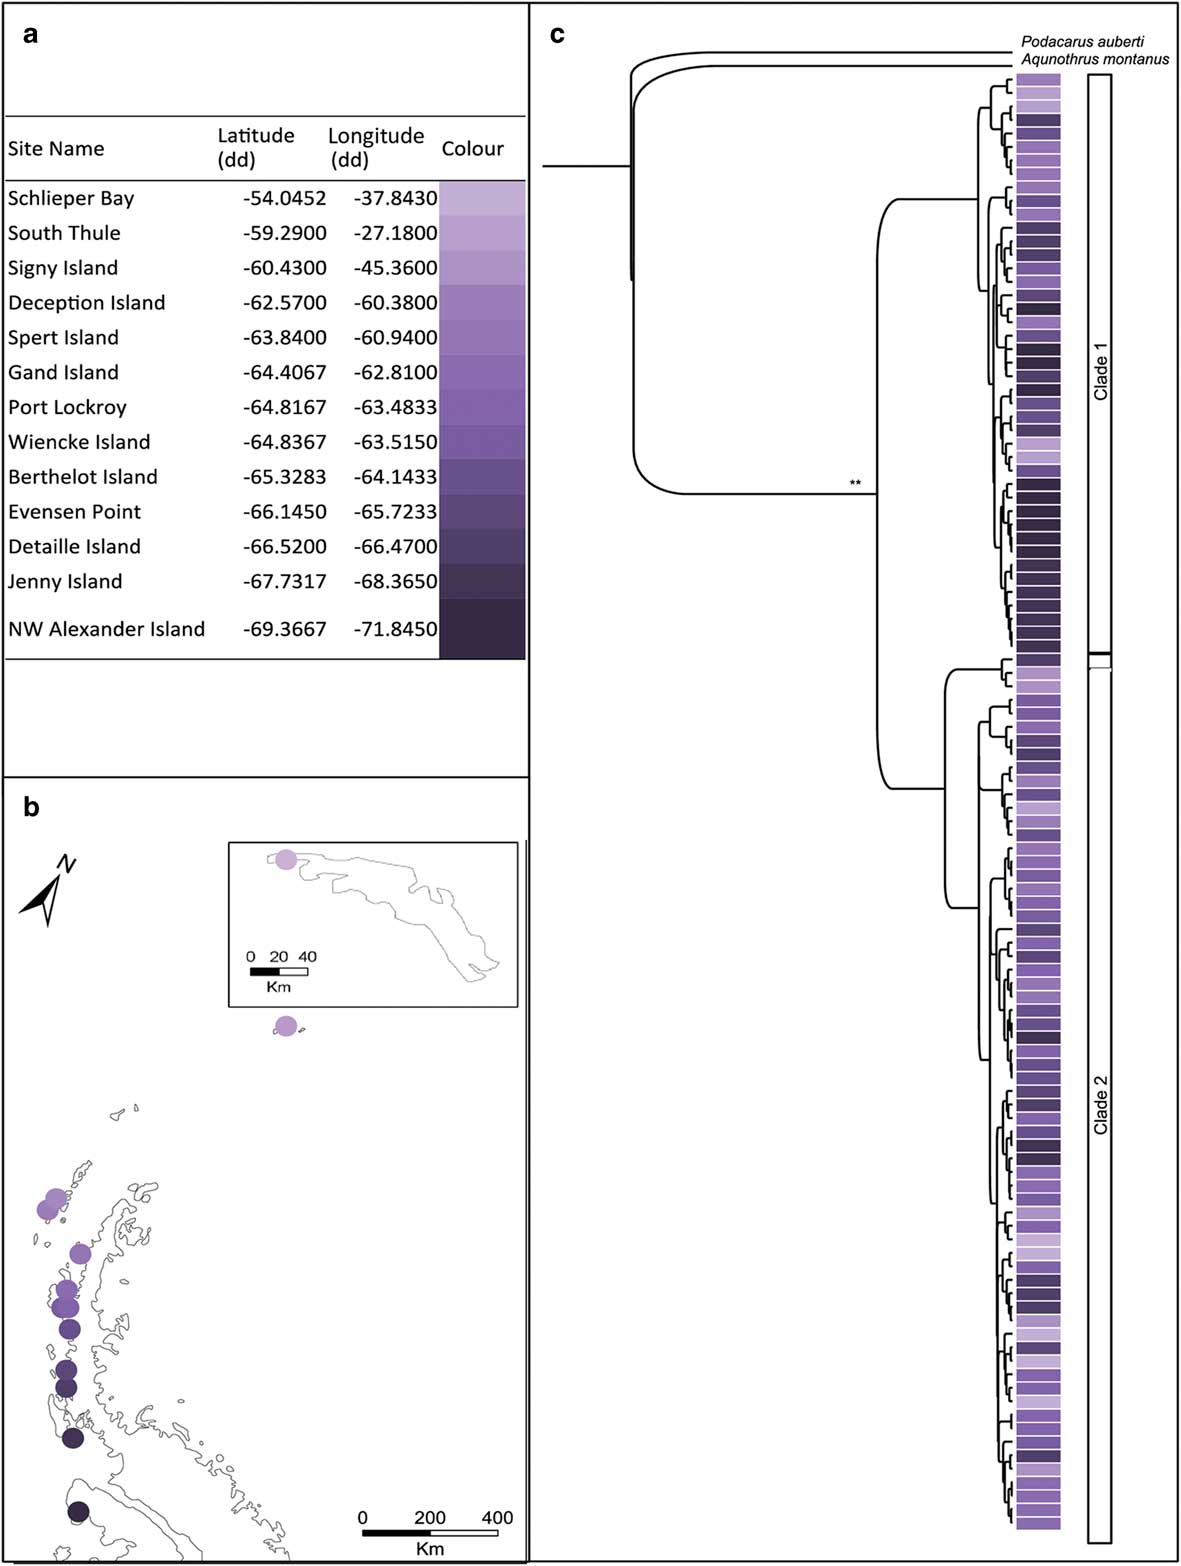
Halozetes belgicae and A. antarcticus individuals representing sites from the sub-Antarctic South Georgia to the southern Antarctic Peninsula were obtained from ethanol-preserved arthropod collections held by the British Antarctic Survey (Cambridge, UK; see Tables I & II for details). Samples were obtained from 21 sites for H. belgicae (Fig. 1) and from 13 sites for A. antarcticus (Fig. 2). The ameronothroids Aquanothrus montanus Engelbrecht and Podacarus auberti Grandjean were used as outgroups (see Mortimer et al. Reference Mortimer, van Vuuren, Lee, Marshall, Convey and Chown2011 for rationale).

Fig. 1a Table showing the sampling locations of Halozetes belgicae with corresponding colours for the map locations. b. Map showing the sampling locations of H. belgicae on the Antarctic Peninsula and South Georgia (inset). c. Bayesian topology inferred from the combined cytochrome c oxidase subunit I (COI) and elongation factor 1-alpha (EFa1) gene fragments for H. belgicae. *posterior probability >0.7 and **posterior probability >0.9, at each node. Colours indicate sampling locality.

Fig. 2a Table showing the sampling locations of Alaskozetes antarcticus with corresponding colours for the map locations. b. Map showing the sampling locations of A. antarcticus on the Antarctic Peninsula and South Georgia (inset). c. Bayesian topology inferred from the combined cytochrome c oxidase subunit I (COI) and elongation factor 1-alpha (EFa1) gene fragments for A. antarcticus. *posterior probability >0.7 and **posterior probability >0.9, at each node. Colours indicate sampling locality.
Table I Population statistics and genetic characteristics for Halozetes belgicae, where n is number of individuals/sequences, x is number of haplotypes, h is haplotype diversity and π is nucleotide diversity.
Values for nuclear EF1a are derived from alleles.
There are no COI data for Detaille Island and no EF1a data for Carlita Bay, Deception Island or Mikkelson Islands.
COI=cytochrome c oxidase subunit I, EF1a=elongation factor 1-alpha.
Table II Population statistics and genetic characteristics for Alaskozetes antarcticus, where n is number of individuals/sequences, x is number of haplotypes, h is haplotype diversity and π is nucleotide diversity.

Values for nuclear EF1a are derived from alleles.
There are no COI data for South Thule and no EF1a data for Deception Island or North-west Alexander Island.
COI=cytochrome c oxidase subunit I, EF1a=elongation factor 1-alpha.
From each individual, total genomic DNA was isolated using a DNeasy Blood & Tissue Kit (QIAGEN, Hilden, Germany) following the manufacturer’s recommendations. To elucidate both recent and more distant systematic relationships, a rapidly evolving mitochondrial marker and a more slowly evolving nuclear marker were used. The widely used mitochondrial cytochrome c oxidase subunit I gene (COI) was amplified using primers LCO1490 and HCO2198 (Folmer et al. Reference Folmer, Black, Hoeh, Lutz and Vrijenhoek1994). The nuclear elongation factor 1-alpha (EF1a) was amplified using primers EF1-For3 and Cho10 (Danforth & Ji Reference Danforth and Ji1998) as this has been shown to be a powerful marker for resolving molecular phylogenetic relationships in oribatid mites (Laumann et al. Reference Laumann, Norton, Weigmann, Scheu, Maraun and Heethoff2007). Exoskeletons were retained and preserved as reference specimens and are housed at the British Antarctic Survey. Mitochondrial and nuclear PCR procedures were performed in a final volume of 30 µl and included 2 µl of unquantified genomic DNA, 1×reaction buffer, 1.5 mM MgCl2, 200 µM dNTP solution, 2 µM of each primer and 1 U of Taq polymerase (Super-Therm; JMR Holdings, London, UK). All PCR procedures were conducted with similar cycling parameters, which included an initial denaturation step at 94°C for 1 minute followed by 35 cycles of 94°C for 30 seconds, 42°C (COI) or 55°C (EF1a) for 30 seconds and 72°C for 45 seconds. A final extension step at 72°C for 5 minutes completed the reactions. Nucleotide sequencing was carried out using BigDye Terminator 3.1 mix (Applied Biosystems, Warrington, UK). Sequencing cocktails were cleaned using Wizard spin-columns (Promega, Madison, WI, USA) and the products were analysed on an ABI3170 automated sequencer (Applied Biosystems). Electropherograms of the raw data were manually checked and edited with Geneious v7.1.7 (Biomatters, Auckland, New Zealand). It was not always possible to unequivocally score all base pairs in some reads because of high background noise. Instances where there were more than 5% missing data or ambiguous sites sequences were deleted from analyses. Heterozygous sites for the nuclear data were scored using standard IUPAC notations and the most likely alleles determined using Phase (as implemented in DnaSP 5.10.1; Librado & Rozas Reference Librado and Rozas2009).
Sequences were aligned using MUSCLE (Edgar Reference Edgar2004; implemented in Geneious v7.1.9; Biomatters) and alignments verified by eye. All sequences generated in the present study were submitted to the European Molecular Biology Laboratory (EMBL) under accession numbers MG712642–MG712686. In the nuclear EF1a gene, the flanking exons were conserved across all taxa. However, portions of the intron could not be unambiguously aligned so this section was removed from further analysis.
Spatial genetic variation analysis
Bayesian phylogenetic analysis was performed using BEAST v1.6.1 (Drummond & Rambaut Reference Drummond and Rambaut2007). The optimal models that best explained data evolution were determined in jModeltest (Posada Reference Posada2009) (these were HKYI+G for the mitochondrial marker and TrNI for the nuclear marker). The analysis on the combined data was run for 10 000 000 generations and sampled every 1000 generations. Plots and diagnostics (standard deviation of split frequencies, effective sample size) from Tracer v1.4 (Rambaut & Drummond Reference Rambaut and Drummond2007) were visually inspected to ensure that stationarity had been reached. The first 10 000 trees were excluded as burn-in and consensus trees were calculated in TreeAnnotator v1.6.1 (Drummond & Rambaut Reference Drummond and Rambaut2007). Analyses were repeated three times to check for consistency in topologies. To further test for consistency, phylogenetic trees were also constructed using RAxML v7.2.8 (Stamatakis Reference Stamatakis2014).
Arlequin v3.5 (Excoffier & Lischer Reference Excoffier and Lischer2010) was used to investigate the genetic characteristics of populations and to test for the presence of population structure. For each fragment and at each site, haplotype (h) and nucleotide (π) diversity indices were calculated. Pairwise FST values between populations were calculated and significance tested based on 1000 permutations. Analysis of molecular variance (AMOVA, as implemented in Arlequin) was then used to measure the extent to which genetic variance was assigned to the hierarchical structure of population organization. The H. belgicae topologies divided South Georgia from Scotia Arc and Antarctic Peninsula, and this separation was verified by AMOVA. Low sample sizes from South Georgia for A. antarcticus precluded meaningful analysis of variation between South Georgia and the Scotia Arc/Antarctic Peninsula. The statistical significance of variance components was tested with 10 000 permutations. To test for a pattern of isolation-by-distance, correlations were calculated between genetic distances (FST) and the geographical distances separating localities (Mantel Reference Mantel1967).
Molecular divergence times
Because of the poor fossilization potential of arthropods, calibration of molecular clocks based on fossil records is problematic for this group. Molecular divergence times for COI in the Arthropoda have been postulated to range from 1.5–2.3% per million years (Salomone et al. Reference Salomone, Emerson, Hewitt and Bernini2002). Given these limitations lineage-specific mutation rates to date divergence times of well-supported nodes were used (following Cicconardi et al. Reference Cicconardi, Nardi, Emerson, Frati and Fanciulli2010). Here a mutation rate of 1.9% per million years was used, calculated by Mortimer et al. (Reference Mortimer, van Vuuren, Lee, Marshall, Convey and Chown2011) based on branch specific rates for Halozetes and Alaskozetes from the sub-Antarctic and Antarctic region nested within a panarthropod dataset. Given that mutation rates may vary slightly across the sampling region and within clades of different ages, divergence times should be seen as indications of the time lineages separated rather than as robust values. A fixed rate Bayesian clock implemented in BEAST v1.6.1 (Drummond & Rambaut Reference Drummond and Rambaut2007) was employed and the Yule speciation prior specified. Markov Chain Monte-Carlo runs were conducted of 10 000 000 generations (sampled every 1000 generations) each with the first 10% discarded as burn-in. Run convergences were verified using Tracer v1.4 (Rambaut & Drummond Reference Rambaut and Drummond2007) and consensus trees were calculated in TreeAnnotator v1.6.1 (Drummond & Rambaut Reference Drummond and Rambaut2007).
Results
Halozetes belgicae
The COI dataset comprised 479 aligned positions for 76 individuals and the EF1a dataset comprised 308 aligned positions for 86 individuals. The Bayesian topology for the combined dataset is shown in Fig. 1c. Trees were largely congruent irrespective of method of analyses (Bayesian analysis or maximum likelihood). Both of the gene fragments support the presence of two distinct groups within H. belgicae: one for South Georgia (hereafter, clade 1) and one for the Antarctic Peninsula and remaining islands to the north (hereafter, clade 2). Multiple divergent lineages are present on South Georgia (see Fig. 1).
For H. belgicae, the COI data group into 35 haplotypes (h=0.99). Haplotype diversity values for sampling localities range between 0 (where all individuals comprise a single haplotype) to 1 (where all individuals are unique) (see Table I). For EF1a, 30 alleles were retrieved (h=0.82). As was the case with the mitochondrial data, haplotype diversity varied between 0 and 1 for the sampling sites (Table I).
An AMOVA indicated significant structure within H. belgicae across the study area (COI: ФST=0.81, P<0.001; EF1a: FST=0.93, P<0.001). The variation was significantly structured between South Georgia and the Antarctic Peninsula across both mitochondrial and nuclear fragments (COI: ФCT=0.78, P<0.001; EF1a: FCT=0.42, P<0.001). No mitochondrial haplotypes or nuclear alleles are shared between these regions. When considering South Georgia and the Antarctic Peninsula separately, AMOVA (using the COI data) indicated further significant structure within each of these main clades (South Georgia: ФST=0.88, P<0.001; Antarctic Peninsula: ФST=0.95, P<0.001). Mantel tests indicated a correlation between geographical and genetic distance when all samples were considered together (r=0.37, P≤0.001) but no significant correlation when individuals from the Antarctic Peninsula (r=0.34, P=0.46) and South Georgia (r=0.09, P=0.63) were considered separately.
BEAST analysis using lineage-specific mutation rates and based on the mitochondrial dataset placed the split between individuals from South Georgia and from the Antarctic Peninsula clade at 5.35 (± 1.85) m.y. bp.
Alaskozetes antarcticus
The COI dataset comprised 647 aligned sites for 85 individuals and the EF1a dataset comprised 338 aligned sites for 88 individuals; these individuals were collected mainly from the Antarctic Peninsula with South Georgia represented by a single locality. The Bayesian topology for the combined dataset is shown in Fig. 2c. Trees were largely congruent irrespective method of analyses (Bayesian analysis or maximum likelihood). Both gene fragments (COI and EF1a) indicate that within A. antarcticus there are two distinct genetic lineages. These lineages were geographically overlapping with individuals from both clades present in seven out of 13 locations. The single site on South Georgia was represented by two haplotypes both of which clustered within clade 2.
For A. antarcticus, the COI data grouped into 45 haplotypes (h=0.96). Within the different sampling localities, h ranged from 0.71 to 1.0 (see Table II). When considering the EF1a data, the specimens comprised ten unique sequences (h=0.79). These unique sequences originate from four heterozygous sites.
When considering all sampling localities together, AMOVA indicated significant genetic structure across the region for both the mitochondrial and nuclear data (COI: ФST=0.42, P<0.001; EF1a: FST=0.21, P<0.001). Mantel tests indicated that this structure was not as a result of isolation-by-distance as there was no significant correlation between geographical and genetic distance when all samples were considered together (r=0.13, P=0.77) or when clade 1 (r=0.57, P=0.96) and clade 2 (r=0.14, P=0.75) were considered separately. Lineage-specific mutation rates placed the split between these two clades at 3.27 (± 1.2) m.y. bp.
Discussion
Our data suggest that both H. belgicae and A. antarcticus comprise multiple and divergent lineages across the Antarctic Peninsula and Scotia Arc, in keeping with a previous conclusion based on a smaller number of specimens but a wider range of Antarctic ameronothroid taxa (Mortimer et al. Reference Mortimer, van Vuuren, Lee, Marshall, Convey and Chown2011). Some of these lineages are as genetically distinct as some other mite species (Salomone et al. Reference Salomone, Emerson, Hewitt and Bernini2002). As is the case with many cryptic species, there are no obvious morphological differences between individuals from different clades. Further detailed studies are required to determine if any subtle morphological differences can be identified.
Although an ice sheet has covered parts of the Antarctic Peninsula for up to 30 m.y., there have been numerous cycles of ice sheet collapse and subsequent regrowth (Bertler & Barrett Reference Bertler and Barrett2010). These complex glacial cycles will have resulted in fluctuations in the extent of ice-free ground and the degree to which it was interconnected (Convey et al. Reference Convey, Gibson, Hillenbrand, Hodgson, Pugh, Smellie and Stevens2008). Dispersal barriers and corridors that formed during periods of ice advance and retreat, but which are not necessarily still evident today, are likely to have played an important role in shaping patterns of genetic diversity of terrestrial biota. For example, our data suggest that during the Pliocene, when the extent of the Antarctic Peninsula ice sheet was reduced (Smellie et al. Reference Smellie, Haywood, Hillenbrand, Lunt and Valdes2009), differentiation took place in both H. belgicae and A. antarcticus, suggesting opportunistic dispersal and subsequent restrictions to gene flow during later periods of glacial advance. In Continental Antarctica similar Pliocene divergences have been inferred for other arthropods, such as the springtail Gressittacantha terranova Wise (Hawes et al. Reference Hawes, Torricelli and Stevens2010, McGaughran et al. Reference McGaughran, Stevens, Hogg and Carapelli2011). In the mites examined here, the effects of more recent glacial history are reflected in the genetic structure within clades. Multiple divergence events appear to have occurred during the Pleistocene and Holocene periods, during which time ice sheet extent fluctuated considerably (Bertler & Barret Reference Bertler and Barrett2010).
Genetic variation within H. belgicae clades and A. antarcticus is spatially structured. This structure is derived from distinct genetic differentiation between some localities rather than an overall pattern of isolation-by-distance. Although this may reflect population-specific evolutionary characters (e.g. selection and mutation), it may also indicate that gene flow between specific sites was limited and somewhat stochastic overall. Within H. belgicae, no haplotypes or alleles are shared between South Georgia and the Antarctic Peninsula.
The ancient origins of both H. belgicae and A. antarcticus and their persistence through the Last Glacial Maximum add to the substantial differences between ice sheet reconstructions, which suggest that the region was heavily glaciated c. 20–25 ka, and molecular data, which indicate that not all organisms were removed from the Peninsula during this period (Convey et al. Reference Convey, Gibson, Hillenbrand, Hodgson, Pugh, Smellie and Stevens2008). Identifying probable locations of these ice-free refugia may be useful when constraining ice sheet models for the Last Glacial Maxima. Typically, although populations that became confined to refugia would have undergone a size reduction (or genetic bottleneck), refugia would be expected to contain higher haplotype diversity compared with recently colonized localities (Stevens & Hogg Reference Stevens and Hogg2003, Rogers Reference Rogers2007). However, the sites that harbour high haplotype diversity in A. antarcticus and H. belgicae are not consistent between species or clades within species suggesting that different taxa probably survived in different refugia; a finding that is perhaps not unexpected given that these two taxa occupy different habitats (Marshall & Convey Reference Marshall and Convey2004). Sites in the southern Peninsula, including northern Alexander Island, contain high levels of haplotype and nucleotide diversity in multiple clades for both A. antarcticus and H. belgicae, suggesting that low lying coastal areas at these two localities have remained ice-free as refugia for a considerable period. The suggestion that this area may have been a glacial refuge for multiple taxa is further supported by distributional data on nematodes (Maslen & Convey Reference Maslen and Convey2006). Therefore, Alexander Island ought to be a priority for further investigations to determine if it served as a refugium for other taxa (e.g. tardigrades and rotifers).
Conclusions
Our data on H. belgicae and A. antarcticus suggest that sub-Antarctic South Georgia should be considered biogeographically distinct from the remainder of the Scotia Arc and Antarctic Peninsula, and that several distinct regions can be identified along the Antarctic Peninsula itself. Biogeographical analyses based both on species distributional information and on molecular data support these overall distinctions between areas, although the specifics vary from group to group. Further analyses will be required to determine whether any consistent signal among groups exists for the smaller areas in the region. Nonetheless, the available information suggests that biosecurity protocols should be rigorously implemented for visits between sites in the region to prevent transfer of individuals between populations, which would compromise signals of evolutionary history and potential future evolutionary trajectories.
Finally, the data presented here add to a growing body of evidence indicating that arthropod diversity in the Antarctic is much greater than previously thought. Indeed, many species previously considered widespread may be species complexes. In the context of understanding the ecology of Antarctic terrestrial systems, the substantially different evolutionary histories of the two iconic mite species examined in this study should be considered when interpreting previously acquired information about their physiologies and life histories. Given that clades within each of the species have been genetically distinct for millennia, if these lineages experienced different environmental or climatic conditions whilst isolated in refugia, there may be corresponding differences in their physiological characteristics. Understanding whether such biological differences exist among the clades might be especially significant for improving current understanding of how these species may respond to the rapidly changing climate of the Scotia Arc.
Acknowledgements
Gayle Pederson is thanked for assistance in the laboratory and Louise Coetzee provided taxonomic assistance. This work was supported by a Scientific Committee on Antarctic Research (SCAR) fellowship to JEL. The work falls under the State of the Antarctic Ecosystem (AntEco) SCAR research programme. SLC was partly supported by National Research Foundation Grant SNA14071475789 and BvV by National Research Foundation Grant SNA14071575859. PC is supported by NERC core funding to the BAS Environmental Change and Evolution Programme. Fieldwork to generate the collections used in this study was supported by the British Antarctic Survey and HMS Endurance. We thank the anonymous reviewers for their input into drafts of our manuscript.
Details of data deposit
All sequences generated in the present study were submitted to EMBL under accession numbers MG712642–MG712686.
Author contributions
SLC and PC conceived the initial idea for the project and this was developed through discussions with all authors. PC was responsible for sample collection. BvV and JL were responsible for laboratory work, scoring data and analyses. All authors contributed to discussions and writing of the manuscript.