


Introduction
Neonatal and infant mortality, together with the presence of chronic non-communicable diseases in adulthood or even childhood, have been associated with three perinatal outcomes as discussed below.Reference Victora, Adair and Fall1,Reference Ngandu, Momberg and Magan2 Those outcomes are: birth weight (BW), birth length (BL), and gestational age at delivery (GAD).
This association has been frequently observed in the case of BW.Reference Victora, Adair and Fall1–Reference Hanson, Bardsley and De-Regil8 Numerous studies indicate that either a reduced or an excessive fetal growth, defined as BW <3000 g or BW ≥4000 g, respectively, is associated with a higher infant mortality and a higher risk of obesity and other chronic diseases later in life.
BL has also been associated with risk factors for chronic disease in adult life, including obesity,Reference Eriksson, Forsen, Toilets, Osmond and Barker9 and with the height of adolescents and adults.Reference Araujo, Hallal, Nader, Menezes and Victora10–Reference Eide, Øyen and Skjœrven12 This aspect is relevant because, regardless of their body mass index, smaller than average adults have a higher risk of obesity, diabetes, and cardiovascular disease.3,Reference Bosy-Westphal, Plachta-Danielzik, Dorhofer and Muller13 Chilean studies in schoolchildren have shown that the BL category <50 cm concentrates a higher prevalence of high blood pressure, obesity, insulin resistance, and poor academic performance.Reference Mardones, Villarroel and Karzulovic14–Reference Mardones, Arnaiz and Pacheco17 Other international studies also show an association between this BL category and mental diseases in adulthood.Reference Mittendorfer-Rutz, Rasmussen and Wasserman18
GAD is the most relevant perinatal outcome, since it precedes BW and BL in the causal chain of events.Reference Eide, Øyen and Skjœrven12,Reference Dalziel, Parag, Rodgers and Harding19 A shorter gestational period implies a reduced time for intrauterine growth and development, and it is associated with higher perinatal morbidity and mortality than reduced BW or BL.20 Also, it has been associated with high blood pressure and insulin resistance in childhood and adulthood.Reference Mardones, Arnaiz and Pacheco17,Reference Dalziel, Parag, Rodgers and Harding19
The World Health Organization (WHO) has defined pre-term as babies born alive before 37 weeks of pregnancy are completed.20 A recent review of the literature has found that the first global estimates of pre-term birth from 92 countries were published in 2010 by Beck et al. Reference Vogel, Chawanpaiboon and Moller21 with a prevalence of 9.6% (95% CI: 9.1–10.1) for the year 2005 and the second global estimates of pre-term birth from 99 countries were published in the year 2012 by Blencowe et al. Reference Vogel, Chawanpaiboon and Moller21 with a prevalence of 11.1% (95% CI: 9.1–13.1) for the year 2010; although their estimation methods differed, the global estimates are similar. This review also pointed out that Blencowe et al. Reference Vogel, Chawanpaiboon and Moller21 also reported estimates of pre-term birth rates at the national level, which ranged from approximately 5% in some European countries to 18% in some African countries. However, is gaining support the idea of including in this risk category all GAD <39 weeks. In these cases, births with GAD of 37–38 weeks are called “early term” and those with GAD 34–36 are called “late pre-term”.Reference Raju, Higgins, Stark and Leveno22,Reference Delnord and Zeitlin23 Neonatal mortality rates and also chronic diseases in adults are significantly higher in both “late pre-term” and “early term” newborns than the 39–41 weeks GAD category, which constitutes the ideal and typical duration of pregnancy.Reference Raju, Higgins, Stark and Leveno22–25
The present study was conducted using data from all cases of live births that took place in Chile during 1996–2017 with the following aims: 1) to analyze the evolution of three perinatal outcomes in the period 1996–2017 and 2) to ascertain the correlation, if any, between those perinatal outcomes and various sociodemographic variables.
Methods
The national live births information recorded by the Chilean Ministry of Health includes the following variables: BW, BL, GAD, maternal age, mother’s years of education, maternal employment, parity (number of children), single/multiple pregnancy, urban/rural residence and sex.26 Complete annual records for these variables are available since 1996 until 2017. Non-registered live births, including home deliveries, are believed to be an exceptional occurrence.Reference Mardones, Marshall and Viviani27 In Chile, all public and private health care centers must issue a delivery certificate which is filed in an office of the Civil Registry Service, generally located within the same facility.
Cases with extreme values were sequentially excluded from the database using the following criteria:
-
1. Intrauterine growth: For the evaluation of the adequacy of BW and BL for GAD, the Chilean Ministry of Health uses a standard for fetal growth between 24 and 42 weeks recommended by Chilean Society of Neonatology.Reference Milad, Novoa, Fabres, Samamé and Aspillaga28
-
2. BL: Observations outside the range of 25–59 cm were excluded. Both values had a frequency of live births equivalent to 0.01% of the sample. The excluded values are estimated to be close to the extreme values, located in the 1st and 100th percentiles of the standard.Reference Milad, Novoa, Fabres, Samamé and Aspillaga28 Information on BL for year 2010 was excluded since there was a significant omission of data.
-
3. BW: Observations outside the 500–5000 g range were excluded. Both values had a frequency of live births equivalent to 0.01% of the sample. The excluded values are estimated to be close to the extreme values, located in the 1st and 100th percentiles of the standard.Reference Milad, Novoa, Fabres, Samamé and Aspillaga28
-
4. Mother’s age: A normal range was established between 12 and 48 years. All those births whose mothers are outside that range were excluded from the sample. Both values had a frequency of live births equivalent to 0.01% of the sample.
-
5. Parity: In this case, all observations of newborns with mothers with more than 12 children were eliminated. This limit was established because parity 12 had a frequency of live births equivalent to 0.01% of the total study population.
The annual evolution 1996–2017 of the three perinatal outcomes was analyzed through their mean values and frequencies of live births in the risk categories of BW and BL. Five categories for GAD were analyzed: <34 weeks, 34–36 weeks, 37–38 weeks, 39–41 weeks and 42 weeks. The last category of GAD in the national live births information is presented as 42 weeks because there are not deliveries with more than 42 weeks in accordance with the Chilean Ministry of Health obstetric guidelines which preclude a longer duration of pregnancy.29 GAD, BW and BL values are determined in Chile using methods described elsewhere.Reference Mardones, Marshall and Viviani27,Reference Mardones, García-Huidobro and Ralph30
The annual evolution of the following sociodemographic variables was also studied: maternal age, mother’s years of education, maternal employment, parity, single/multiple pregnancy, and urban or rural place of residence.
The possible association between perinatal and sociodemographic numerical variables was ascertained with a correlation matrix using the Pearson’s r coefficient. The association between the proportions in the risk categories of the perinatal outcomes was explored using contingency tables.
The possible association of GAD with the other two perinatal outcomes and with the sociodemographic risk factors was also explored using contingency tables. Chi-squared tests for the differences in the proportions were carried out in all cases. Significant p-values were defined as ≤0.01. All analyses were made using Stata 16.0.31
Results
Table 1 presents the summary of exclusion criteria applied to the initial sample of live births 1996–2017. The preliminary database of the study was made up of 6,986,725 live births. The final sample size was 5,336,148 live births.
Table 1. Excluded live births according to five criteria. Live births from Chile, 1996–2017

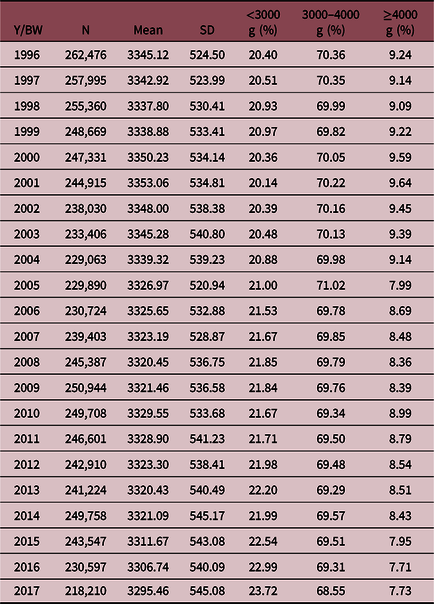
Between 1996 and 2017, mean BW decreased 49.66 g in the whole period. BW <3000 g increased 3.3% and BW ≥4000 g decreased 1.5% (Table 2).
Table 2. Birth weight (BW): mean, standard deviation and three categories for each year (Y). Live births from Chile, 1996–2017
Mean BL decreased 0.46 cm and its risk category, BL <50 cm, increased 8.58% (Table 3).
Table 3. Birth length (BL): mean, standard deviation and two categories for each year (Y). Live births from Chile, 1996–2017

*Year 2010 was excluded (see Methods).
The evolution of GAD is presented in Table 4. Mean GAD values decreased 0.51 week. With regard to risk categories, category <39 weeks increased 15.58% and all other sub-categories under 39 weeks had a tendency to increase.
Table 4. Gestational age at delivery (GAD): mean, standard deviation and five categories for each year. Live births from Chile, 1996–2017

The evolution of the sociodemographic variables is described in Table 5. Maternal age and mother’s years of education increased their mean values between 1996 and 2017, while parity decreased. With regard to the proportion of mothers without education or only basic education, figures declined to a third, while the proportion of mothers with higher education increased three times its initial value; the proportion with secondary education had a slight decrease. Active women working with a current contract more than doubled their proportion in this period 1996–2017. Births in rural areas decreased from 13% to almost half, while female sex remained stable, fluctuating around 49%.
Table 5. Ten sociodemographic variables (S-DV). Live births from Chile, years 1996–2017

Table 6 shows the correlation matrix with the Pearson’s r values. The only relevant associations are those of GAD with BW and BL, except for the multiple pregnancy factor, which is not relevant to its annual incidence fluctuating between 1% and 2% (Table 5).
Table 6. Pearson correlation coefficients in the correlation matrix. Live births from Chile, 1996–2017

Contingency Tables 7–12 show the associations of five categories of GAD, with BW, BL, and sociodemographic variables.
Table 7. Birth weight (BW) by gestational age at delivery (GAD). Live births from Chile, 1996–2017

Table 7 compares live births proportions in three categories of BW according to the GAD categories, revealing that 74% of live births in the category <3000 g were concentrated in the GAD category <39 weeks, especially in the subcategory early term 37–38 weeks with 46.38%. Most of live births with BW 3000–3999 g and ≥4000 g were born in the GAD category 39–41 weeks; however, one-third of those with BW 3000–3999 g was born early term with 37–38 weeks of GAD.
The two categories of BL are compared according to GAD in Table 8 showing that in live births in the BL category <50 cm, almost double the cases (44.69%) were born with 37–38 weeks in comparison with the category ≥50 cm (24.29%).
Table 8. Birth length (BL) by gestational age at delivery (GAD). Live births from Chile, 1996–2017

Table 9 shows the association of 3 years of maternal education categories with the five categories of GAD. At the basic and intermediate levels of education, there were similar frequencies for the five GAD categories, with just over 60% in term deliveries 39–41 weeks and fluctuating around 30% in early term 37–38 weeks deliveries. However, in the higher education category, newborns decreased to 50.76% in term deliveries 39–41 weeks and increased to 41.70% in early term infants 37–38 weeks.
Table 9. Maternal education by gestational age at delivery (GAD). Live births from Chile, 1996–2017

MEC, Mother’s employment condition.
Table 10 presents the live births distribution of two categories of maternal activity among the five categories of GAD. The two types of maternal activity had similar frequencies for deliveries with GAD <37 weeks. However, active mothers have an about 10% higher frequency in early term births 37–38 weeks and about 10% lower in term births 39–41 weeks. Mothers with GAD 42 weeks had a similar frequency according to activity.
Table 10. Mother’s employment condition (MEC) by gestational age at delivery (GAD). Live births from Chile, 1996–2017

With respect to maternal place of residence and GAD categories (Table 11), the two types of maternal residence had similar frequencies for deliveries <37 weeks. However, urban mothers had a frequency about 4% higher than rural mothers in early term births 37–38 weeks and about 5% lower in term births 39–41 weeks. Mothers with EGP 42 weeks had a similar frequency according to residence.
Table 11. Mother’s residence (MR) by gestational age at delivery (GAD). Live births from Chile, 1996–2017

Table 12 describes the frequency of live births classified according to their sex in the five GAD categories. Both sexes show similar frequencies for deliveries in each of the five GAD sub-categories.
Table 12. Sex of the newborn by gestational age at delivery (GAD). Live births from Chile, 1996–2017

p-Values for the differences in the proportions for GAD categories in the respective tables were statistically significant in all cases (p-value < 0.01).
Discussion
Present results indicate a small but significant deterioration in three outcome indicators of fetal growth and perinatal well-being between 1996 and 2017, particularly associated with a higher frequency of premature deliveries. Moreover, the correlation matrix did not show significant associations between sociodemographic variables with BW, BL, and GAD. Thus, GAD was the only factor associated with the observed negative changes in BW and BL. The latter results, in turn, are supported by contingency tables that compare the live births distribution categories of GAD with the corresponding categories of BW and BL (Tables 7 and 8).
Social variables of the present study indicate that early term and late pre-term deliveries happened in a higher proportion in groups of women who are employed, who live in urban areas, and who have a higher educational level in comparison with other categories (Tables 9–11). The higher frequency of GAD <39 weeks mostly reflects an excess of newborns in the early term 37–38 subcategory, a situation previously unreported in the Chilean population.
Two systematic reviews of the literature have found that pre-term incidence, among other perinatal outcomes, is negatively associated with different sociodemographic factors. One of them was done with studies from sub-Saharan Africa countries which showed that lower maternal education, maternal unemployment, and lower household wealth index were the socioeconomic status factors most commonly associated with adverse birth outcomes and infant undernutritionReference Ndirangu, Newell, Bland and Thorne32; however, one of the reported studies in that review showed that pre-term risk was increased with the presence of maternal education, especially at secondary and tertiary levels. The latter finding is similar to results presented here and also pointing to the need of further studies. The other systematic review of relevant articles, which were published worldwide from 1999 to 2007, revealed that socioeconomic disadvantage was also consistently associated with increased risk across socioeconomic measures, birth outcomes, and countries; many studies observed racial/ethnic differences in the effect of socioeconomic measures.Reference Delnord and Zeitlin23,Reference Blumenshine, Egerter and Barclay33
Regarding the first two of the four demographic variables, it was found that maternal age and parity showed variations over time in their mean values. Maternal age increased its value, while parity decreased it. This change is in accordance with previous Chilean reports indicating the presence of delayed child bearing and a clear reduction in the number of childrenReference Mardones34–Reference Fuentes, Sequeira and Tapia37; the international literature has confirmed those observations all around the world.38 Those two factors had the lowest influence on pre-term incidence in comparison with other outcomes in a recent meta-analysis of 14 cohort studies performed in four continents.Reference Kozuki, Lee and Silveira39 Multiple pregnancies increased their frequency over time but being a small minority, no further analysis was performed. The frequency of plural pregnancy, 1.55% in 1996, is slightly higher than the British figure for 1974, but with 2.32% in 2017 is nowadays doubling it.Reference Nylander, Barron and Thomson40 Besides, female sex did not vary over time and a test of the association of the two sexes with GAD showed significant but not relevant differences between them.
Data from the United States, Western Europe, and other high-income countries show that in the year 2010, the proportions of early term 37–38 weeks and late pre-term 34–36 weeks fluctuated between 15%–31% and 3%–6%, respectively.20 The figures for these categories in Chile 2017 were 40.07% and 6.20%, respectively, thus, higher than the rates of developed countries, especially in cases of GAD 37–38 weeks. These differences deserve attention. First, because the proportion of infant deaths in these categories of pre-term in the United States and Europe is 22% and 26%, respectively.20 Therefore, its reduction would help to decrease infant mortality in countries, such as Chile, that have a greater proportion of these births. Second, recent data suggest that infants born both at early term and late pre-term categories have a higher long-term risk of chronic diseases and early mortality (<45 years) than full-term babies.Reference Vogel, Chawanpaiboon and Moller21 Furthermore, those pre-term infants had less education, occupational level, and income than term infants in these studies.
Socioeconomic status is among those most frequently implicated as a contributor to the disparities in health and in the case of the United States could explain about 80% of premature mortality.Reference Shaver’s41,Reference Adler and Newman42 The elimination of health disparities requires an understanding of the specific impact and manner in which various factors influence differences in health among population groups. Two basic approaches to the study of the influence of SES on health are described by Kaplan: the compositional approach and the contextual approach. Compositional measures of socioeconomic status refer to characteristics of the individual, while contextual measures of socioeconomic status refer to characteristics of the individual’s environment.Reference Fraser and Abu-Saad43 In this paper, it was not possible to go beyond attributing well-documented variations in socioeconomic status, as measured by education or occupation to examining more proximal ways in which socioeconomic status influences health status and health outcomes. However, using the information from this study in a rather speculative manner, three ways are proposed below by which socioeconomic status may influence health. Those are maternal obesity, smoking and cesarean sections. After further studies, those suggestions may inform social policy and program design to effectively reduce health disparities.Reference Shaver’s41
BW risk categories showed a low percentage variation: <3000 g increased by 3% and ≥4000 g decreased by almost 2%. As a recent work indicates, this rather small change might be explained by the antagonistic effects on BW of smoking versus pre-conceptional overweight.Reference Chattrapiban, Smit and Wijga44 Thus, BW alone would be an unreliable health indicator when both risk factors are simultaneously present. More than 30% of Chilean women are obese, and 30% reports smoking during pregnancy.45,Reference Mallol, Brandenburg and Madrid46
Regarding obesity, it is well known that a higher than normal index of pre-pregnancy body weight/height increases several folds the risk of pre-term delivery and cesarean section.Reference Abenheim, Kinch and Morin47 Moreover, their babies are more likely to have BW ≥4000 g. Maternal underweight can also be an important factor associated with perinatal outcomes, especially BW <3000 g.Reference Mardones and Rosso48 Maternal nutrition plays a crucial role in influencing fetal growth and birth outcomes, and it is a modifiable risk factor of public health importance in the effort to prevent adverse birth outcomes, particularly among developing/low-income populations.Reference Fraser and Abu-Saad49 Obesity and underweight should be reduced, ideally before pregnancy, to prevent their negative effects. The focus on women’s pre-conception health and nutrition for long-term benefits has been recently stressed in an international initiative.Reference Hanson, Bardsley and De-Regil8 Weight gain should also be guided during pregnancy with a specific curve to improve fetal growth reducing live births with BW <3000 g and live births with BW ≥4000 g.Reference Mardones and Rosso48 Its diagnostic ability has been favorably compared in various studies.Reference Mardones, Rosso and Villarroel50–Reference Mardones, Rosso and Villarroel52 The use of this curve has been recommended for developing countries.Reference Gluckman, Hanson, Seng, Bardsley, Gluckman, Hanson, Seng and Bardsley7,Reference Hanson, Bardsley and De-Regil8
Smoking during pregnancy has been associated with lower GAD and reduced fetal growth, therefore affecting BW and BL.Reference Zhou, Rosenthal and Sherman53 The tobacco epidemic has been addressed with individual and collective strategies, including increasing the prices of tobacco products by way of increased taxation.Reference Bambs, Álcantara, Larraín, Martín and Valenzuela54 In Chile, such a strategy led to a significant – but far from desirable – reduction in cigarette smoking in the female population, from 36.5% to 29.1% in less than a decade.Reference Bachelet and Lanas55 Obviously, complementary initiatives, such as comprehensive smoking cessation programs in primary health care, are needed.Reference Águila and Chamorro56
National information indicates that 76% of deliveries in the private health system are cesarean sections; meanwhile, its rate is 40.5% in the public system.Reference Borrescio-Higa and Valdés57 As previously commented, social variables of the present study indicate that early term and late pre-term deliveries happened more frequently in groups of women who were employed, who lived in urban areas, and who had a higher educational level in comparison with other categories; those women have higher incomes and can afford medical care in private clinics.Reference Murray58
The unnecessary use of labor induction and cesarean sections is a problem with ethical components. A recent study reported that between 2001 and 2014, the percentage of deliveries by cesarean section performed in Chile increased from 26% to 45%, while the average cesarean section rate in the Organization for Economic Cooperation and Development (OECD) countries increased from 20% to 27%.Reference Borrescio-Higa and Valdés57 The authors speculated that financial incentives for health personnel and private hospitals may be playing a role because WHO considers that between 10% and 15% of all deliveries will require a cesarean section.Reference Borrescio-Higa and Valdés57 Furthermore, the International Federation of Gynecologists and Obstetricians has declared its support for a greater role of midwives in normal deliveries, thus limiting medical intervention to complicated and high-risk cases.Reference Visser, Ayres-de-Campos and Shah59 A prestigious medical journal and the WHO have supported these motions.60,61 Chile is in urgent need of educational programs aimed at the general population, health personnel and health administration to improve in this aspect. Midwives should play an important role. Their role in reducing maternal and infant mortality has been recognized.Reference Mardones-Restat and de Azevedo62–Reference Bossert and Leisewitz64 Over the last five decades, the increase in the number of schools of midwifery has made possible to increase the number of professionally assisted deliveries from around 60% in the mid-sixties to the current universal coverage.Reference Hevia63,65 They could be a key factor in reducing cesarean sections in both the public and private sectors.Reference Borrescio-Higa and Valdés57
Acknowledgements
We are grateful for the guidance given by Dr. Danuta Rajs, former Director of the Statistics Department at the Chilean Ministry of Health (2000–2010), in finding complete information of perinatal variables from the national registry of live births.
Financial Support
The two authors were supported by the Pontificia Universidad Católica de Chile. This research received no specific grant from any funding agency, commercial or not-profit sectors.
Conflicts of Interest
None.


