


Introduction
In the USA, a growing number of initiatives encourage redemption of food assistance benefits at direct-to-consumer (DTC) market venues such as farmers’ markets, community supported agriculture (CSA), roadside stands and farm stores as a strategy to increase access to healthy foods for low-income families and sales for farmers participating in DTC market channels (Baronberg et al., Reference Baronberg, Dunn, Nonas, Dannefer and Sacks2013; Lindsay et al., Reference Lindsay, Lambert, Penn, Hedges, Ortwine, Mei, Delaney and Wooten2013; Young et al., Reference Young, Aquilante, Solomon, Colby, Kawinzi, Uy and Mallya2013; United States Department of Agriculture, 2017f). For instance, two US Department of Agriculture (USDA) grant programs, the Farmers’ Market Promotion Program (FMPP) and the Local Food Promotion Programs (LFPP), aim, in part, to remove cost barriers to local food by funding programs that incentivize farmers’ market shopping or subsidize the purchase of CSA subscriptions, which can provide community members with regular access to local produce throughout the growing season. Since its authorization in the 2002 Farm Bill, the FMPP has provided US$58 million to 879 projects that support the development of farmers’ markets, including a subset promoting the use of Supplemental Nutrition Assistance Program (SNAP) benefits to purchase locally-grown fruits and vegetables (United States Department of Agriculture, 2017f). The premise is that by engaging the relatively untapped low-income market segment, DTC venues can increase sales for farmers at a time when such markets are reaching saturation nationwide (Low et al., Reference Low, Adalja, Beaulieu, Key, Martinez, Melton, Perez, Ralston, Stewart, Suttles, Vogel and Jablonski2015).
Local food systems advocates assert that DTC food sales benefit local economies by allowing food spending to re-circulate locally instead of leaving the area (Mccarthy, Reference Mccarthy2001; Myers, Reference Myers2004; Sitaker et al., Reference Sitaker, Kolodinsky, Jilcott Pitts and Seguin2014). Similarly, some food assistance proponents argue that the SNAP program not only helps recipients but also benefits food retailers in the local community. A 2010 study found that for every dollar spent by SNAP recipients at the grocery store, another US$0.79 was added to the local economy (Hanson, Reference Hanson2010). Studies in South Carolina and Michigan have found that redemption of food assistance benefits at farmers’ markets increases sales for farmers selling at DTC market channels (Freedman et al., Reference Freedman, Mattison-Faye, Alia, Guest and Hébert2014; Mann et al., Reference Mann, Miller, Goddeeris, Pirog and Trumbull2018). Thus, public resources spent on SNAP and other programs have the potential to increase low-income consumers’ access to local food and provide synergistic benefits, in the form of new customers for local farmers and increased economic activity for communities.
While interest in using local food as an economic development tool has grown, some researchers have argued that most economic assessments have been speculative and that more empirical evidence is needed (Deller and Stickel Reference Deller and Stickel2015; Thilmany Mcfadden et al., Reference Thilmany Mcfadden, Conner, Deller, Hughes, Meter, Morales, Schmit, Swenson, Bauman, Phillips Goldenberg, Hill, Jablonski and Tropp2016). In particular, despite growth in the redemption of SNAP benefits at DTC market channels, studies have focused mainly on SNAP redemption in food retail stores (Hanson, Reference Hanson2010; Reimer et al., Reference Reimer, Weerasooriya and West2015), which are likely to have different impacts than DTC outlets due to the distinct economic structure of each market channel. Additionally, few studies have evaluated the economic impact of programs and policies that aim to increase low-income customers’ access to DTC channels but the focus has been on the impact on the market channel itself, not on the larger local economy (Freedman et al., Reference Freedman, Mattison-Faye, Alia, Guest and Hébert2014; Mann et al., Reference Mann, Miller, Goddeeris, Pirog and Trumbull2018).
To address these research gaps, we present findings from a research project that uses a customized input-output model (IMPLAN) to explore the potential economic impact of programs and policies that enable SNAP recipients to shift purchases from traditional food retailers to DTC venues under two different scenarios: (1) increased outreach to low-income consumers and (2) financial support for using SNAP benefits at DTC market channels. Effectively, the initial new sales for the local vegetable sector under the two scenarios are the same, but the sources of payment of that initial spending vary. Ultimately, our research is driven by the following question: how can a shift in SNAP recipients’ food purchases impact the local economy?
In the remainder of this paper, we first summarize the literature on food assistance, access to DTC market channels for low-income households (most of the previous literature has focused on farmers’ markets and CSAs) and recent studies on the economic impact of local food initiatives. Next, we describe our study approach before presenting our results. Finally, we discuss the broader implications for researchers, practitioners and policymakers. This paper builds on recent recommendations in economic impact modeling of local food initiatives and, using empirical data, provides evidence for how programmatic and policy changes supporting local food purchases by low-income households can have broader effects on the local economy.
Promotion of healthy dietary behaviors among food assistance participants in the USA
Government food assistance is delivered through three main programs: (1) SNAP, which serves 44.2 million Americans at a cost of US$71 billion annually; (2) the Special Supplemental Nutrition Program for Women, Infants and Children (WIC), which serves 7.7 million Americans at an annual expense of US$5.9 billion; and (3) the National School Lunch Program, which serves 30.4 million students annually at an expense of US$12.2 billion (United States Department of Agriculture, 2017h, 2017k, 2017l). SNAP, the largest of these, appears to decrease the prevalence of food insecurity effectively (Ratcliffe et al., Reference Ratcliffe, Mckernan and Zhang2011), yet the dietary quality scores of SNAP participants lag behind those of their nonparticipant counterparts (Condon et al., Reference Condon, Drilea, Jowers, Lichtenstein, Mabli, Madden and Niland2015). Barriers to healthy eating for SNAP participants include the high cost of healthy foods, insufficient SNAP benefits and limited availability and access to healthful foods in low-resource communities (Leung et al., Reference Leung, Hoffnagle, Lindsay, Lofink, Hoffman, Turrell, Willett and Blumenthal2013; Blumenthal et al., Reference Blumenthal, Hoffnagle, Leung, Lofink, Jensen, Foerster, Cheung, Nestle and Willett2014).
Leung et al. (Reference Leung, Hoffnagle, Lindsay, Lofink, Hoffman, Turrell, Willett and Blumenthal2013) and Blumenthal et al. (Reference Blumenthal, Hoffnagle, Leung, Lofink, Jensen, Foerster, Cheung, Nestle and Willett2014) argue that providing vouchers or monetary incentives to purchase healthful foods may have the greatest potential to overcome these barriers and improve the diets of SNAP participants. SNAP benefits are administered through an electronic system, called Electronic Benefits Transfer (EBT), that gives program beneficiaries access to their benefits via a debit-like card that is reloaded monthly and usable at any retailer with an EBT payment terminal. Thus, programs that facilitate SNAP expenditures at farmers’ markets or other DTC market channels through the installation of EBT terminals can increase the sale of fresh produce to low-income participants (Bertmann et al., Reference Bertmann, Ohri-Vachaspati, Buman and Wharton2012; Buttenheim et al., Reference Buttenheim, Havassy, Fang, Glyn and Karpyn2012). In 2015, USDA reported that SNAP benefits are accepted at 7868 farmers’ markets, 1757 onsite farm stands and 308 CSAs (United States Department of Agriculture, 2017a). Understanding the potential economic impact of incentivizing healthier purchases through produce subsidies at such DTC venues has broad implications for food assistance policy in the USA and other countries with expanding local food networks.
Access to DTC market channels for low-income customers
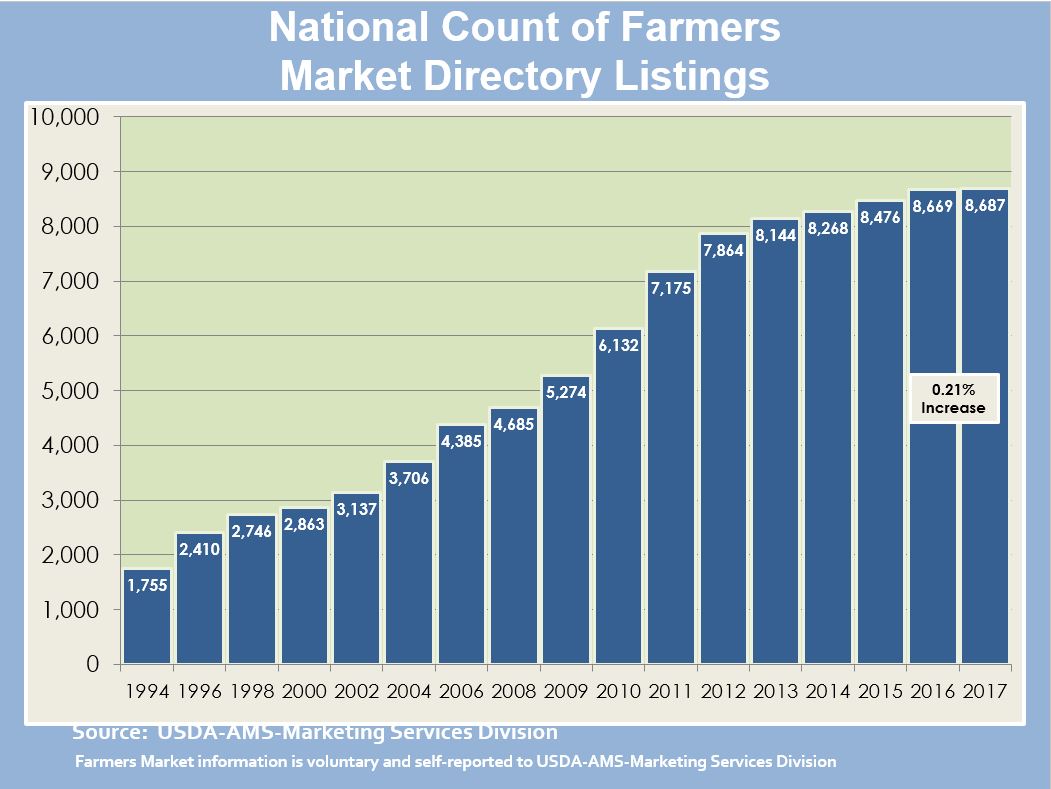
DTC market channels have grown significantly in the last 20 years with the number of farmers’ markets increasing by 393% between 1994 and 2016 and DTC sales doubling between 1992 and 2012 to reach US$1.4 billion (O'hara and Low, Reference O'hara and Low2016; United States Department of Agriculture, 2017g). Historically, DTC consumers have been mostly white, female, middle to upper-middle class and well educated (Vasquez et al., Reference Vasquez, Sherwood, Larson and Story2017) though an estimated 11% to 30% of CSA members are low-income (Hinrichs and Kremer, Reference Hinrichs and Kremer2002; Pole and Gray, Reference Pole and Gray2013; Galt et al., Reference Galt, Bradley, Christensen, Fake, Munden-Dixon, Simpson, Surls and Kim2017). Additionally, females and families in the second lowest annual household income quintile are more likely to shop at farmers’ markets, though no differences in age or education exist between market and non-market shoppers (Zepeda, Reference Zepeda2009). Overall, most CSA members join out of a desire for high-quality, local produce, a concern for the environment and to support local farmers (Cooley and Lass, Reference Cooley and Lass1998; Cone and Myhre, Reference Cone and Myhre2000; Andreatta et al., Reference Andreatta, Rhyne and Dery2008) and they are less concerned with price, convenience, or aesthetics (Kolodinsky and Pelch, Reference Kolodinsky and Pelch1997; Brehm and Eisenhauer, Reference Brehm and Eisenhauer2008; Bond et al., Reference Bond, Thilmany and Bond2009; Freedman et al., Reference Freedman, Vaudrin, Schneider, Trapl, Ohri-Vachaspati, Taggart, Cascio, Walsh and Flocke2016). Similarly, farmers’ market shoppers are more concerned about freshness and nutritional concerns than cost (Zepeda, Reference Zepeda2009).
Shopping at DTC venues has been associated with increased purchases of fresh produce, as well as improved meal planning, cooking and eating behaviors (Ruelas et al., Reference Ruelas, Iverson, Kiekel and Peters2012; Jilcott Pitts et al., Reference Jilcott Pitts, Wu, Mcguirt, Crawford, Keyserling and Ammerman2013; Quandt et al., Reference Quandt, Dupuis, Fish and D'agostino2013; Hanson et al., Reference Hanson, Kolodinsky, Wang, Morgan, Jilcott Pitts, Ammerman, Sitaker and Seguin2017), though few studies have quantified the impact of DTC initiatives on diet quality using rigorous dietary assessment methods (Mccormack et al., Reference Mccormack, Nelson Laska, Larson and Story2010). Additionally, several studies show that consumers who purchase local foods through direct channels may benefit from prices that are on par with, or lower than, prices in conventional retail locations (Cooley and Lass, Reference Cooley and Lass1998; Sabih and Baker, Reference Sabih and Baker2000; Claro, Reference Claro2011; Flaccavento, Reference Flaccavento2011; Mcguirt et al., Reference Mcguirt, Jilcott, Liu and Ammerman2011). Bruce and Som Castellano (Reference Bruce and Som Castellano2017), however, point out that DTC customers spend more time and effort shopping, planning meals, cooking and cleaning up—all activities which are unaccounted for in economic evaluations (Devault, Reference Devault1994). Women with lower incomes may invest even more time than their wealthier counterparts, as they more carefully take family preferences and food costs into account when making purchasing decisions (Hupkens et al., Reference Hupkens, Knibbe, Van Otterloo and Drop1998; Daniel, Reference Daniel2016).
Economic impact of local food initiatives
The increasing number of economic impact studies of local food initiatives parallels the growth of such initiatives. These studies are particularly important since advocates and policymakers often cite economic development as a rationale for obtaining funding (Alonzo, Reference Alonzo2013; National Farm to School Network, 2016; Farmers Market Coalition, 2017). Most studies on the economic impact of local foods have focused on DTC market channels, particularly farmers’ markets (Myers, Reference Myers2004; Otto and Varner, Reference Otto and Varner2005; Hughes et al., Reference Hughes, Brown, Miller and Mcconnell2008; Hughes and Isengildina-Massa, Reference Hughes and Isengildina-Massa2015), farm-to-school programs (Haynes, Reference Haynes2009; Becot et al., Reference Becot, Kolodinsky, Roche, Zipparo, Berlin and Mclaughlin2017; Christensen et al., Reference Christensen, Jablonski, Stephens and Joshi2017), or food hubs (Jablonski et al., Reference Jablonski, Schmit and Kay2016b). While the overall findings of these studies are positive, showing increased economic activity such as sales and jobs, they often provide only limited information (Sitaker et al., Reference Sitaker, Kolodinsky, Jilcott Pitts and Seguin2014; Hughes and Isengildina-Massa, Reference Hughes and Isengildina-Massa2015). For instance, a study of 34 West Virginia farmers’ market vendors estimated a net economic impact of US$1.075 million in sales and 43 full-time equivalent new jobs after considering the loss in grocery store sales due to expenditures at farmers’ markets (Hughes et al., Reference Hughes, Brown, Miller and Mcconnell2008). More recently, Hughes and Isengildina-Massa (Reference Hughes and Isengildina-Massa2015) examined the economic impact of a South Carolina ‘buy local’ campaign in farmers’ markets on the statewide economy, finding US$0.751 million in sales, US$0.104 million in earned income and 26.4 in full-time equivalent jobs. Other studies have compared the economic impact of farmers selling through DTC and intermediated channels. For example, Hardesty et al. (Reference Hardesty, Christensen, Mcguire, Feenstra, Ingels, Muck, Boorinakis-Harper, Fake and Oneto2016) reported an output multiplier of 1.86 for direct marketers in the Sacramento region, compared with 1.42 for the region's producers selling through intermediated channels. Schmit et al. (Reference Schmit, Jablonski and Mansury2016) found that small-scale producers selling through DTC market channels had higher labor and total value-added multipliers, but lower total employment and output multipliers compared with those who did not use DTC channels. Rossi et al. (Reference Rossi, Johnson and Hendrickson2017) found higher output overall and value-added multipliers but lower employment multiplier for local food sales compared with conventional food sales. The findings of these three studies reflect the differential expenditure patterns of DTC producers, who tend to farm on a smaller scale and purchase more of their input locally, when compared with non-DTC (or commodity) producers (Hardesty et al., Reference Hardesty, Christensen, Mcguire, Feenstra, Ingels, Muck, Boorinakis-Harper, Fake and Oneto2016; Schmit et al., Reference Schmit, Jablonski and Mansury2016; Rossi et al., Reference Rossi, Johnson and Hendrickson2017). Nevertheless, no studies to date have explored the local economic impact of initiatives to increase access to fresh produce for low-income recipients through the use of SNAP benefits at DTC market channels, beyond the impact on farmers’ sales (Freedman et al., Reference Freedman, Mattison-Faye, Alia, Guest and Hébert2014; Mann et al., Reference Mann, Miller, Goddeeris, Pirog and Trumbull2018).
The comprehensiveness and complexity of economic impact studies of local food initiatives vary greatly. Some studies include opportunity costs, the cost resulting from a shift in food purchases from the traditional retail sector to DTC marketing channels; and countervailing effects, the effect that occurs when increased demand for local produce leads to a reduction in the acreage of other crops produced such as corn or soy (Hughes et al., Reference Hughes, Brown, Miller and Mcconnell2008; Swenson, Reference Swenson2010; Hughes and Isengildina-Massa, Reference Hughes and Isengildina-Massa2015; Rossi et al., Reference Rossi, Johnson and Hendrickson2017). Also missing from previous economic models is consideration of the costs associated with implementation and administration of public programs and policies that support local food, which may also represent key opportunity costs. In recent years, researchers have made an effort to customize the agricultural sector to reflect the differing expenditure patterns therein (Schmit et al., Reference Schmit, Jablonski and Mansury2016; Rossi et al., Reference Rossi, Johnson and Hendrickson2017), but differences in assumptions, data sources and model customizations make comparison of results across studies difficult (Thilmany Mcfadden et al., Reference Thilmany Mcfadden, Conner, Deller, Hughes, Meter, Morales, Schmit, Swenson, Bauman, Phillips Goldenberg, Hill, Jablonski and Tropp2016; Becot et al., Reference Becot, Kolodinsky, Roche, Zipparo, Berlin and Mclaughlin2017). Consequently, scholars have developed guidelines to increase understanding of the economic tools available and to assist researchers and practitioners in the design and analysis of local food initiatives (Thilmany Mcfadden et al., Reference Thilmany Mcfadden, Conner, Deller, Hughes, Meter, Morales, Schmit, Swenson, Bauman, Phillips Goldenberg, Hill, Jablonski and Tropp2016; Phillips and Colasanti, Reference Phillips and Colasanti2017; Schmit and Jablonski, Reference Schmit and Jablonski2017).
Methods
Study setting, economic impact scenarios and data sources
The research presented here is part of the USDA Agriculture and Food Research Initiative (AFRI)-funded Farm Fresh Foods for Healthy Kids (F3HK) Project, a community-based, multi-site study. The study investigates economic, behavioral, and dietary impacts of offering low-income families a subsidized or ‘cost-offset’ CSA(CO-CSA) share subscription with tailored nutrition and food preparation education. A detailed description of the intervention's aims and methods has been published elsewhere (Seguin et al., Reference Seguin, Morgan, Hanson, Ammerman, Jilcott Pitts, Kolodinsky, Sitaker, Becot, Connor and Garner2017). The study involves four geographically- and demographically-diverse states—New York (NY), North Carolina (NC), Vermont (VT) and Washington (WA) with 2–4 farms and up to 60 low-income families with children per state. Three of these states (NY, WA, NC) are among the top 10 in the number of farms with DTC sales, while two of these states (NY and VT) are among the top 10 in DTC sales (United States Department of Agriculture, 2014). Regarding agricultural production, livestock is predominant in NC, NY and VT. Poultry, eggs and hog production represent 61.2% of states’ agricultural sales in NC while dairy represents respectively, 44.6 and 65.1% of the sales in NY and VT. Crop production is predominant in WA with 71.2% of total farm sales in crops including 32.1% of sales in fruit and tree nut production. Out of the four states, WA has the highest proportion of vegetable sales at 11.7% of total sales compared with VT, which sells the lowest proportion at 2.7% of total sales (United States Department of Agriculture, 2014). All four states have sizable numbers of SNAP recipients, ranging from 74,836 recipients in VT or 12.0% of the state population of households to 2,838,768 in NY or 14.3% of the population in 2017 (Food Research and Action Center, 2018).
This paper focuses on the potential economic impacts of interventions such as the F3HK intervention, using an input-output (IO) model to assess how public programs and policies that facilitate increased access to local food for low-income households can ripple through state economies. We investigated two scenarios: (1) increased outreach to low-income consumers, or (2) financial support for using SNAP benefits at DTC market channels. In Scenario 1, 20% of the SNAP recipients in the four intervention states shift US$20 of their weekly food expenses purchased with SNAP benefits from a grocery store to a DTC outlet in response to campaigns by USDA or state agencies encouraging SNAP redemption at farmers’ markets or for CSA shares. In this scenario, we assume that the outreach campaign would be implemented using existing resources and that none of the purchases made at the grocery store involved locally grown produce. We made the assumption that none of the supermarket vegetable sales were local due to lack of available data but based on a rough estimate using data from the 2015 USDA Local Food Marketing Practice Survey (United States Department of Agriculture, 2016) and total supermarket sales in the USA (FMI 2018), local fresh vegetable sales at supermarkets are likely under 5%. However, if these sales were to increase significantly, they would need to be accounted for in future studies. Furthermore, we purposefully chose a conservative adoption rate and amount of shifted expenses. In Scenario 2, 20% of SNAP recipients in the four intervention states receive a US$20 per week CO-CSA. The CO-CSA is subsidized 50% through USDA or state agency grants to farmers. Under this scenario, the SNAP recipient shifts US$10 per week of SNAP benefits from fresh produce purchases at grocery stores to pay for their share of the CO-CSA. The US$10 per week subsidy paid through the grant means that participating SNAP recipients receive additional benefits, freeing up US$10 which we assume is spent on food at the grocery store. We assume they do not spend it on more fresh produce; previous research has found that when low-income households’ buying power increases, including through an increase in food assistance, they spend the additional money on food groups that are seen as more basic such as meat or baked goods (Wilde et al., Reference Wilde, Mcnamara and Ranney1999; Blisard et al., Reference Blisard, Stewart and Jolliffe2004). Previous research has also shown that low-income households use increased buying power for other essentials such as housing, clothing, or transportation but for the sake of simplicity, we choose to allocate the additional benefits to the food sector only. The latter scenario best assesses the potential for scaling up CO-CSA programs like F3HK, by accounting for the cost of the subsidy to taxpayers as well as the additional food expenses of low-income households due to the additional benefits. Given the current policy environment, Scenario 1 may be more feasible, yet Scenario 2 provides a basis for evaluating grant programs that provide funding for financial incentives to SNAP customers. To compare the results across the two scenarios in each state, we modeled the same level of new direct sales for the vegetable farming sector over 1 year. We assumed that the food purchases took place during the traditional growing season, though we acknowledge that many farmers now use season extension techniques and root crop storage to allow consumers to purchase local vegetables year-round. We used a mix of primary and secondary data to build the two scenarios. Using F3HK primary data as a reference, we set the length of the CSA season to that of the intervention farms in each state (between 16 and 24 weeks) and the cost of a small share to US$20 per week, in line with these farms’ CSA prices. State-level secondary data included SNAP recipient data (number of households and average benefit); yield and price of top commodity crops; and sales, employment and proprietor income for the vegetable sector in each state. We also used data from the economic impact analysis software, IMPLAN, including the number of households in each income category and retail and wholesale margins. We provide details on how data were used in the next section.
Model parameters and analytic approach
We conducted the data analysis using IMPLAN Pro with 2013 state data. IMPLAN is often used for IO and social accounting matrix modeling due to its relatively low cost and allowance for model customizations. In IMPLAN, the economy is represented by 536 sectors based on the North American Industry Classification System and includes transactions between industries, institutions and households. Scholars and consultants have used IMPLAN in recent years to model the economic impact of local food initiatives (Hughes and Isengildina-Massa, Reference Hughes and Isengildina-Massa2015; Jablonski et al., Reference Jablonski, Schmit and Kay2016b; Thilmany Mcfadden et al., Reference Thilmany Mcfadden, Conner, Deller, Hughes, Meter, Morales, Schmit, Swenson, Bauman, Phillips Goldenberg, Hill, Jablonski and Tropp2016).
Customization of the vegetable and melon farm sector
We built on recent studies and on general best practices to customize the vegetable farming sector in IMPLAN to ensure a more accurate representation of the vegetable farming sector in each state. First, we followed the recommendations of module 7 of the Economics of Local Food Systems toolkit to adjust the number of jobs and components of the value added (employee compensation, proprietor income, other property type income and tax on production and imports) though we made different assumptions to adjust the number of jobs using 2012 agricultural census data (United States Department of Agriculture, 2014; Thilmany Mcfadden et al., Reference Thilmany Mcfadden, Conner, Deller, Hughes, Meter, Morales, Schmit, Swenson, Bauman, Phillips Goldenberg, Hill, Jablonski and Tropp2016). Starting with the adjustment to the number of jobs (employment in IMPLAN), we used a number of vegetable farmers and number of employees (full-time and part-time) from the 2012 census for the four study states. We assumed that a part-time farmer (one who worked more than 200 days off the farm) is the equivalent of 0.55 full-time farmer (one who worked up to 199 days off the farm) and also that a part-time farm employee (one who worked less than 150 days) is the equivalent of 0.41 full-time farm employee (one who worked 150 days or more). Next, we adjusted the value added. From the study area data for the vegetable and melon sector in the customize menu in IMPLAN, we obtained national estimates of output, value added and intermediate expenditures per worker, using data for the vegetable and melon sector in the study states (of note, output is the sum of value added and intermediate expenditures). Using these national expenditure data, we calculated that 81.7% of the output value is from the total value added (comprising 12.0% in employee compensation, 33.6% in proprietor income, 35.3% in other property type income and 0.8% in tax on production and imports) and 18.3% is from the intermediate expenditures. We then adjusted the value added for each of our study states, by applying the proportion of the output to the components of the value added and to the intermediate expenditures using the total vegetable sales from the 2012 Agricultural Census as our value for the output (United States Department of Agriculture, 2014).
Drawing on Hughes et al. (Reference Hughes, Brown, Miller and Mcconnell2008) we customized the vegetable and melon farming sector further to reflect the non-corporate structure of vegetable farm operations. Specifically, we shifted payments from ‘other property income’ to ‘proprietor income’ based on the percent of acres operated by family farms. We first calculated the percent of the acreage in vegetable and melon farming under family farm ownership of 50% or more. For WA, the total number of acres in vegetable and melon farming was suppressed in the 2012 Agricultural Census, while the number of acres in vegetable and melon farming with 50% ownership or more by a family farm was available. Therefore, we extrapolated the total number of acres for WA using the value of rented land and the value of owned land which we extrapolated based on the land owned. In the four study states, this ranged from 81.2% in WA to 96.9% in VT (United States Department of Agriculture, 2014). Next, we summed the proprietor income and other property type income calculated previously and applied the percent of vegetable acreage operated by family farms to the sum of proprietor incomes. In other words, we added the calculated value to property income and subtracted that value from other property type income.
Once we completed all the calculations for the four states, we made changes to the vegetable and melon farm sector using ‘study area data’ in the customize menu of IMPLAN and re-constructed our models through the regional multipliers. We did not make adjustments to any other sectors in IMPLAN and note that the adjustment to the vegetable and melon farming sector did not change the total size of the state economies noticeably. Indeed, there was no change in the gross regional product within two decimal points for any state except VT (a 0.05% increase) while total state employment increased modestly for all states ranging from 0.03% for NY to 0.17% for VT. Furthermore, comparing the vegetable and melon farming sectors in IMPLAN, we found that after adjustment, employment was higher in all states, while output was higher for NC and VT but lower for NY and WA. While recently published best practices call for adjusting patterns of agricultural producers selling directly to consumers (Jablonski and Schmit, Reference Jablonski and Schmit2016a), we did not adjust the production function nor the local purchases percentages of the vegetable and melon farm sector in IMPLAN due to lack of data. This lack of data is a common barrier in economic impact studies of local food initiatives because it is difficult and costly to collect detailed data on the expenditure patterns of farmers (O'hara and Pirog, Reference O'hara and Pirog2013; Hardesty et al., Reference Hardesty, Christensen, Mcguire, Feenstra, Ingels, Muck, Boorinakis-Harper, Fake and Oneto2016; Jablonski et al., Reference Jablonski, Schmit and Kay2016b; Conner et al., Reference Conner, Becot and Imrie2017).
Scenario building
We drew on best practices to build each scenario (summarized in Table 1). We calculated the new direct sales for the vegetable farming sectors for the two scenarios using SNAP recipients data (number of households and average benefit) (United States Department of Agriculture, 2017k). As mentioned earlier, we modeled the same level of new direct sales for the vegetable farming sector over 1 year to compare the results across the two scenarios in each state. Under Scenario 1, 20% of SNAP households spend US$20 in SNAP benefits per week during the growing season. Under Scenario 2, SNAP households use US$10 in SNAP benefits to purchase a CO-CSA that is subsided US$10 per week through a grant.
Table 1. Summary of activities used to calculate the economic impact of the two scenarios in IMPLAN

Next, we accounted for the countervailing effect that is the loss of top commodity crops to increase vegetable acreage to meet the increased demand for vegetables (Swenson, Reference Swenson2006). We use NY as an example here to explain in detail how we calculated the countervailing effect. First, we calculated the number of acres in vegetables needed to meet the new demand in local food using a somewhat conservative estimate of US$15,000 in vegetable sales per acre (Hendrickson, Reference Hendrickson2005; Chase, Reference Chase2012). In NY, the US$137.4 million in new direct sales for the vegetable farming sector requires 9160 acres. Assuming all suitable agricultural land is currently in production, we then calculated the amount of sales for the top one or two crops that would need to be shifted into vegetable production (corn and soybeans in NY and NC, hay in VT and wheat in WA) based on the relative contribution of each top crop to total sales. In NY, corn represents 76.9% of the acreage to be removed (7044 acres) and soybean represents 23.1% of the acreage (2115 acres). Then using yield and price data from the National Agricultural Statistical Services, we calculated the lost sales for the top crop(s) (United States Department of Agriculture, 2017b, 2017c, 2017d, 2017e). In NY in 2016, corn yields were 129 bushels per acre and the price was US$3.9 per bushel while soybean yields were 41 bushels per acre and the price was US$9.55 per bushel. This means that US$3.5 million in corn sales (7044 × 129 × US$3.9) and US$828,504 in soybean sales (2115 × 41 × US$9.55) were removed from the grain and seed oil farming sectors in IMPLAN.
We estimated the opportunity cost to retailers and wholesalers of shifting food purchases by SNAP recipients from food retailers to DTC market channels using the wholesale and retail sector margins for the vegetable and melon farming sector in IMPLAN (17.05% and 28.42% of food purchases, respectively). We used the margins from the ‘common margins table’ which are found by opening the model in Microsoft Access. While wholesalers and retailers were assumed to be local, transportation service businesses used by these wholesalers and retailers were not; thus, opportunity costs were not accounted for in that sector (Thilmany Mcfadden et al., Reference Thilmany Mcfadden, Conner, Deller, Hughes, Meter, Morales, Schmit, Swenson, Bauman, Phillips Goldenberg, Hill, Jablonski and Tropp2016).
For Scenario 2 only, we accounted for the opportunity cost to taxpayers resulting from increasing SNAP program funding to pay for the 50% costs offset as well as an estimated administrative cost. As stated earlier, under Scenario 1, outreach efforts by USDA and state agencies to increase redemption of SNAP benefits at DTC market channels is conducted using existing resources, without incurring additional costs. Under Scenario 2, the increase in SNAP program funding is half of the new direct sales for the vegetable farming sector and the administrative cost is 13.3% of that amount. Our estimate of the administrative cost is based on the 2016 SNAP program where states pay half of the administrative costs and the federal government pays for the other half plus a federal administrative fee (6.5% state administrative fees + 6.5% federal-state administrative fees + 0.3% federal administrative fee) (United States Department of Agriculture, 2017i; Center on Budget and Policy Priorities, 2018). While income tax in the USA is not regressive, we allocated the total cost to the taxpayer proportionally based on the number of households in each income range from the IMPLAN area demographic data for simplicity of the calculation.
Lastly, we accounted for new sales for the food store sector. The US$10 per week subsidy paid through the grant means that participating SNAP recipients receive additional benefits. We assume that the US$10 in additional benefits are spent on food at the grocery store. We assume they do not spend it on more fresh produce based on previous research (Wilde et al., Reference Wilde, Mcnamara and Ranney1999; Blisard et al., Reference Bertmann, Ohri-Vachaspati, Buman and Wharton2004).
All activities of the scenarios were entered in IMPLAN as industry changes except for the cost of the subsidy to the taxpayers which was entered as a household income change.
Results
Results are presented in Table 2. Each scenario shows positive direct and total effects for a variety of economic measures, including employment, labor income, value added at each stage of production and output (Table 2). In IMPLAN, employment is the number of salaried and self-employed full time and part time jobs needed to support the economic activity and it is derived from industry average output per employee. Labor income includes employee wages and owner's profits and it measures the value added produced by the labor component. Value-added includes wages paid to employees, profits accrued by the business owner, dividends paid to investors, interests, or rents and indirect excise tax, as well the sales and excise tax paid by individuals to the government. It is a somewhat more conservative measure than ‘sales’ and it is a similar measure to the gross domestic product. Output includes the total amount of sales revenue from all industries. We did not use the word ‘sales’ because the activity for the wholesale sector and some of the activity for the food store sectors are margined. This number is usually the largest but least conservative estimate since it includes double counting. For example, sales of apples used to make apple sauce can be counted multiple times: when the apple grower sells the apples to the food manufacturer when the food manufacturer sells the finished product to a wholesaler and last when the wholesaler sells the apple sauce to a retailer.
Table 2. Results of the economic impact analysis for Scenarios 1 and 2

The direct effect captures the initial changes in the economy (detailed in Table 1) while the total effect represents the sum of all activities. The economic activity generated by increased local sales in the vegetable farm sector leads to an overall positive impact on the economy, even when considering losses to the commodity crop sector due to the countervailing effect and to the wholesale and food retail sectors due to reduced margins. In other words, for each scenario, despite losses in the two sectors, there is still a net economic gain.
We now provide additional details and interpretation on our findings for each effect. The larger direct effect for Scenario 2 across all states and all types of economic activities (employment, labor income, value added and output) is easily explained by the additional resources received by SNAP recipients to purchase the CSA. This not only generated new sales for the vegetable farming sector, it also generated additional sales for the food store sector. Of note, Scenario 2 accounts for costs to the taxpayer, which Scenario 1 did not include given that the outreach was conducted using existing resources. This cost is not reflected in the direct effect but in the induced effect (presented below).
The indirect effect varies across scenarios and states for labor income, value added and output. Indirect effects measure what happens to economic activities in the farming, wholesale and food retail sectors in response to an increased or decreased level of demand for purchased goods and services. For example, a decrease in economic activity in wholesale and retail businesses would lead to cutting back on costs such as warehousing or advertising, resulting in decreased economic activity in those sectors. Under Scenario 1, the indirect effect for value-added and output is negative in every state. The indirect effect for labor income is negative in every state except for WA. This might mean that the overall economic indirect effects due to additional sales for the vegetable farming sector are smaller than the negative economic effects due to losses in the commodity crop sector and losses to the wholesale and food store sectors. Under Scenario 2, the indirect effect was positive for labor income in all states, positive for value-added and output in NC and WA and negative for value-added and output in NY and VT. These differences of impacts across states likely highlight the differences in state economic structures and sector expense patterns. For employment, both scenarios show a positive indirect effect, reflecting the labor-intensive nature of the vegetable farming sector compared with the grain and seed oil farming sectors, food retail and wholesale sectors. The lower wages paid in agriculture compared with retail and wholesale work may explain why there is a positive indirect effect for employment yet a negative indirect effect on labor income under Scenario 1 for NY, NC and VT.
The induced effect is positive for Scenario 1 but negative for the Scenario 2. Induced effects reflect spending by households that result from changes to their income. In Scenario 1, additional household income generated by economic activity in the vegetable farming sector, especially due to new jobs, outpaces losses due to decreased economic activity in other sectors. Scenario 2 accounts for the decrease in taxpayers’ income resulting from the cost of the CSA subsidy through grant and administrative costs, leaving less for them to spend on household goods and services. In IMPLAN, the cost to taxpayers is modeled as a household income change, which directly impacts the induced effect. Comparing the induced effect with the cost to taxpayers that we modeled, we note that the induced effect is smaller than the cost to the taxpayer. For example, the ratio of induced effect to cost to taxpayers is 6:31 in NY and 6:41 in NC. It is important to note that the induced effect also includes changes to household income resulting from other activities included in the scenarios.
The total effect for employment, labor income, value added and output is lower for Scenario 2 than Scenario 1 across all states, despite the larger direct effect observed under Scenario 2. This finding highlights greater generation of total economic activity under Scenario 1. This important finding points to differences in expenditure patterns between the vegetable farming sector and the food store sector, as well as differences in the ownership structure and geographical location of the owner. Ninety-seven percent of all US farms are owned by individual families (United States Department of Agriculture, 2014) while food retail ownership is highly concentrated as illustrated by the fact that four supermarket chains controlled 51% of the market shares in 2011 (Howard, Reference Howard2016). This means that unlike the farm sector, food retail chains are mainly operated out of state, with expenses less likely to be local and profits more likely to leak out of the local economy. That farms, in particular, smaller-scale farms, generate more activity for the local economy than larger farms and food retailers has been discussed at length in the literature (Goldschmidt, Reference Goldschmidt1947; Lobao, Reference Lobao1990; Lyson, Reference Lyson2004). This is one of the major arguments to support community development through re-localization of the food system. In connection with the economic development argument, the vegetable and melon farming sector are the most impacted by changes in economic activity across the four states in both scenarios. For instance, in Scenario 2, the number of jobs added to this sector range from 124 in VT to 2388.90 in NY while growth in output ranges from US$3.6 million in VT to US$137.7 million in NY.
Another impact measure is the total multiplier effect (total effect divided by direct effect), a measure of how much an initial change in economic activity impacts the overall regional economy. For example, the estimated output multiplier of 1.7 for NY means that for every dollar generated through the initial activity an additional US$0.70 is added to the economy. Overall, we find the multipliers for all measures (employment, labor income, value added and output) to be positive across both scenarios and all geographic areas. This means that economic activity increased as a result of the outreach efforts under Scenario 1 and the additional support to low-income households to increase purchases of local food under Scenario 2. The multipliers for labor income, value added and output measures are higher under Scenario 1 and relatively consistent across all states, reflecting the lower cost of an intervention promoting use of SNAP benefits to purchase produce through DTC market channels, but also reflecting differences between the farm and food retail sectors in terms of expenditure patterns, ownership structure and geographic location of owners as discussed above. The employment multiplier, while also higher under Scenario 1, shows greater variation across states, with NY and VT similarly modest, and NC and WA markedly higher. Considering that the largest economic change in direct effect is due to increased economic activity in the vegetable sector, variations likely reflect differences in the structure of the vegetable farm sector in each state, with NC and WA having a lower reliance on labor and higher mechanization.
Discussion and conclusion
In this study, we used IMPLAN to model how a shift in low-income household food expenditures from traditional food retailers to DTC market channels resulting from programmatic and policy changes could impact the local economy. Our work contributes new evidence on the value of expanding public and private resources to support low-income households’ access to local food while providing DTC farmers with additional markets.
We find that overall, relatively modest shifts in food expenditures of low-income households can lead to a positive net economic impact. We confirm previous findings on the wider economic benefits of increased DTC sales (Hughes et al., Reference Hughes, Brown, Miller and Mcconnell2008; Hughes and Isengildina-Massa, Reference Hughes and Isengildina-Massa2015; Thilmany Mcfadden et al., Reference Thilmany Mcfadden, Conner, Deller, Hughes, Meter, Morales, Schmit, Swenson, Bauman, Phillips Goldenberg, Hill, Jablonski and Tropp2016) and also describe the nuances of these benefits. For example, while both scenarios showed a positive economic impact of DTC sales overall, we found greater economic benefit for Scenario 1, which relies on the use of existing resources to encourage SNAP recipients to purchase fresh produce directly from farmers. We also find evidence in Scenario 2 of leakages of economic activity for food store sales compared with DTC sales. This aligns with previous studies and suggests that when opportunity costs are taken into consideration, local food sales can support economic and, more broadly, community development (Goldschmidt, Reference Goldschmidt1947; Lyson, Reference Lyson2004; Hughes et al., Reference Hughes, Brown, Miller and Mcconnell2008; Jablonski and Schmit, Reference Jablonski and Schmit2016a).
From a cost-benefit perspective, the lower total effect compared to the direct effect in Scenario 2 (despite higher initial economic activity) and indications of leakages imply that resources to increase production capacity of vegetable farmers may have a greater economic impact than campaigns targeting low-income consumers. Nonetheless, direct subsidies to low-income customers for DTC produce purchases could increase preference for fresh produce in general, leading to additional sales of local produce through DTC and traditional retailers, thus potentially expanding market channels for growers. Indeed, recent studies have found that food assistance benefits beyond SNAP, such as farmers’ market incentive programs like Double Up Food Bucks in Michigan (Mann et al., Reference Mann, Miller, Goddeeris, Pirog and Trumbull2018) or Shop ‘n Save in South Carolina (Freedman et al., Reference Freedman, Mattison-Faye, Alia, Guest and Hébert2014), led to increased farmers’ market sales. In some cases, increased sales were greater than the value of the food assistance provided. A general increase in preference for buying fresh produce might not only lead to greater economic activity, but also to better diets and fewer chronic diseases and thus to improved quality of life, increased productivity and healthcare cost savings in the long term (Jensen, Reference Jensen2011; Willis et al., Reference Willis, Defina, Bachmann, Franzini, Shay, Gao, Leonard and Berry2015).
Beyond the overall economic impact of local food initiatives, it is important to consider their impact on additional sectors. Job creation is an argument often used by policymakers and advocates to push local food initiatives forward. Both scenarios we examined lead to job creation across the four states, most of which are in the agricultural sector. Though seldom mentioned in the literature, agricultural sector jobs on average pay lower wages, offer fewer benefits and are seasonal compared with food retail and wholesale sector jobs (sectors impacted in both scenarios). Beyond lower wages, lower benefits and harder working conditions, the prospect of additional jobs in the agricultural sector might also puzzle policymakers because this labor-intensive sector is fraught with labor shortages and produce farmers often rely on migrant workers (Jensen, Reference Jensen, Bailey, Jensen and Ransom2014; Kitroeff and Mohan, Reference Kitroeff and Mohan2017). These agricultural labor issues are also directly connected to the aging and shrinking of the farm population. Despite a renewed interest among younger people to start farming, beginning farmers face major barriers such as access to land, capital and health insurance (Ahearn, Reference Ahearn2011; Inwood, Reference Inwood2013; Ekers et al., Reference Ekers, Levkoe, Walker and Dale2016; Ackoff et al., Reference Ackoff, Bahrenburg and Lusher Shute2017; Dewey, Reference Dewey2017). This raises important questions about farm viability and whether initiatives to increase the consumer base can partially enable farmers to develop and maintain their operations.
While the net economic impact is positive under both scenarios, incentives to purchase more produce from DTC markets could have negative, unintended consequences on food retailers, particularly those in rural areas and urban food deserts. While the availability of fresh produce in these areas can be limited (Morton, Reference Morton2007; Walker et al., Reference Walker, Keane and Burke2010), DTC market channels may be less convenient to access than food stores, which tend to be open daily for extended hours year-round. If retail stores were to experience a sizable decrease in produce sales, they might cease to sell fresh produce altogether, thus decreasing access to fresh produce for customers who are unable or uninterested in purchasing from DTC market channels. Therefore, any program or policy to increase access to fresh produce through DTC market channels, particularly in rural areas and urban food deserts, must also consider other ways consumers access produce.
Lastly, the differences in the magnitude of the total multiplier effect across four study states point to underlying variations in economic structures in each state and underscore the fact that local food purchase initiatives will have different impacts depending on geographic location. Therefore, the results of economic impact studies cannot be directly translated across regions. Our results reinforce the importance of studies that account for local context, including the scale of the local economy under study. As evidence on the economic impact of local food initiatives grows, ranges of plausible economic multipliers will become more available. This is helpful for researchers as well as consumers of economic impact studies in their assessment of potential errors in the analysis and of study quality. For instance, Hughes (Reference Hughes2003) provided a useful example of plausible ranges of economic multipliers based on the size of the economy under study. However, his example is for the economy in general and does not account for customization in IMPLAN.
Our study has several limitations, indicating important avenues for future research. First, while we used best practices from the economic impact literature to make adjustments in IMPLAN, we were not able to fully customize the agricultural sector to account for the differential expenditure patterns of farmers who sell to DTC due to a lack of data. Because farmers participating in the local food system have been found to have a greater reliance on labor and purchase a greater proportion of their input locally (Jablonski and Schmit, Reference Jablonski and Schmit2016a) this likely means that our results underestimate the number of jobs and labor income, as well as the direct economic impact. As mentioned above, in recent years several researchers have called for better data to more accurately measure the economic impact of local food initiatives.
Secondly, our scenarios assumed that none of the existing purchases from food stores were local. Our results might, therefore, represent an overestimation of the economic impact though our rough calculation of local produce sold in food stores indicate that these sales might be very small (less than 5% of all fresh produce sold). As more data become available and if local food sales continue to grow, future studies assessing shifts from food stores to DTC market channels should account for the food store purchases that were already local. Lastly, we account for the countervailing effects of the increased need for vegetable production in each state. The requirements for growing field crops compared with vegetables (i.e. specialty crops) differ in terms of climatic conditions, water needs, equipment, labor and even production knowledge. The shift in production might lead to reduced yields as the environment and infrastructure might not be as suited for specialty crop production. The shift would also likely incur costs for farmers including equipment, labor and re-training. We did not account for these changes in our scenarios. However, based on previous studies, these costs might be offset by higher sales per acre (Swenson, Reference Swenson2006; Swenson, Reference Swenson2010). With so many variables, it is difficult to gauge whether our findings over- or underestimate the economic impact. Therefore, accounting for these changes is an important, albeit complex, an avenue for future research.
Despite the limitations discussed above, our results align with and expand upon previous evaluations of the potential economic impacts of local food initiatives. Our results provide a nuanced analysis of how resources used to promote the purchase of locally-grown produce by low-income households may impact different facets of the agricultural economy across diverse geographic regions and may thus have important programmatic and policy implications.
Acknowledgements
We would like to acknowledge the contributions and efforts of our colleagues, KL Hanson, LM Connor and JT McGuirt, as well as all extension, farmer and educator partners who have contributed their time and expertise to the Farm Fresh Foods for Healthy Kids study. Last, we acknowledge the anonymous reviewers for their valuable comments.
Financial support
This work was supported by the US Department of Agriculture award number 2015-68001-23, 230. The funding agency played no role in the study design, data collection, data analysis and write up.
Conflict of interest
None.


