INTRODUCTION
Our understanding of helminth communities in vertebrates such as rodents is mostly based on destructive, cross-sectional studies conducted over a relatively short period of time, typically 1–3 years (Lewis, Reference Lewis1968; Montgomery and Montgomery, Reference Montgomery and Montgomery1988; Behnke et al. Reference Behnke, Barnard, Bajer, Bray, Dinmore, Frake, Osmond, Race and Siński2001; Bajer et al. Reference Bajer, Behnke, Pawelczyk, Kulis, Sereda and Siński2005; Jackson et al. Reference Jackson, Hal, Friber, Ralli, Lowe, Zawadzka, Turner, Stewart, Birtles, Paterson, Bradley and Begon2014). While several workers have addressed seasonal changes in helminth burdens in wild rodents (Tenora and Zejda, Reference Tenora and Zejda1974; Langley and Fairley, Reference Langley and Fairley1982; Montgomery and Montgomery, Reference Montgomery and Montgomery1988; Abu-Madi et al. Reference Abu-Madi, Behnke, Lewis and Gilbert2000; Bajer et al. Reference Bajer, Behnke, Pawelczyk, Kulis, Sereda and Siński2005), there are relatively few long-term quantitative studies, spanning a decade or even more, that have been comprehensively analysed (but for longer-term changes in helminths of rodents see also Elton et al. Reference Elton, Ford, Baker and Gardner1931; Kisielewska, Reference Kisielewska1970a ; Haukisalmi et al. Reference Haukisalmi, Henttonen and Tenora1988; Tenora and Stanĕk, Reference Tenora and Stanĕk1995; and in other mammals Keith et al. Reference Keith, Cary, Yuill and Keith1985; Boag et al. Reference Boag, Lello, Fenton, Tompkins and Hudson2001; Cattadori et al. Reference Cattadori, Boag and Hudson2008; Cornell et al. Reference Cornell, Bjornstad, Cattadori, Boag and Hudson2008 in lagomorphs; the long-term study on parasites of sheep on Soay, Pemberton and Hayward, personal communication).
A key theoretical question concerns the role of parasite species and communities in the evolution of their hosts. Immunoparasitological perspectives (e.g. Jackson et al. Reference Jackson, Hal, Friber, Ralli, Lowe, Zawadzka, Turner, Stewart, Birtles, Paterson, Bradley and Begon2014) focus on the role of parasites in shaping the immunological profile of the host; alternatively, studies focused on life history strategies test predictions that parasites can modify life history parameters (Barnard et al. Reference Barnard, Behnke, Bajer, Bray, Race, Frake, Osmond, Dinmore and Siński2002, Reference Barnard, Kuliś, Behnke, Bajer, Gromadzka-Ostrowska, Stachon and Siński2003). However, it is important to establish whether the patterns that have been detected in particular hosts in specific locations are repeatable over longer ecologically relevant periods of time, if we are to infer that parasites can influence host speciation. Long-term studies allow the robustness and repeatability of detected trends to be assessed and provide an opportunity to relate species richness, as well as diversity, prevalence and abundance of individual parasites to climatic, environmental and host demographic changes over time (Tenora, Wiger and Barus, Reference Tenora, Wiger and Barus1979; Haukisalmi et al. Reference Haukisalmi, Henttonen and Tenora1988; Haukisalmi and Henttonen, Reference Haukisalmi and Henttonen1990, Reference Haukisalmi and Henttonen2000; Hudson et al. Reference Hudson, Cattadori, Boag and Dobson2006). The resulting models can then allow informed predictions about the consequences of climate change for human health and that of our livestock (Huntley et al. Reference Huntley, Fürsich, Alberti, Hethke and Liu2014).
Some short-term studies have reported relatively stable patterns of infection with helminths in European rodents, with common helminths maintaining their dominant status and rarer species fluctuating more unpredictably (Kisielewska, Reference Kisielewska1970a ; Montgomery and Montgomery, Reference Montgomery and Montgomery1990; Bajer et al. Reference Bajer, Behnke, Pawelczyk, Kulis, Sereda and Siński2005; Knowles et al. Reference Knowles, Fenton, Petchey, Jones, Barber and Pedersen2013). In spite of this relative stability, it is the minor fluctuations in the common species that are primarily responsible for between-year variation in derived measures such as diversity indices and species richness (Behnke et al. Reference Behnke, Bajer, Harris, Newington, Pidgeon, Rowlands, Sheriff, Kuliś-Malkowska, Siński, Gilbert and Barnard2008b ). Others have reported more dynamic changes in particular helminths (Tenora, Wiger and Barus, Reference Tenora, Wiger and Barus1979; Haukisalmi et al. Reference Haukisalmi, Henttonen and Tenora1988; Montgomery and Montgomery, Reference Montgomery and Montgomery1990; Tenora and Stanĕk, Reference Tenora and Stanĕk1995; Behnke et al. Reference Behnke, Lewis, Mohd Zain and Gilbert1999) and especially in measures of component community structure (Behnke et al. Reference Behnke, Bajer, Harris, Newington, Pidgeon, Rowlands, Sheriff, Kuliś-Malkowska, Siński, Gilbert and Barnard2008a ).
Building on our earlier published studies in NE Poland (Behnke et al. Reference Behnke, Barnard, Bajer, Bray, Dinmore, Frake, Osmond, Race and Siński2001, Reference Behnke, Bajer, Harris, Newington, Pidgeon, Rowlands, Sheriff, Kuliś-Malkowska, Siński, Gilbert and Barnard2008a , Reference Behnke, Bajer, Harris, Newington, Pidgeon, Rowlands, Sheriff, Kuliś-Malkowska, Siński, Gilbert and Barnard b ), here we report on four cross-sectional studies of the helminth parasites of bank voles conducted over an 11-year period (1999, 2002, 2006 and 2010) in order to assess the longer-term stability of helminth communities in these hosts. As we reported recently when analysing haemoparasites of the same animals (Bajer et al. Reference Bajer, Welc-Falęciak, Bednarska, Alsarraf, Behnke-Borowczyk, Siński and Behnke2014), the work was conducted in the same three sites and in the same locations within each wood, at the same time of year. Our primary objective was to assess the relative importance of temporal vs spatial factors in affecting helminth infracommunities in bank voles in our study sites.
MATERIALS AND METHODS
Study sites
Our study sites have been described comprehensively in earlier papers by Behnke et al. (Reference Behnke, Barnard, Bajer, Bray, Dinmore, Frake, Osmond, Race and Siński2001, Reference Behnke, Bajer, Harris, Newington, Pidgeon, Rowlands, Sheriff, Kuliś-Malkowska, Siński, Gilbert and Barnard2008a , Reference Behnke, Bajer, Harris, Newington, Pidgeon, Rowlands, Sheriff, Kuliś-Malkowska, Siński, Gilbert and Barnard b ). They are located in the Mazury lake district region in the NE corner of Poland, in the vicinity of Jezioro (Lake) Śniardwy and the towns of Mikołajki, Ryn and Pisz. Site 1 is referred to as Urwitałt (N 53°48·153, EO 21°39·784), Site 2 as Tałty (N 53°53·644, EO 21°33·049) and Site 3 as Pilchy (N 53°42·228, EO 21°48·499) after nearby settlements. These sites are within 10 km of one another in a NE to SW transect but separated by lakes, rivers, canals and pastures and therefore are isolated from one another in ecological time, although the host species is panmictic and genetic studies have revealed some gene flow between the three populations (Kloch et al. Reference Kloch, Babik, Bajer, Siński and Radwan2010). The sites were sampled at the same time of year in each year of the study (last two weeks of August and the first two weeks of September).
Terminology and collection of bank voles
In this paper we refer to Myodes glareolus for bank voles following Carleton et al. (Reference Carleton, Musser, Pavlinov, Averianov and Abramson2003, Reference Carleton, Gardner, Pavlinov and Musser2014) and not Clethrionomys glareolus as in earlier studies and argued by Tesakov et al. (Reference Tesakov, Lebedev, Bannikova and Abramson2010). The methods used for trapping rodents, and for sampling and processing trapped animals have all been fully described (Behnke et al. Reference Behnke, Barnard, Bajer, Bray, Dinmore, Frake, Osmond, Race and Siński2001, Reference Behnke, Bajer, Harris, Newington, Pidgeon, Rowlands, Sheriff, Kuliś-Malkowska, Siński, Gilbert and Barnard2008a , Reference Behnke, Bajer, Harris, Newington, Pidgeon, Rowlands, Sheriff, Kuliś-Malkowska, Siński, Gilbert and Barnard b ). Age categories were established as described earlier using principal components analysis in the software package IBM SPSS Statistics Version 21 (IBM Corporation) of a range of morphological measures including body weight and dried eye lens weight (Behnke et al. Reference Behnke, Barnard, Bajer, Bray, Dinmore, Frake, Osmond, Race and Siński2001) and three age classes were established. Age class 1 voles were immature juveniles, age class 2 voles were mostly young adults and age class 3 were breeding older animals.
Identification and quantification of endoparasites
The entire alimentary tracts were brought back to the University of Nottingham in either 70% ethanol (2010) or in 10% formalin (1999, 2002 and 2006) for dissection. The fixed intestines were opened carefully in water or Hanks’ saline and examined under a dissecting microscope. All parasite specimens were identified, sexed and stored in tubes containing 70% ethanol. Tapeworms were stained using borax carmine, dehydrated in ethanol and mounted in Canada Balsam for microscopical examination. In this paper we refer to Aspiculuris as Aspiculuris tianjinensis, rather than Aspiculuris tetraptera as previously stated, because recent molecular genetic data and morphological observations have revealed that the Aspiculuris species parasitizing bank voles is not A. tetraptera but a close relative, A. tianjinensis (Liu et al. Reference Liu, Bu and Zhang2012; Behnke et al. Reference Behnke, Stewart, Bajer, Grzybek, Harris, Lowe, Ribas, Smales and Vandegrift2016).
Statistical analysis
Prevalence values (percentage of animals infected) are given with 95% confidence limits (CL95), calculated by bespoke software based on the tables of Rohlf and Sokal (Reference Rohlf and Sokal1995). Abundance of infection (including both infected and non-infected animals) is summarized by arithmetic means and standard errors of the mean (s.e.m.).
The degree of aggregation in the data was calculated by the index of discrepancy (D) as described by Poulin (Reference Poulin1993) and the index of dispersion (I, variance to mean ratio). Frequency distributions of raw values from individual taxa as well as the residuals from general linear models (GLM) were also tested for goodness of fit to negative binomial, positive binomial and Poisson models by χ 2 as described by Elliott (Reference Elliott1977).
The statistical approach adopted has been documented comprehensively in our earlier publications (Behnke et al. Reference Behnke, Barnard, Bajer, Bray, Dinmore, Frake, Osmond, Race and Siński2001, Reference Behnke, Bajer, Harris, Newington, Pidgeon, Rowlands, Sheriff, Kuliś-Malkowska, Siński, Gilbert and Barnard2008a , Reference Behnke, Bajer, Harris, Newington, Pidgeon, Rowlands, Sheriff, Kuliś-Malkowska, Siński, Gilbert and Barnard b ; Bajer et al. Reference Bajer, Behnke, Pawelczyk, Kulis, Sereda and Siński2005). For analysis of prevalence we used maximum likelihood techniques based on log linear analysis of contingency tables in the software package IBM SPSS. This approach is based on categorical values of the factors of interest, which are used to fit hierarchical loglinear models to multidimensional cross-tabulations using an iterative proportional-fitting algorithm and detects associations between the factors, one of which may be presence/absence of infection. Initially, full factorial models were fitted, incorporating as factors SEX (2 levels, males and females), AGE (3 levels), YEAR of study (4 levels, 1999, 2002, 2006, 2010), and SITE (3 levels, Urwitałt, Tałty, Pilchy). The presence or absence of parasites (INFECTION) was considered as a binary factor. All these five factors were fitted initially to all models that were evaluated. For each level of analysis, beginning with the most complex model involving all possible main effects and interactions, those combinations that did not contribute significantly to explaining variation were eliminated stepwise beginning with the highest level interaction (backward selection procedure). A minimum sufficient model was then obtained, for which the likelihood ratio of χ 2 was not significant, indicating that the model was sufficient in explaining the data. The importance of each term in interactions involving INFECTION in the final model was assessed by the probability that its exclusion would alter the model significantly and these values are given in the text. The remaining terms in the final model that did not include INFECTION (for example, variation among sites in the number of animals of each sex sampled [SITE × SEX]) are not given but can be made available from the authors on request.
For analyses of quantitative data conforming to Gaussian distributions we used GLM with normal errors implemented in R version 2.2·1 (R Core Development Team) and the residuals were checked for approximate goodness of fit to the Gaussian distribution. When the residuals failed to meet the requirements of Gaussian models we used GLM with negative binomial or Poisson error structures. Full factorial models that converged satisfactorily were simplified using the STEP procedure and tested for significance using deletion of terms beginning with the highest order interaction by comparing models with or without that interaction. Changes in deviance (DEV) are given for models based on Poisson errors (interpreted by χ 2), for models based on Gaussian errors we give F and for those based on negative binomial errors the likelihood ratio (LR). Minimum sufficient models were then fitted (all significant interactions and main effects plus any main effects that featured in interactions) and the process was repeated to obtain values for changes in deviance, test statistics and probabilities. The percentage of deviance accounted for by each significant main effect or interaction was calculated as recommended by Xu (Reference Xu2003) and reported by Behnke et al. (Reference Behnke, Bajer, Harris, Newington, Pidgeon, Rowlands, Sheriff, Kuliś-Malkowska, Siński, Gilbert and Barnard2008b ).
If the data did not meet the assumptions of parametric tests, we employed non-parametric tests (Kruskal–Wallis test for k levels in a specified factor and the Mann–Whitney U-test where factors only had two levels, e.g. SEX).
We used canonical discriminant function analysis (CDF) in IBM SPSS as an additional approach to evaluate the relative importance of the influence of site and year on parasite burdens. Quantitative parasite data for each of the species of helminths were first standardized by loge (x + 1) transformation of individual worm burdens for each species, then subtraction of mean loge value for each species and division by the standard deviation (s.d.) before analysis.
RESULTS
Numbers of voles and trapping effort
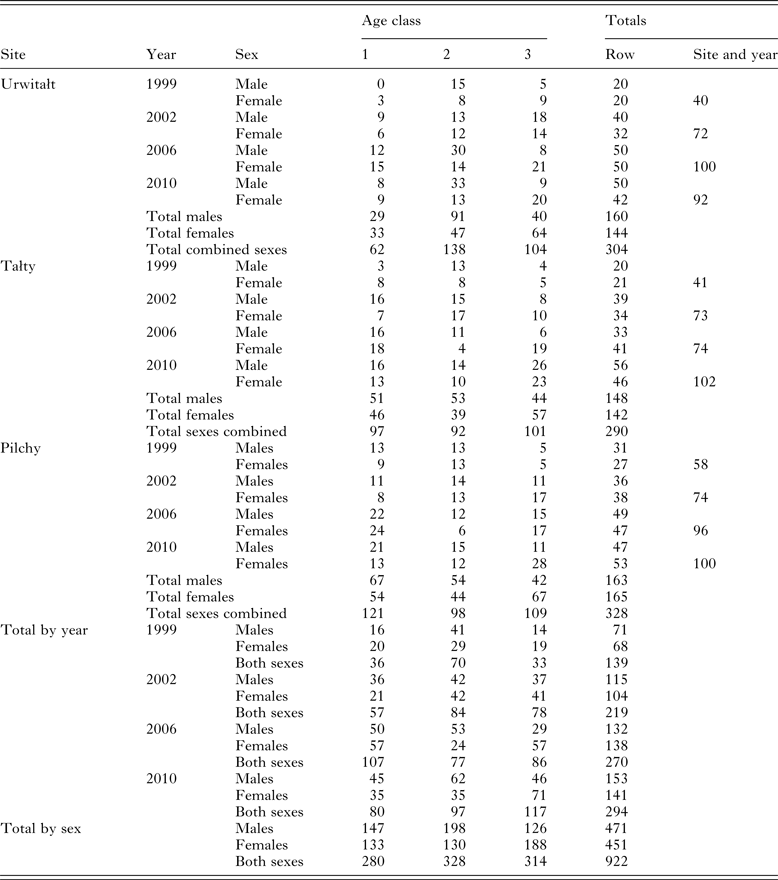
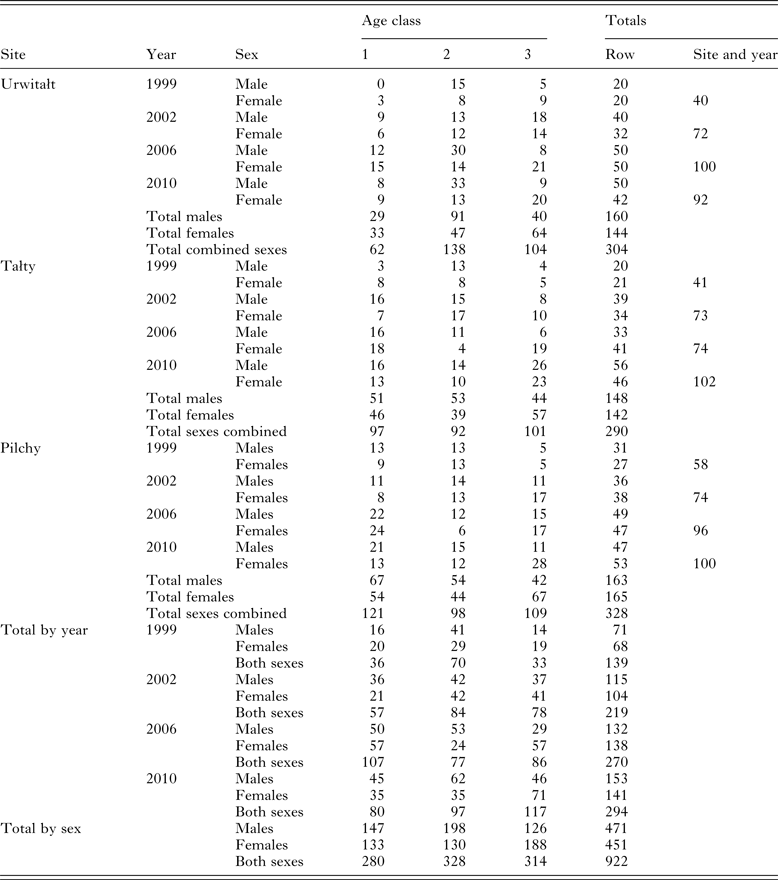
Table 1 summarizes the numbers of voles sampled by age class, sex, year and site. Trapping effort varied between surveys and sites depending on local and year specific constraints. In 2002, 2006 and 2010, relative host population density was recorded as the number of animals caught per 10 000 trap hours, but these data were not collected in the first survey in 1999, although it is known from other studies that 1999 was a year when bank vole density was high at Urwitałt (Bajer et al. Reference Bajer, Behnke, Pawelczyk, Kulis, Sereda and Siński2005, recorded 85 and 188·3 voles/10 000 trap hours in August and September 1999, respectively, in Urwitałt) and Pilchy (personal observation). In 2002, the total of trap hours recorded was 33 520 (9356, 12 284 and 11 880 for Urwitałt, Tałty and Pilchy, respectively) and the number of bank voles was 85·5, 81·4 and 156·6/10 000 trap hours, respectively. In 2006 total trap hours were 71 112 (26 085, 25 004 and 20 023 for Urwitałt, Tałty and Pilchy, respectively) and the number of bank voles was 110·4, 61·7 and 131·9/10 000 trap hours, respectively). In 2010 total trap hours were 67 639 (14 927, 18 349 and 34 363 for Urwitałt, Tałty and Pilchy, respectively) and the number of bank voles was 125·3, 76·8 and 38·1/10 000 trap hours, respectively.
Table 1. Number of voles sampled in successive surveys, by site, and host age and sex
Prevalence and abundance of helminths
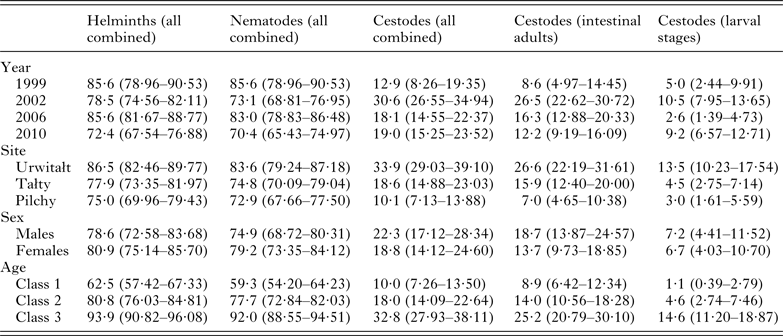
The overall prevalence of helminths (all species combined) was 79·7% (76·12–82·92). Prevalence values were generally high throughout (Table 2 and Fig. 1A), especially among voles from Urwitałt. Although there was no independent effect of either YEAR or SITE, the rank order of prevalence of helminths at the three sites changed significantly over time (YEAR × SITE × INFECTION, χ6 2 = 35·3, P < 0·001). Prevalence was highest in voles from Urwitałt in 1999 and lowest in those from Pilchy, maintaining the highest values in Urwitałt in 2002 and 2006, but not in 2010 when prevalence was highest in the voles from Pilchy (Fig. 1A). There was no significant difference between the sexes (Table 2) but there was a highly significant increase in prevalence with increasing age of voles (Table 2; AGE × INFECTION, χ2 2 = 104·9, P < 0·001), total prevalence in the oldest class was in excess of 90% in each of the four surveys (Fig. 2A).
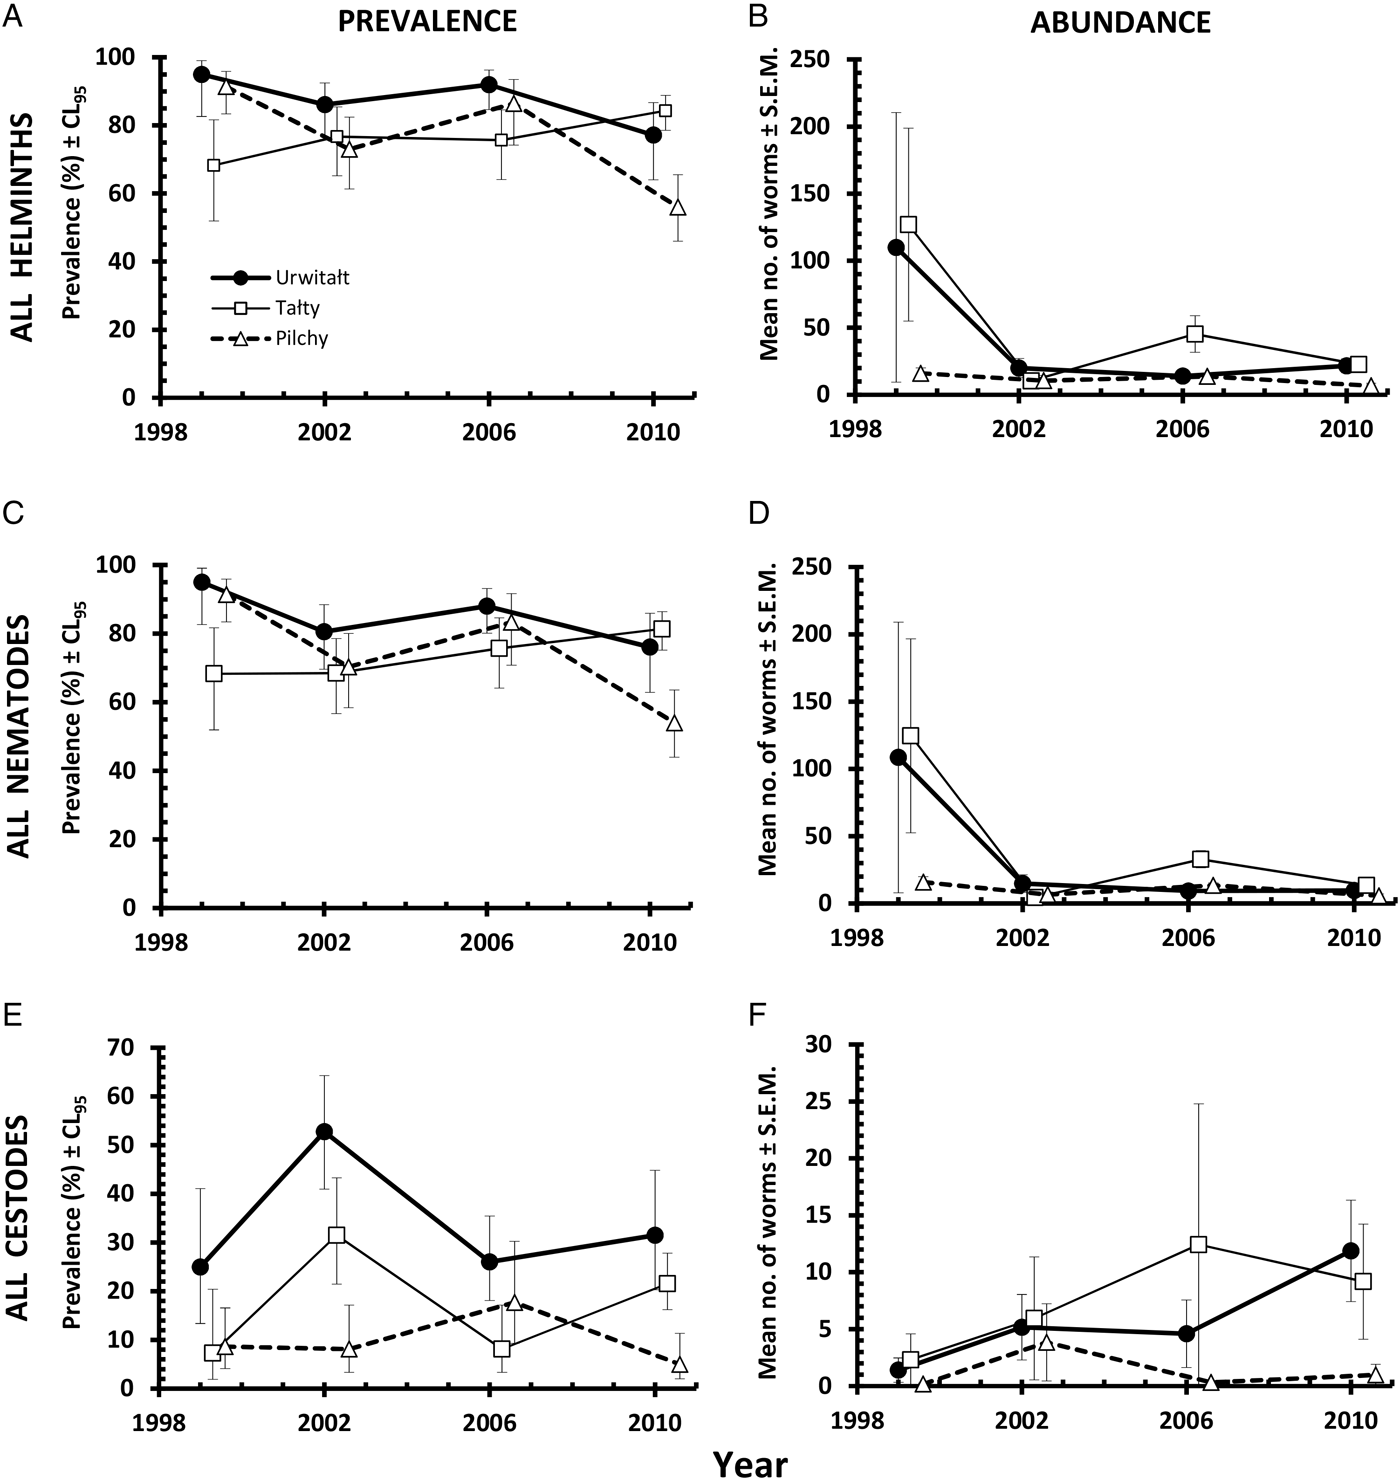
Fig. 1. Spatiotemporal dynamics at the three study sites in prevalence (A, C and E) and abundance (B, D and F) of all helminths (A and B), all nematodes (C and D), and of all cestodes (E and F). Key to symbols used in B, C, D, E and F, as in A.

Fig. 2. Age-related changes in prevalence of all helminths (species combined) by year of survey (A), in helminth species richness by site of survey (B), in Brillouin's Index of Diversity by year of survey (C), in prevalence of nematodes (species combined) by year of survey (D), abundance of nematodes by site of survey (E), abundance of H. mixtum (F), abundance of H. glareoli (G), prevalence of A. tianjinensis by year of survey (H), prevalence of S. petrusewiczi by site (I). Key to symbols used as shown in panel B.
Table 2. Prevalence of higher taxa – all helminths combined, all nematodes combined and all cestodes combined by year, site, host sex and age class
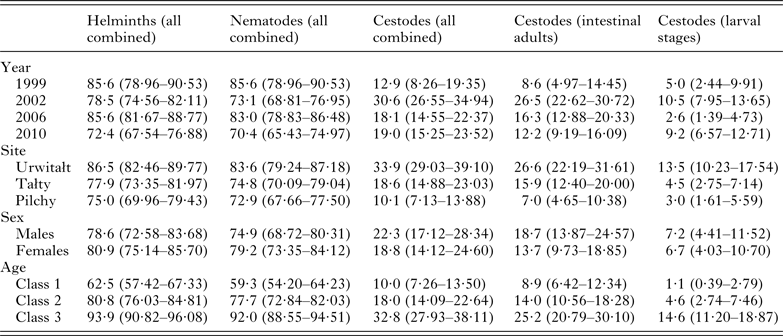
See text for statistical analysis.
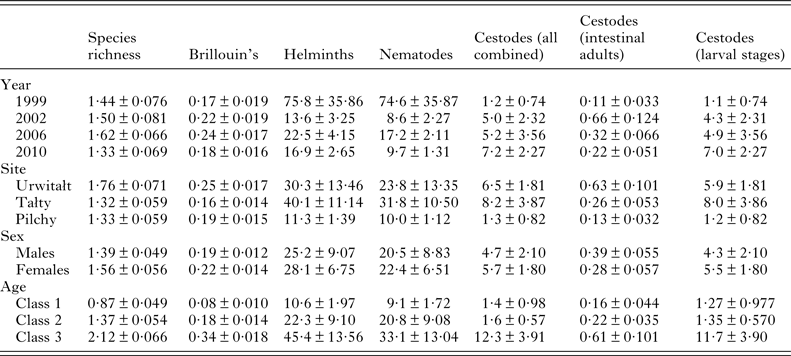
The overall abundance of helminths (all species combined) was 26·6 ± 5·68 worms per vole. Full factorial models with negative binomial errors did not converge satisfactorily, but the best fit was a model with all main effects and one interaction. However, abundance did not differ significantly between the sexes and SEX was not a component in the interaction (Table 3; main effect of SEX on abundance of helminths, LR 1,913 = 0·055, P = 0·8), and we therefore excluded SEX from the remaining analysis. Abundance varied significantly between the surveys (Table 3; main effect of YEAR, LR 3,914 = 116·7, P < 0·0001) and between sites (main effect of SITE, LR 2,914 = 56·4, P < 0·0001) but there was also a significant interaction between YEAR and SITE (LR 6,908 = 41·7, P < 0·0001), which is illustrated in Fig. 1B. In 1999 helminth abundance was at its highest level (Table 3), but this was evident at two sites only, with those from Pilchy showing the lowest and most stable helminth abundance over the four surveys (Fig. 1B). Helminth abundance at Urwitałt and Tałty dropped markedly after 1999 and was only just higher than at Pilchy over the following surveys. Helminth abundance also increased markedly with host age (Table 3; main effect of AGE, LR 2,914 = 112·3, P < 0·0001), being more than 4-fold higher among the oldest class compared with the youngest class.
Table 3. Species richness, diversity and abundance of higher taxa – all helminths combined, all nematodes combined and all cestodes combined by year, site, host sex and age class
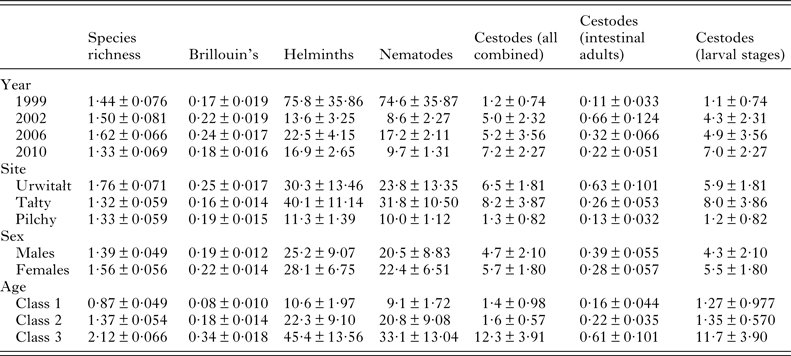
See text for statistical analysis.
Species richness
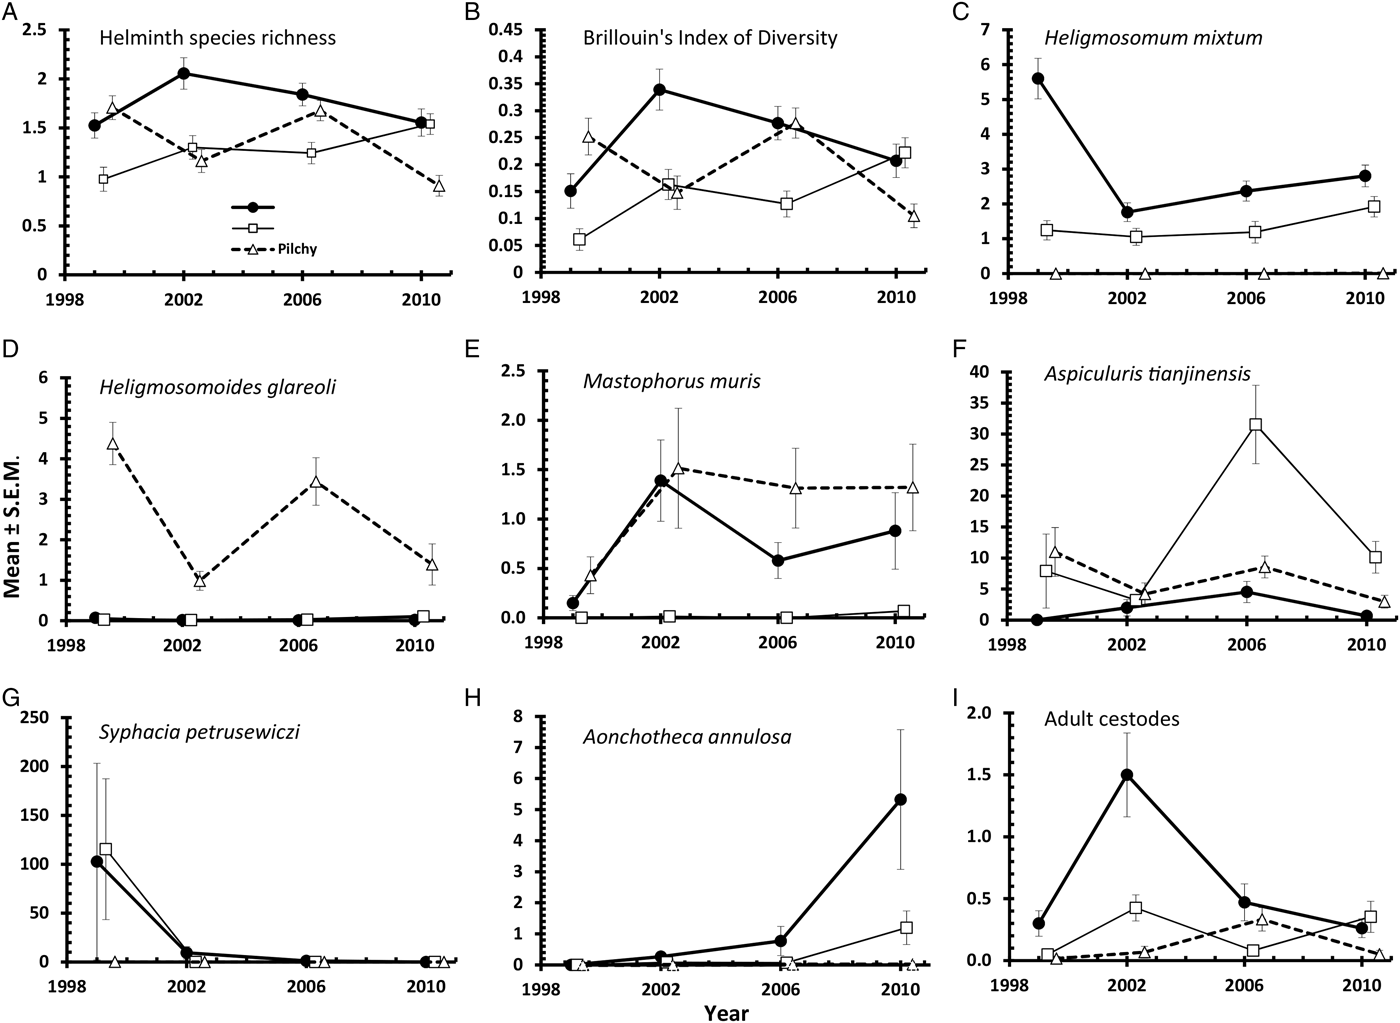
The overall mean species richness (MSR) was 1·47 ± 0·037. There was a weak main effect of YEAR (Table 3; DEV 3 = −7·8, P = 0·05) with MSR increasing over the first three surveys and then falling in 2010. There was more substantial variation between species richness of voles from the three sites, (Table 3; main effect of SITE, DEV 2 = −24·0, P < 0·0001) with relative rank order changing significantly over time (Fig. 3A; 2-way interaction YEAR × SITE, DEV 6 = −42·0, P < 0·0001). Thus, although MSR was highest at Urwitałt overall (notably in 2002, 2006 and 2010), in 1999 it was slightly higher for voles from Pilchy, and whilst at Urwitałt MSR declined from 2002 onwards, in Tałty MSR increased with time to peak in 2010.

Fig. 3. Spatiotemporal dynamics in mean helminth species richness (A), Brillouin's Index of Diversity (B) and abundance of H.mixtum (C), H. glareoli (D), M. muris (E), A. tianjinensis (F), S. petrusewiczi (G), A. annulosa (H) and adult intestinal stages of cestodes (I). Key to symbols used as shown in panel A.
MSR was significantly higher among female voles (Table 3, DEV 1 = −4·95, P = 0·03). MSR also increased significantly with vole age (Table 3; main effect of AGE, DEV 2 = −7·04, P = 0·03) at all sites, although in voles at Urwitałt, after a moderate increase between age classes 1 and 2 MSR increased more markedly between age classes 2 and 3. In contrast accumulation of helminth species was more steady across all age classes at both Pilchy and Tałty (Fig. 2B; 2-way interaction SITE × AGE, DEV 4 = −17·8, P = 0·0014).
Species diversity
Brillouin's index of diversity (BID) increased significantly with host age (Table 3; main effect of AGE, F 2,915 = 82·80, P < 0·0001), varied between years (Table 3; main effect of YEAR, F 3,916 = 4·92, P = 0·002) and between study sites (Table 3; main effect of SITE, F 2,915 = 7·08, P < 0·001) but there was no significant difference between the sexes.
However, these main effects were confounded by three significant 2–way interactions. The most significant was between YEAR and SITE (F 6,905 = 8·57, P < 0·0001) accounting for 5·4% of explained deviance (Table 4). In the first three surveys (1999, 2002 and 2006) BID was higher in Urwitałt compared with Tałty, but in the last survey (2010) it was marginally higher at Tałty (Fig. 3B). Voles from Pilchy showed no consistent trends in BID over the four surveys with a higher value than at the other sites in 1999, equal with Urwitałt in 2006, but lower than at Urwitałt and Tałty in 2002 and 2010.
Table 4. Percentage of variation in data (deviance) explained by extrinsic and intrinsic factors affecting the measures of infracommunity structure and diversity, and the abundance of helminths

In each case the output from the most parsimonious and appropriate minimum sufficient model is given. Thus, only the significant main effects and interactions, and non-significant main effects if a component of one of the interactions, have been included. Models for total helminth burden and individual species are models with negative binomial error structures unless stated otherwise below. For further details of the statistical models, see the text. Note that some 2–way and 3–way interactions and the 4–way interaction are not given because these were not significant.
Factors and interactions accounting for most deviance in each case are highlighted in bold.
a Mean species richness (model based on Poisson errors).
b Brillouin's index of diversity (model based on Gaussian errors).
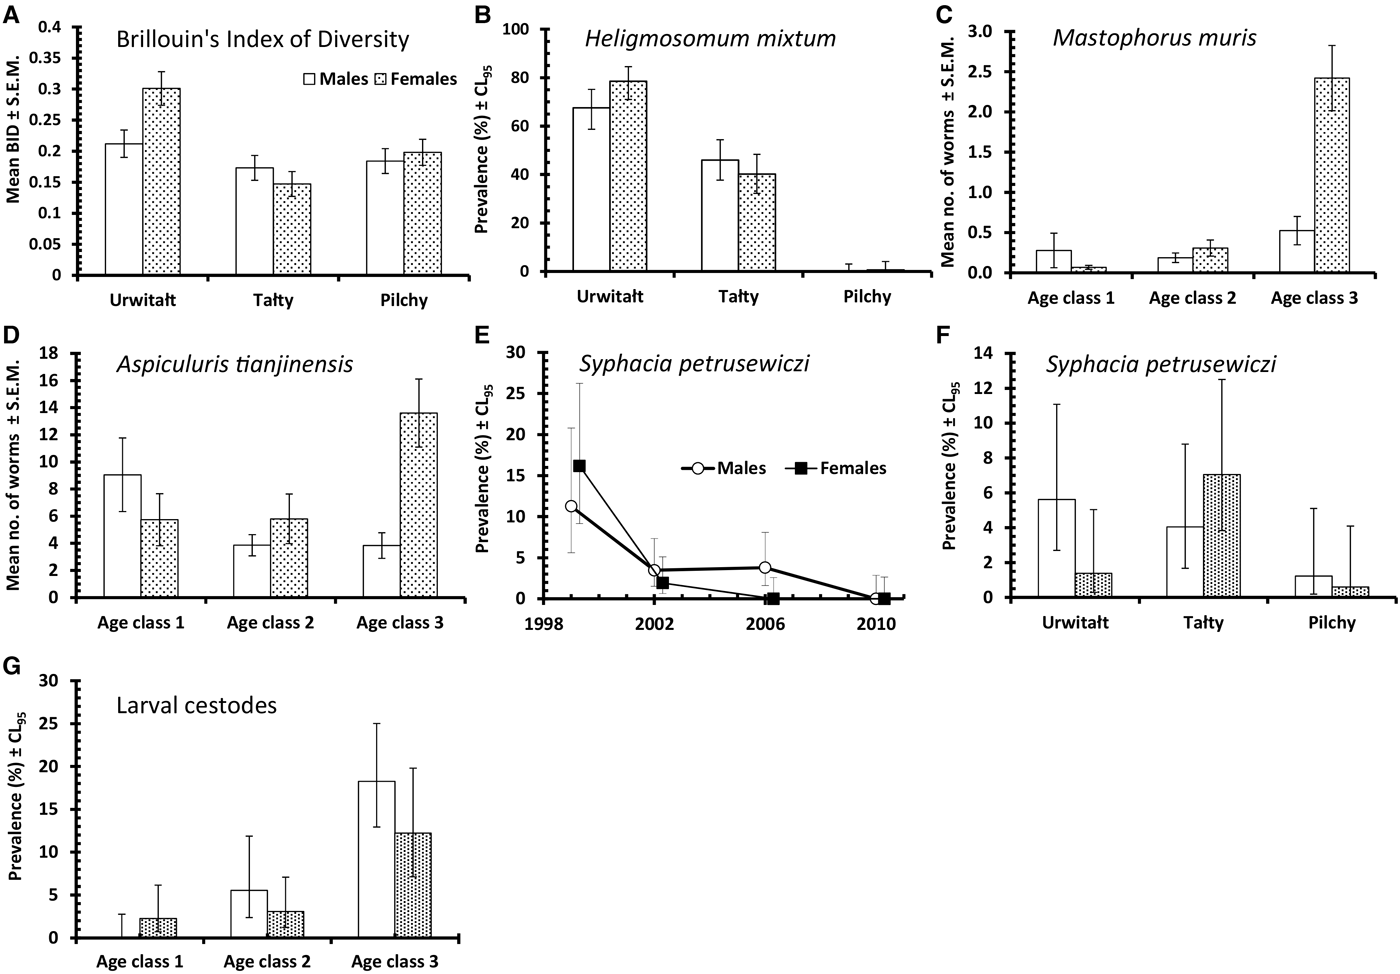
Although in each year of the study BID increased with increasing host age, the extent of these age related changes varied significantly between years (Fig. 2C; 2–way interaction YEAR × AGE, F 6,905 = 2·66, P = 0·014). There was no overall effect of host sex on BID (Table 3), however, at Uwitałt, and to a lesser extent at Pilchy, mean BID was higher among female voles, while at Tałty mean BID was higher among male voles (Fig. 4A; 2-way interaction SITE × SEX, F 2,901 = 4·03, P < 0·0001).
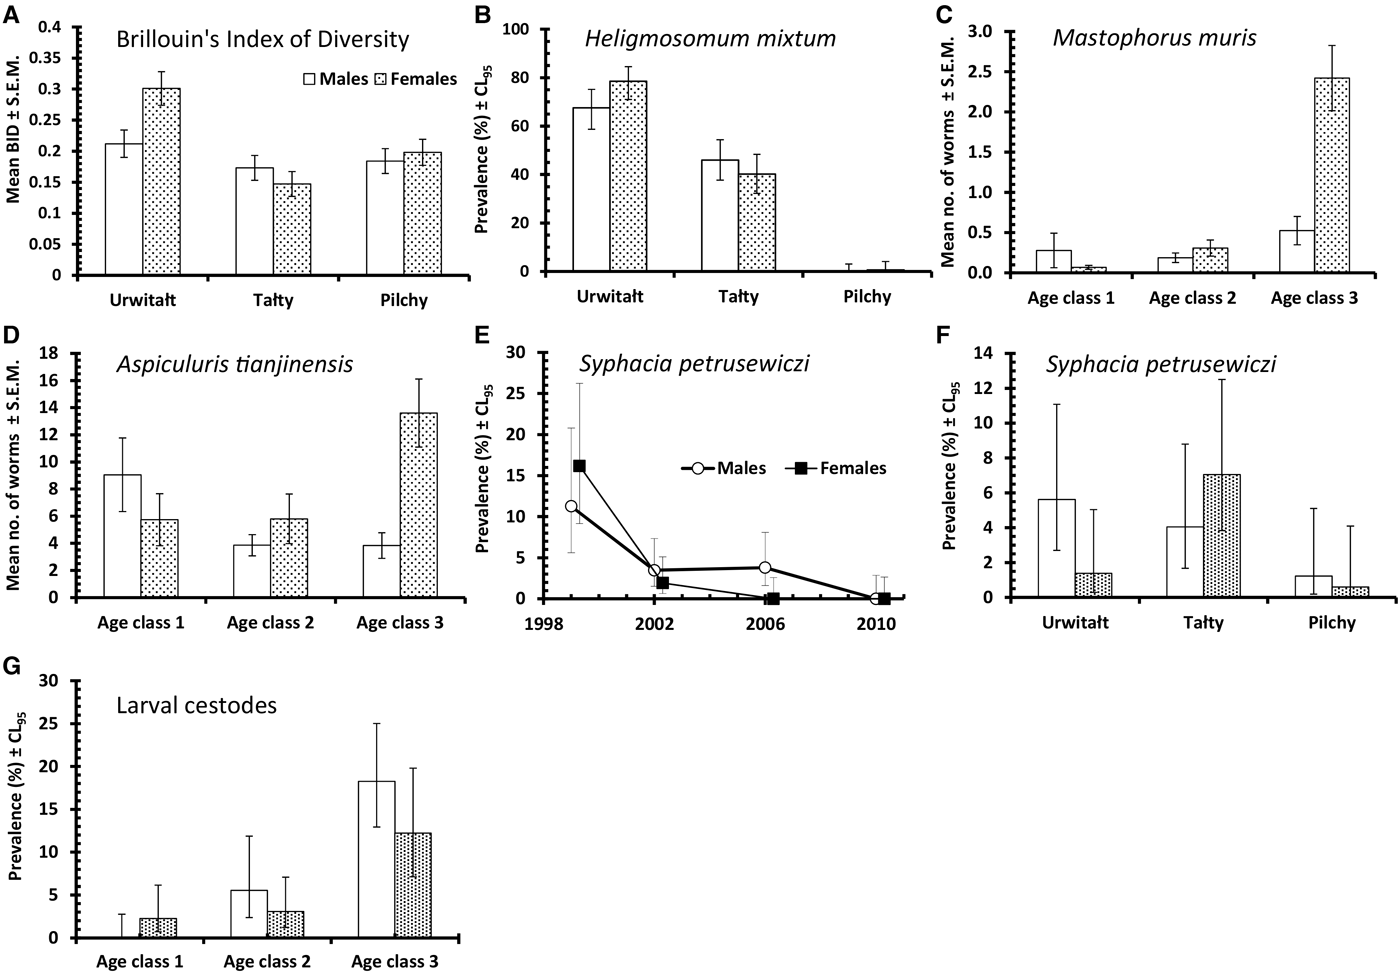
Fig. 4. Variation in host sex bias of Brillouin's Index of Diversity at the three study sites (A), in prevalence of H. mixtum at the three study sites (B), in abundance of M. muris by age class (C), in abundance of A. tianjinensis by age class (D), in prevalence of S. petrusewiczi by year of survey (E) and site (F), and in prevalence of larval cestodes (all species combined) (G). Key to symbols used in panels B, C, D, F and G, as in A.
Frequency distributions and measures of aggregation
Frequency distributions were fitted to all species for which quantitative data were available, by site, by year and in relevant combinations. These were then tested for goodness of fit to the Poisson and to the positive and negative binomial distributions. For brevity we do not report these values, but as will be made clear below, all parasite burdens were over-dispersed and conformed best to the negative binomial distribution. Some were so aggregated that even GLM with negative binomial error structures failed to converge. All values are available from the authors on request.
Prevalence and abundance of nematodes
A total of 77% (73·3–80·36) of the bank voles were infected with nematodes, and as with the prevalence of all helminths combined the values for the prevalence of nematodes were consistently high throughout (exceeding 70% in all surveys, Table 2). The rank order of prevalence among voles at the three sites changed significantly over time (Fig. 1C; YEAR × SITE × INFECTION, χ6 2 = 29·6, P < 0·001) although there was no independent effect of either YEAR or SITE. Prevalence did not vary significantly between the sexes (Table 2) but there was a highly significant increase in prevalence with increasing age of voles (Table 2; AGE × INFECTION, χ2 2 = 103·2, P < 0·001) that was evident in each of the four surveys (Fig. 2D) with values ⩾88% in the oldest class throughout.
The abundance of nematodes (all species combined) was analysed as above for all helminths, with outcome much the same. In addition to the significant main effects of YEAR (Table 3; LR 3,914 = 175.1, P < 0.0001) and SITE (LR 2,914 = 44.7, P < 0.0001) and the interaction between these (Fig. 1D; LR 6,904 = 50.6, P < 0.0001), and the main effect of AGE (Table 3; LR 2,914 = 78.0, P < 0.0001), in this case there was also a significant interaction between SITE and AGE (LR 4,904 = 24.9, P < 0.0001) which is illustrated in Fig. 2E. In Urwitałt and Pilchy mean nematode worm burden increased with age, but at Tałty the highest abundance was found in bank voles of age class 2, with a subsequent reduction among the oldest animals. Abundance did not vary significantly between the sexes.
Heligmosomum mixtum
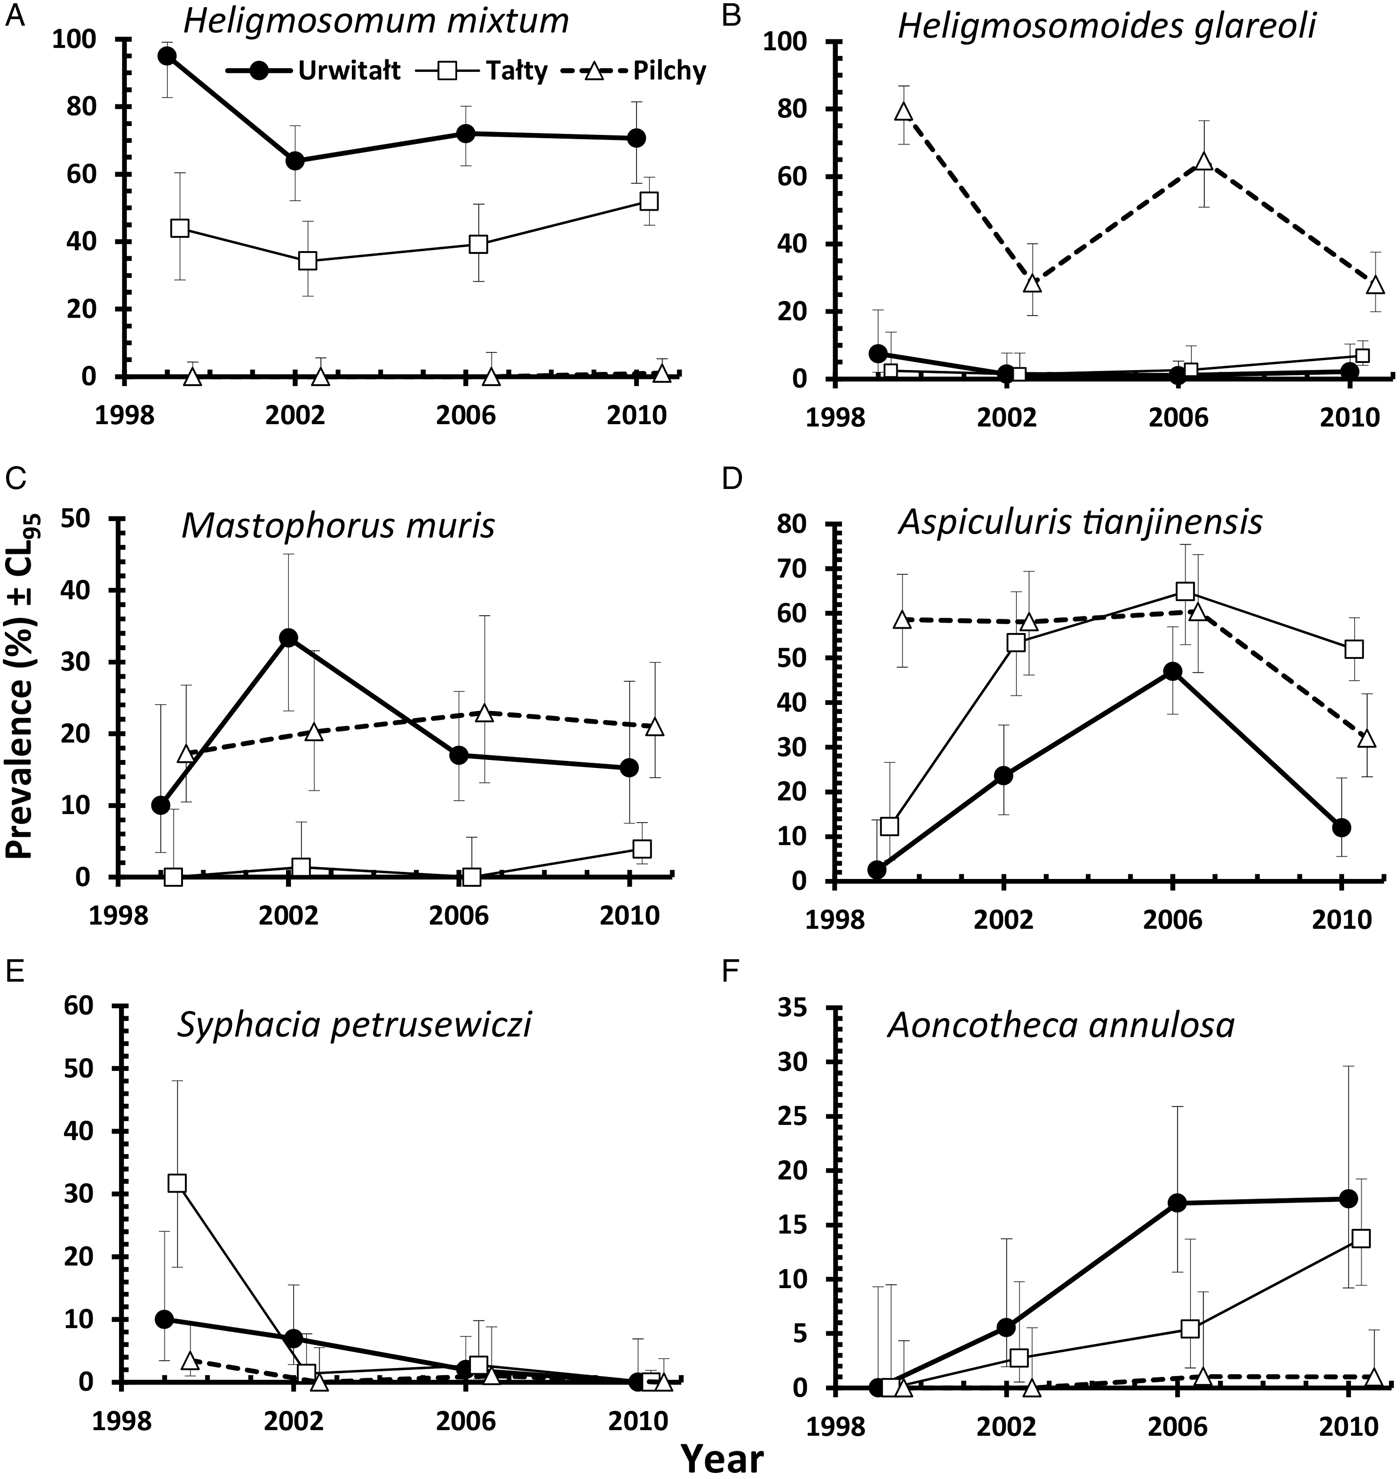
This species was recovered from 347 bank voles (37·6% [33·62–41·81]), but was largely found in voles at two of the three sites (Urwitałt and Tałty; Table 5 and Fig. 5A). Although there was no independent effect of host sex, prevalence being almost identical in both sexes, there was a significant interaction with site of capture (SITE × SEX × INFECTION, χ2 2 = 7·1, P = 0·029). Prevalence was higher in female voles from Urwitałt and in males at Tałty (Fig. 4B). Since there was no overall effect of host sex and a weak interaction of SEX with SITE, we next fitted post hoc a model without SEX. This gave a highly significant effect of SITE (Table 5; χ2 2 = 453·7, P < 0·001). Prevalence of H. mixtum also varied significantly between years (Table 5; YEAR × INFECTION, χ3 2 = 10·76, P = 0·013) but the range of variation was narrow, just 8% (from 32·4% in 2002 to 40·5% in 2010). There was also a highly significant independent effect of host age (AGE × INFECTION, χ2 2 = 57·0, P < 0·001), prevalence increasing with host age (Table 5).
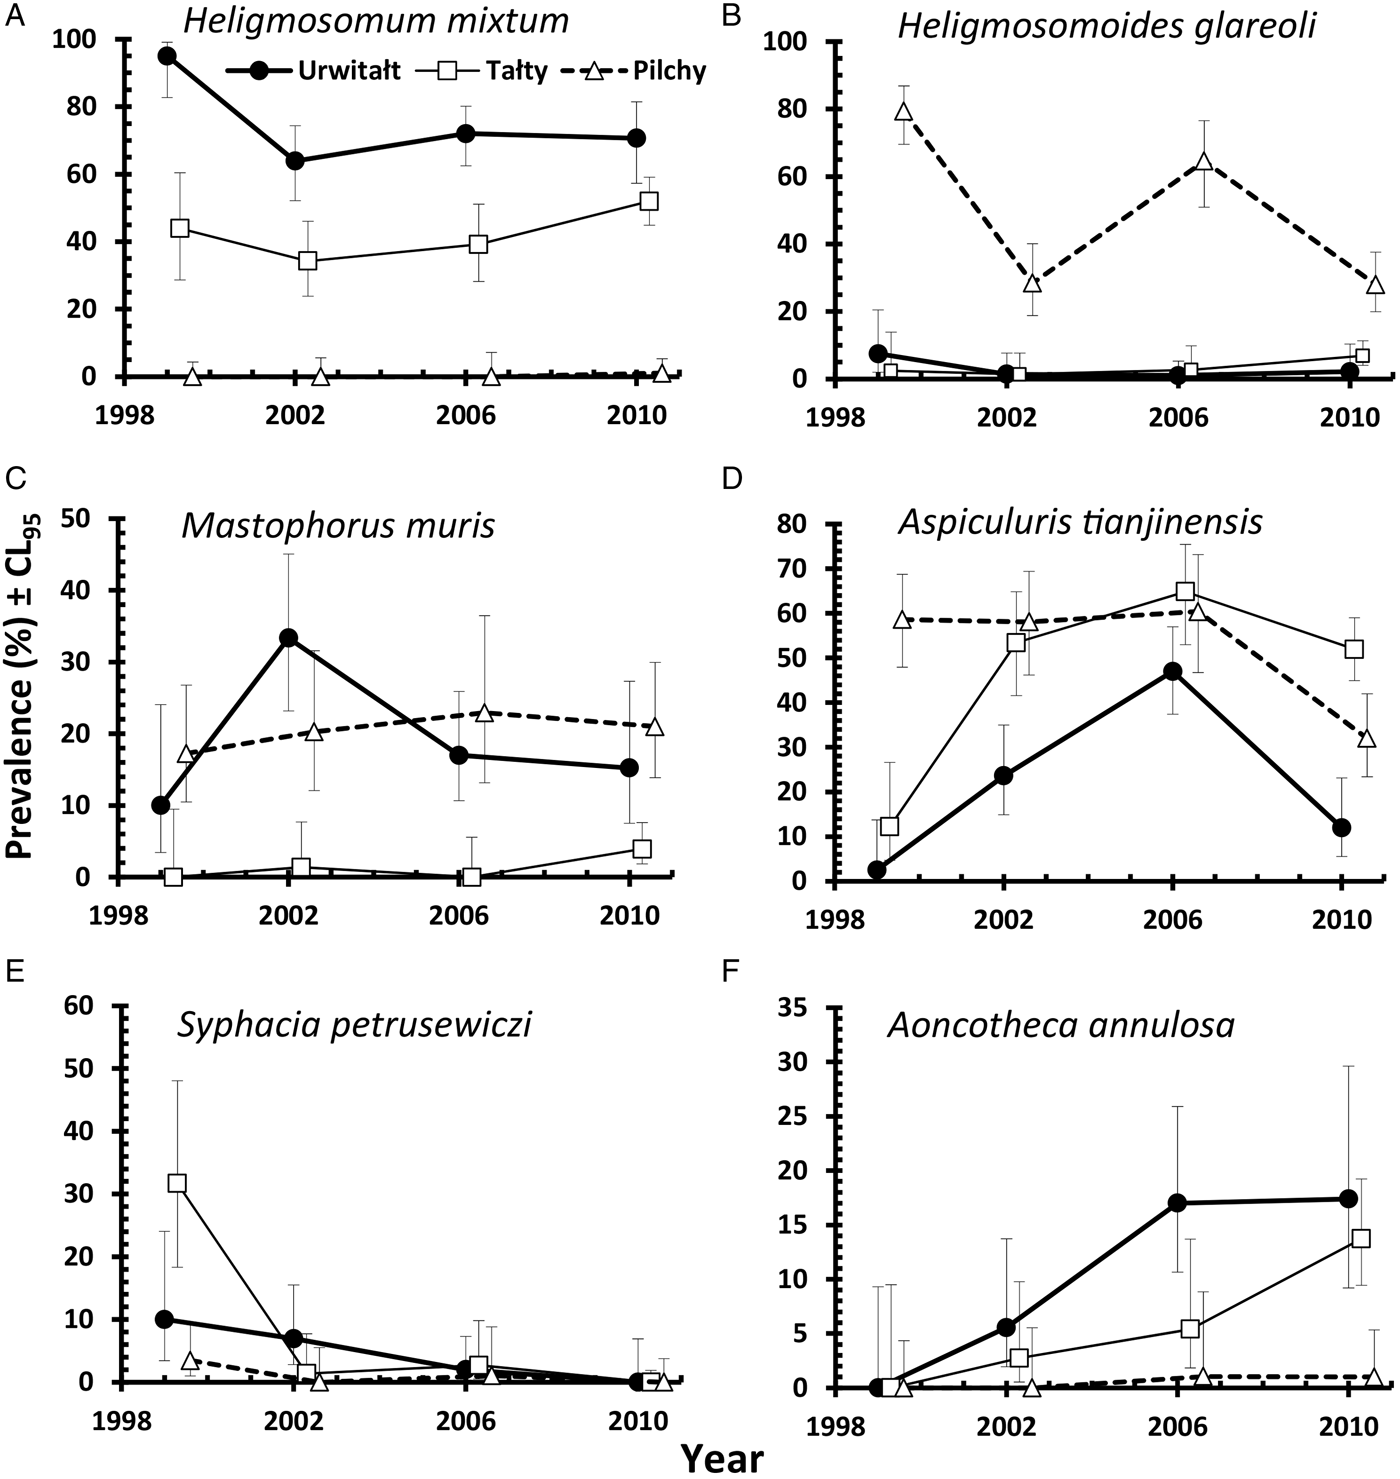
Fig. 5. Spatiotemporal dynamics in prevalence of individual species; H. mixtum (A), H. glareoli (B), M. muris (C), A. tianjinensis (D), S. petrusewiczi (E), A. annulosa (F). Key to symbols used as shown in panel A.
Table 5. Prevalence of individual species by year, site, host sex and age class

See text for statistical analysis.
The overall abundance of H. mixtum was 1·4 ± 0·084 worms/vole, but there was a marked difference between sites (Table 6; GLM with negative binomial errors, main effect of SITE, LR 2,914 = 455·0, P < 0·0001), with just one worm recovered from a vole from Pilchy in the entire period and the majority of worms from Urwitałt. There was also a highly significant effect of YEAR (Table 6; LR 3,914 = 26·8, P < 0·0001), and a 2-way interaction (YEAR × SITE, LR 6,902 = 14·2, P = 0·027) which is shown in Fig. 3C. The rank order of abundance was maintained across all four surveys but the differences between sites were most marked in 1999. Abundance of this species also increased with vole age (Table 6; LR 2,914 = 55·4, P < 0·0001), and while overall there was a similar age-related pattern in all four surveys, there were also significant discrepancies between age classes in successive surveys as shown in Fig. 2F (2–way interaction YEAR × AGE, LR 6, 902 = 17·7, P = 0·007). There was no significant difference in abundance of H. mixtum between male and female voles.
Table 6. Abundance of individual species by year, site, sex and age class

See text for statistical analysis.
Heligmosomoides glareoli
The prevalence of H. glareoli was 19·0% (15·90–22·48) overall, but there was a marked discrepancy between sites (Table 5). Prevalence was markedly higher in voles at Pilchy compared with the other two sites although the extent of the difference varied between the surveys (Fig. 5B; YEAR × SITE × INFECTION, χ6 2 = 17·8, P = 0·007). Confining the analysis post hoc to bank voles from Pilchy revealed a highly significant effect of YEAR (χ2 2 = 39·9, P < 0·001), but prevalence did not vary with host sex or age classes. There was also a weaker YEAR × SEX × AGE × INFECTION interaction (χ6 2 = 12·8, P = 0·047), which we did not explore further.
The overall mean abundance of H. glareoli was 0·9 ± 0·10 worms/vole, but very few worms were found among voles from Urwitałt and Tałty (Table 6). This parasite was mostly encountered in Pilchy (GLM with negative binomial errors, main effect of SITE LR 2,914 = 315·2, P < 0·0001), where the mean abundance across all four surveys was 2·4 ± 0·26. There was also a significant main effect of YEAR (LR 3,914 = 42·0, P < 0·0001) and a 2-way interaction between YEAR and SITE (LR 6,902 = 15·4, P = 0·018) as illustrated in Fig. 3D; worm burdens were very low and changed little in Urwitałt and Tałty, but were much higher at Pilchy, with two high abundance years and two relatively low abundance years. There was no significant difference in abundance between the sexes in the entire dataset (Table 6), or when confined to Pilchy alone (main effect of SEX, LR 1,321 = 0·5, P = NS; males = 2·1 ± 0·263, females = 2·7 ± 0·457). Abundance increased significantly with increasing age (Table 6; main effect of AGE, LR 2,914, = 29·7, P < 0·0001), and even more markedly when confined to the voles from Pilchy (1·7 ± 0·25, 2·0 ± 0·37, 3·6 ± 0·65, for age classes 1–3, respectively; LR 2,322 = 28·0, P < 0·0001). However, in the full dataset there was a significant interaction between YEAR and AGE (LR 6,902 = 21·2, P = 0·002), indicating that the pattern of the age-related changes in abundance varied between years. This remained significant when just confined to voles from Pilchy (LR 6,316 = 26·6, P < 0·0001; Fig. 2G). It can be seen that in 1999, abundance declined with increasing vole age at Pilchy, while in the remaining years it increased, as in the overall dataset (Table 6).
Mastophorus muris
The overall prevalence of M. muris was 14·3% (11·59–17·52). This species was more common in bank voles from Urwitałt and Pilchy than Tałty (Table 5), but over time prevalence varied differently between sites (Fig. 5C; YEAR × SITE × INFECTION, χ6 2 = 12·7, P = 0·048). Prevalence was most stable at Pilchy and somewhat more variable at Urwitałt. There was also a highly significant increase in prevalence with host age (Table 5; AGE × INFECTION, χ2 2 = 59·0, P < 0·001) and a discrepancy between the sexes, with prevalence in female bank voles being 2·3-fold higher than in males (Table 5; SEX × INFECTION, χ1 2 = 17·8, P < 0·001).
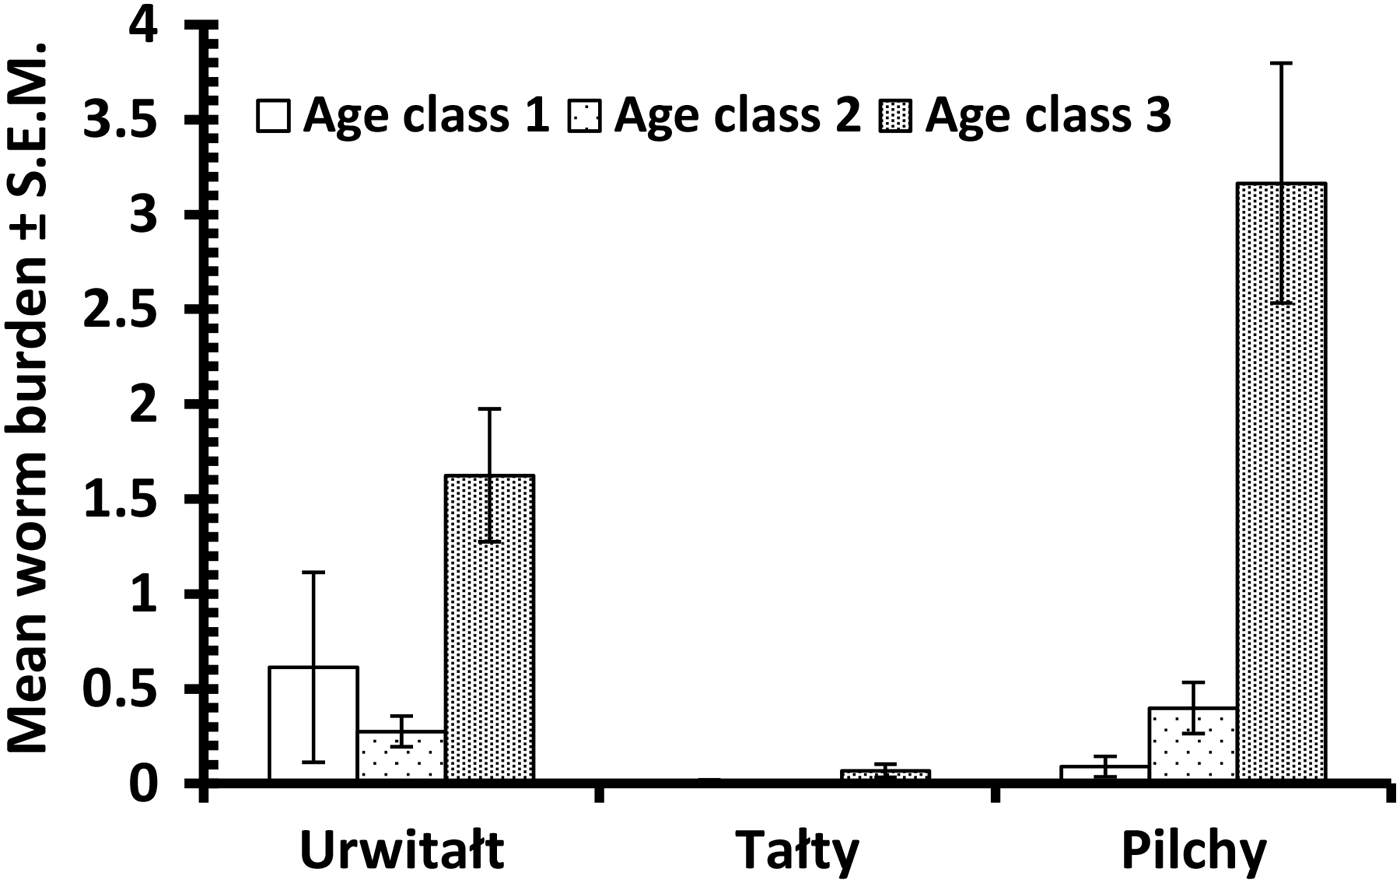
Mastophorus muris was less abundant than the species considered above (overall abundance = 0·70 ± 0·099), but there was a marked difference in abundance between sites (Table 6; GLM with negative binomial errors, main effect of SITE, LR 2,913 = 84·9, P < 0·0001) with abundance much lower at Tałty. Moreover, the extent of this difference between sites varied significantly between surveys (Fig. 3E; 2–way interaction, SITE × YEAR, LR 6,901 = 13·4, P = 0·038; main effect of YEAR, LR 3,913 = 11·1, P = 0·011, Table 6). Overall, abundance increased with host age (Table 6; main effect of AGE, LR 2,913 = 44·0, P < 0·0001) but this age related increase was most apparent among voles from Pilchy (Fig. 6; 2–way interaction, AGE × SITE, LR 4,901 = 18·0, P = 0·0012), although in all three sites, despite the differences in overall abundance, age class 3 voles showed the highest abundance. Female bank voles showed a higher abundance than males (Table 6; main effect of SEX, LR 1,913 = 4·42, P = 0·036), especially in age class 3 voles, but not in the youngest animals (Fig. 4C; 2–way interaction, AGE × SEX, LR 2,9101 = 14·2, P = 0·0008).

Fig. 6. Age-related changes in abundance of M. muris by site.
Aspiculuris tianjinensis
This was the most common nematode with an overall prevalence of 42·1% (37·98–46·27) and it was twice as common at Tałty and Pilchy compared with Urwitałt (Table 5). There were marked changes in prevalence between the surveys, but their magnitude varied between sites (Fig. 5D; YEAR × SITE × INFECTION, χ6 2 = 49·3, P < 0·001). Whilst at Pilchy prevalence varied very little in the first three surveys (58·1–60·4%) before falling by about 50% in 2010, at both Urwitałt and Tałty prevalence increased in the first three surveys before the dip at both sites in 2010. Prevalence also increased consistently with increasing host age (Table 5; AGE × INFECTION, χ2 2 = 63·6, P < 0·001) and this was consistent in three of the four surveys but not in 1999, when there was essentially no age–related effect on prevalence (Fig. 2H). There was no significant difference in prevalence between the sexes (Table 5).
Aspiculuris tianjinensis was also the most abundant intestinal nematode (mean worm burden = 7·2 ± 0·81). Overall abundance was highest in voles from Tałty (Table 6; GLM with negative binomial errors, main effect of SITE, LR 2,913 = 73·0, P < 0·0001), but this was confounded by significant variation between years (Table 6; main effect of YEAR, LR 3,913 = 42·7, P < 0·0001) and the interaction between these factors (Fig. 3F; YEAR × SITE, LR 6,905 = 55·6, P < 0·0001). Abundance was consistently lower throughout among voles from Urwitałt, not exceeding 4·5 worms recovered in 2006, but among voles from Tałty there was a marked peak of abundance in 2006 with a mean of 31·5, even though in earlier years abundance had been moderate and similar to that at the other two sites (Fig. 3F). On average the abundance of A. tianjinensis was almost twice as high among female compared with male voles (Table 6; main effect of SEX, LR 1,913 = 6·5, P = 0·01), but this was confounded by a significant interaction with host age (SEX × AGE, LR 2,905 = 21·6, P < 0·0001). Figure 4D shows that among male voles, abundance was highest in the youngest animals and then declined, but among female voles it rose with host age to peak among the oldest age class.
Syphacia petrusewiczi
This species had an overall prevalence of 3·3% (2·02–5·08), but showed a marked reduction in prevalence across the four surveys with no parasites at all recovered from 294 bank voles in 2010 (Table 5). Figure 5E shows that prevalence dropped in all three sites with time and despite the originally higher prevalence at Tałty in 1999, there was no significant YEAR × SITE × INFECTION interaction. However, the fall in prevalence with successive surveys differed between the sexes (Fig. 4E; YEAR × SEX × INFECTION, χ3 2 = 7·87, P = 0·049) with a lower prevalence initially in males but a slower fall over time. The directions of the sex- and age-effects on prevalence also differed significantly between sites with higher prevalence in females at Tałty but not at the other two sites (Fig. 4F; SITE × SEX × INFECTION, χ2 2 = 7·61, P = 0·022), and peaking in age class 2 voles in two sites but not at Urwitałt (Fig. 2I; SITE × AGE × INFECTION, χ4 2 = 13·4, P = 0·01).
With so few infected bank voles (n = 30) statistical analysis of the abundance of S. petrusewiczi could not be carried out reliably with any of the transformations attempted (negative binominal errors, log-transformed, Box-Cox transformed or models with only main effects, none converged). Therefore, non-parametric tests were used. Abundance dropped markedly in all sites as the study progressed (Table 6; Kruskal–Wallis test, effect of YEAR, χ3 2 = 59·83, P < 0·0001) with complete loss of this species by 2010. There were also significant differences in abundance between sites (Table 6). Syphacia petrusewiczi was found both in Urwitałt and Tałty but very rarely in Pilchy (Kruskal–Wallis test, χ2 2 = 10·58, P = 0·005), even in the early years when the species was still present in these study sites. Abundance did not differ significantly between sexes (Table 6) and age classes.
Aonchotheca annulosa
The overall prevalence of this species was 6·4% (4·58–8·78). There was a highly significant difference in prevalence among voles from the three sites (Table 5; SITE × INFECTION, χ2 2 = 47·1, P < 0·0001). The relative ranking of sites was consistent throughout (highest prevalence at Urwitałt, intermediate at Tałty and lowest at Pilchy in all years; Fig. 5F), despite the rise of prevalence at all three sites with successive surveys (Table 5; YEAR × INFECTION, χ3 2 = 32·8, P < 0·0001). Prevalence also increased significantly with host age (Table 5; AGE × INFECTION, χ2 2 = 40·9, P < 0·0001) and was female biased (Table 5; SEX × INFECTION, χ1 2 = 12·3, P < 0·0001).
Quantitative analysis of abundance of A. annulosa was problematic since only 59 voles were infected. No interactions proved significant and models with the four main effects only, failed to converge. Analysis was conducted therefore on two separate models with negative binomial errors (model 1, year + age + sex; model 2, site + sex + age). Abundance changed significantly with successive surveys (Table 6; model 1, main effect of YEAR, LR 3 = 37·3, P < 0·0001) and there was a significant difference in abundance among voles from the three different sites (Table 6; model 2, main effect of SITE, LR 2 = 47·6, P < 0·0001), with bank voles from Urwitałt showing higher abundance than those from Tałty and Pilchy. Abundance also increased with host age (Table 6; model 1 main effect of AGE, LR 2 = 49·5, P < 0·0001; model 2 LR 2 = 57·6, P < 0·0001) and differed between the sexes (Table 6; model 1 main effect of SEX, LR 1 = 21·7, P < 0·0001) with female voles carrying a mean worm burden 18·7 times heavier than that of males.
Trichuris arvicolae
Trichuris arvicolae was only recovered from four age class 3 female voles, all from Pilchy. One infected vole was from 1999 and three from 2010. Two of the animals with T. arvicolae in 2010 carried two worms each and the other two only had a single worm. These data were not analysed further.
Prevalence and abundance of cestodes
Prevalence of cestodes was 20·6% (17·37–24·21) overall (intestinal dwelling adults + larvae combined), highest among voles from Urwitałt in all four surveys and lower at the other two sites, with significant spatiotemporal variation as illustrated in Fig. 1E (YEAR × SITE × INFECTION, χ6 2 = 25·6, P < 0·0001). Prevalence was higher among male bank voles (Table 2; SEX × INFECTION, χ1 2 = 4·75, P = 0·029) and increased significantly with host age (Table 2; AGE × INFECTION, χ2 2 = 50·4, P < 0·0001).
Analysis of abundance was problematic and could only be carried out using non-parametric tests. Overall abundance was 5·2 ± 1·39 worms/vole but this varied between surveys (Table 3; Kruskal–Wallis test, χ3 2 = 20·11, P < 0·0001) increasing by 6·3-fold between 1999 and 2010. Cestodes were more abundant in bank voles from Tałty and Urwitałt than from Pilchy (Kruskal–Wallis test, χ2 2 = 59·06, P < 0·0001); abundance in Tałty being 6·3 times higher than in Pilchy (Table 3). Abundance increased significantly with host age (Kruskal–Wallis test, χ2 2 = 53·75, P < 0·0001) with much higher abundance among the oldest animals compared with both younger classes (Table 3), but did not differ significantly between the sexes.
Prevalence and abundance of adult cestodes
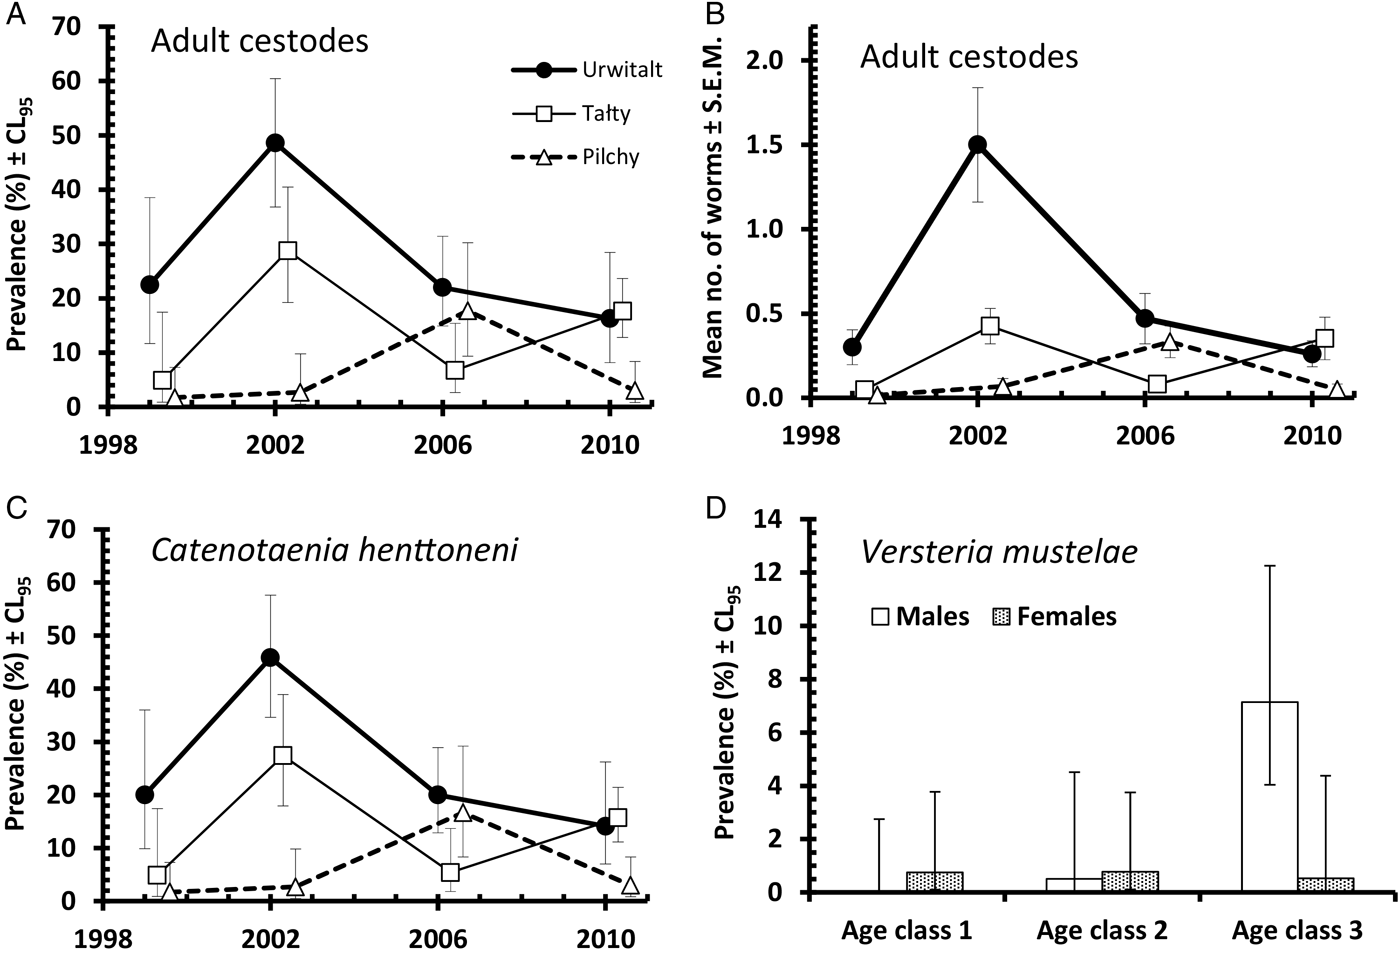
Prevalence of intestinal-dwelling adult stages of cestodes, whether mature or not fecund, was 16·3% (13·36–19·61). Summary data for prevalence by each of the four main effects is shown in Table 2. Prevalence was relatively high in 2002, when most of the infected voles were from Urwitałt. Prevalence increased with host age and there appeared to be bias in favour of higher prevalence among male voles. These effects could not be evaluated statistically in a full factorial model, because of complex interactions which could not be broken down further (YEAR × SITE × SEX × INFECTION, χ6 2 = 15·3, P = 0·018 and SITE × SEX × AGE × INFECTION, χ4 2 = 11·9, P = 0·018). However, analysis by 1-way χ2-tests showed that there were highly significant effects of YEAR (χ3 2 = 25·4), SITE (χ2 2 = 46·2), and AGE (χ2 2 = 30·2, P < 0.001 in all cases) and a weaker effect of SEX (χ2 1 = 4.14, P = 0.042). Figure 7A illustrates the spatiotemporal dynamics: prevalence was highest at Urwitałt and lowest at Pilchy in three of the four surveys. Peak prevalence occurred among voles from Urwitałt in 2002.

Fig. 7. Spatiotemporal dynamics in prevalence of adult intestinal cestodes (A); abundance of intestine dwelling adult cestodes (B); prevalence of C. henttoneni (C); sex bias among age classes in prevalence of V. mustelae (D). Key to symbols used in B and C, as in A.
Abundance was low with an overall mean of 0·34 ± 0·040. Mean abundances for all four main effects are shown in Table 3. Attempts at analyses by GLM failed to converge so we used non-parametric tests. Over time, changes in abundance showed a very similar pattern to those for prevalence (Fig. 7B; YEAR χ3 2 = 28·0, P < 0·001), which is not unexpected given that the mean worm burden was less than one, and that 95 out of the 150 voles infected with adult tapeworms carried just one adult worm. All the remaining main effects were significant (for SEX, U = 100,810, P = 0·037 [bias in favour of males]; SITE χ2 2 = 45·5, P < 0·001 [most abundant at Urwitałt and least at Pilchy]; AGE χ2 2 = 32·1, P < 0·001 [most abundant in age class 3 voles and least in age class 1]).
Prevalence and abundance of individual adult cestode species
Of the three species of adult cestodes identified in this study only one, Catenotaenia henttoneni, was present in sufficient numbers to merit statistical analysis. In total 138 bank voles harboured C. henttoneni with an overall prevalence of 15·0% (12·18–18·18). As with the analysis of all adult cestodes, backward selection of full factorial models gave two complex interactions (YEAR × SITE × SEX × INFECTION, χ6 2 = 14·5, P = 0·024 and SITE × SEX × AGE × INFECTION, χ4 2 = 11·0, P = 0·026) that could not be broken down further. Prevalence values for all four main effects are shown in Table 4. This species was most prevalent in Urwitałt and in Tałty (Table 5), showing the highest prevalence at Urwitałt in three of the four surveys (Fig. 7C). At Pilchy this species remained relatively rare. Although overall a higher percentage of male voles were infected compared with females, there was no consistency with sex bias changing between the sexes in particular years and sites. For example, in 2002, prevalence among male bank voles in Urwitałt was higher than among females (males = 55·0% [38·70–70·09], females = 34·4% [21·83–48·80]), whereas in Tałty it was in the opposite direction (males = 25·6% [13·99–41·51], females = 29·4% [17·70–44·24]). Similarly, although overall prevalence values increased with host age (Table 5), the age effect was not consistent in both sexes and at all three sites. Males at all three sites showed increasing prevalence with host age, but among female voles only those from Pilchy followed the same pattern. Females from Urwitałt showed the lowest prevalence in age class 2, whilst in Tałty this was the age class with the highest prevalence (data not shown).
The mean abundance of C. henttoneni was 0·32 ± 0·039 worms/vole. Mean values for each of the four main effects are shown in Table 6 and since this was the dominant cestode in the intestine, the values are very similar to those for all adult intestinal cestodes combined (Table 3). As above there was a significant SITE × YEAR interaction (not shown; GLM with negative binomial errors, LR 6,907 = 35·7, P < 0·0001) and this followed a very similar pattern to that in Fig 7B for all intestinal adult cestodes combined. All main effects significantly affected abundance (YEAR, LR 3,913 = 26·7, P < 0·0001; SITE, LR 2,913 = 28·0, P < 0·0001; AGE, LR 2,913 = 29·5, P < 0·0001 and SEX LR 1,913 = 5·7, P = 0·017), but additional interactions could not be tested because more complex models failed to converge.
Other adult cestodes were rarer: Paranoplocephala omphalodes was present in the 1999, 2002 and 2010 surveys at Urwitałt and Pilchy only (prevalence, 1·3% (0·5–3·2) and 0·7% (0·2–2·2), respectively) and just one adult Arostrilepis horrida specimen was recovered during the whole study (from a female vole at Urwitałt in 2006). However infections with these adult cestodes were not analysed further because of their low prevalence and abundance.
Prevalence and abundance of larval stages of cestodes
Four species of larval cestodes were recovered from the bank voles, two from the peritoneal cavity (Mesocestoides sp. and Taenia martis) and two from the liver (Versteria mustelae and Cladotaenia globifera). The overall prevalence was 6·9% (5·03–9·38). Analysis of prevalence at this level showed that there was a highly significant difference between sites (Table 2; SITE × INFECTION, χ2 2 = 29·1, P < 0·001). Most infected voles came from Urwitałt, with prevalence being much lower among voles from the other two sites and little difference between the latter (Table 2). Prevalence also varied significantly between the successive surveys (Table 2; YEAR × INFECTION, χ3 2 = 15·5, P = 0·001) but there was no consistent trend with two peak years (2002 and 2010), and lower prevalence in the other years. Although prevalence increased with host age (Table 2), this was confounded by host sex (Fig. 4G; AGE × SEX × INFECTION, χ2 2 = 6·6, P = 0·037), because prevalence was higher in male compared with female voles among age classes 2 and 3, but not among the youngest animals in age class 1.
Analysis of abundance (Table 3) was not possible by GLM but non-parametric tests showed that the effects of SITE (χ2 2 = 30·2, P < 0·001 [most abundant in Tałty, least in Pilchy]), YEAR (χ3 2 = 14·9, P = 0·002 [most abundant in 2010, least in 1999]), and AGE (χ2 2 = 46·3, P < 0·001 [most abundant in age class 3 and least in age class 1]) were all significant. There was no significant difference in abundance between the sexes.
Prevalence and abundance of individual larval cestode species
Mesocestoides sp. was present in all surveys in all sites, except at Pilchy in 2006. The overall prevalence was 3·6% (2·29–5·47) and mean abundance was 4·2 ± 1·34. Prevalence was almost identical in the first three surveys, but much higher in 2010 (Table 5; YEAR × INFECTION, χ2 2 = 9·5, P = 0·023) and mean abundance (Table 6) likewise increased from 1999 to 2010. Mesocestoides sp. was most commonly encountered at Urwitałt (Table 5; SITE × INFECTION, χ2 2 = 18·0, P < 0·001), but abundance was numerically higher at Tałty (Table 6) and the parasite was largely confined to the oldest animals (Table 5; AGE × INFECTION, χ2 2 = 24·2, P < 0·001), which also showed the highest overall abundance of worms (Table 6). There was no significant difference in prevalence or abundance between the sexes.
Taenia martis was less common (2·1% [1·15–3·64]), with an overall mean abundance of 0·03 ± 0·009. It was found predominantly at Urwitałt (Table 5; SITE × INFECTION, χ2 2 = 21·1, P < 0·001 and for abundance see Table 6), and among the oldest voles (Table 5; AGE × INFECTION, χ2 2 = 13·1, P = 0·001 and for abundance see Table 6). Prevalence was highest in 2002 (Table 5; YEAR × INFECTION, χ3 2 = 11·8, P = 0·008).
Versteria mustelae (previously known as Taenia mustelae; Nakao et al. Reference Nakao, Lavikainen, Iwaki, Haukisalmi, Konyaev, Oku, Okamoto and Ito2013) was rarer still (overall prevalence = 1·4% [0·70–2·80] and abundance = 0·037 ± 0·016). In contrast to T. martis prevalence did not vary between sites (Table 5) although mean abundance was lower among voles from Urwitałt. However, there was a reduction in prevalence and abundance in the last two surveys (Table 5; YEAR × INFECTION, χ3 2 = 11·8, P = 0·008), and although prevalence appeared to increase with host age, this was confounded by an interaction with host sex (AGE × SEX × INFECTION, χ2 2 = 6·3, P = 0·043). As can be seen in Fig. 7D prevalence was very similar (<1%) in females in all age classes, but increased with age in males, exceeding 7% in age class 3 voles. Abundance also increased with host age (Table 6) but this was not tested because of the low prevalence, and as with prevalence the highest value for abundance was among age class 3 male voles (0·175 ± 0·093; in age class 3 females abundance = 0·005 ± 0·005).
Cladotaenia globifera was found in 2002 and 2010. It was present in one vole each from Urwitałt and Pilchy in 2002 and from Tałty in 2006, with an overall mean abundance of 0·60 ± 0·363, and the highest abundance value from a single vole from Pilchy (250 larvae).
Sources of variation in abundance data
The data in Table 4 show the percentage of deviance accounted for by each of the specific factors and their interactions, as fitted in minimal sufficient models in GLMs. For four of the six individual species in this analysis (M. muris, H. mixtum, H. glareoli and A. tianjinensis.) SITE was clearly the strongest source of deviance. For A. annulosa it was AGE, although SITE was of a similar magnitude and for C. henttoneni the interaction between SITE and YEAR accounted for the greatest percentage of deviance, but SITE, YEAR and AGE were all of a similar magnitude. For two measures, YEAR was the main source of deviance (total helminths and total nematodes) although in both cases AGE was second in importance. For BID, AGE clearly accounted for a substantial proportion of deviance but the interaction between SITE and YEAR was next in importance. For MSR the SITE × YEAR interaction was dominant and SITE was second in importance.
Canonical discriminant function (CDF) analysis
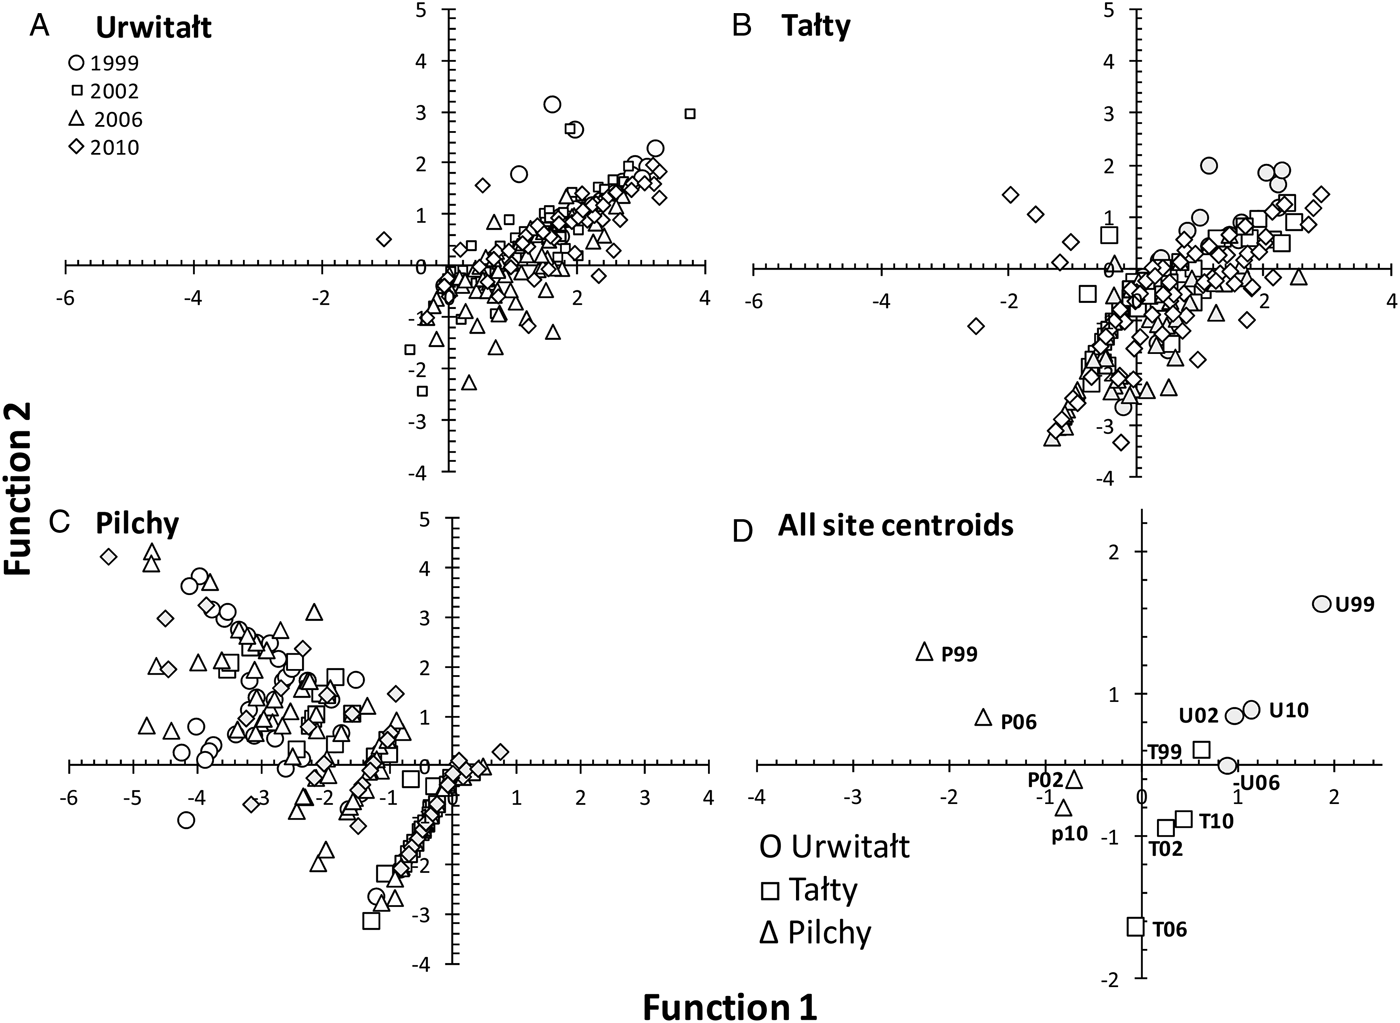
CDF analysis generated 11 axes that cumulatively accounted for 100% of the variance in the data. Axis 1 (Eigenvalue = 1·209) accounted for 57·8% of the variance and Axis 2 (Eigenvalue = 0·276) for a further 13·2%. Since together these two axes accounted for 71·0% of the variance the remaining axes were not examined further. Axis 1 (Fig. 8) essentially contrasts H. mixtum (0·64) with H. glareoli (−0·68), hence the scatter of data points from Urwitałt and Tałty towards the positive range of the Function 1 axis, and those from Pilchy in the negative range. There were additional positive but minor contributions to this axis from A. annulosa (0·15) and C. henttoneni (0·15) and negative from A. tianjinensis. (−0·22). Axis 2 contrasts H. glareoli (0·65) with A. tianjinensis (−0·53), with additional positive contributions from H. mixtum (0·36) and M. muris (0·22). Heligmosomoides glareoli was mostly found at Pilchy and M. muris at Pilchy and Urwitałt, while A. tianjinensis was most abundant in Tałty. Figure 8D shows that the centroids for Urwitałt are the four most positive on the Function 1 axis followed by those from Tałty in the centre and Pilchy the four most negative on this axis, so there was no overlap of centroids from the three sites along the Function 1 axis. This contrasts with extensive overlap on the vertical Function 2 axis for centroids from Urwitałt and Pilchy, and three of the lowest, most negative on this axis being those from Tałty.
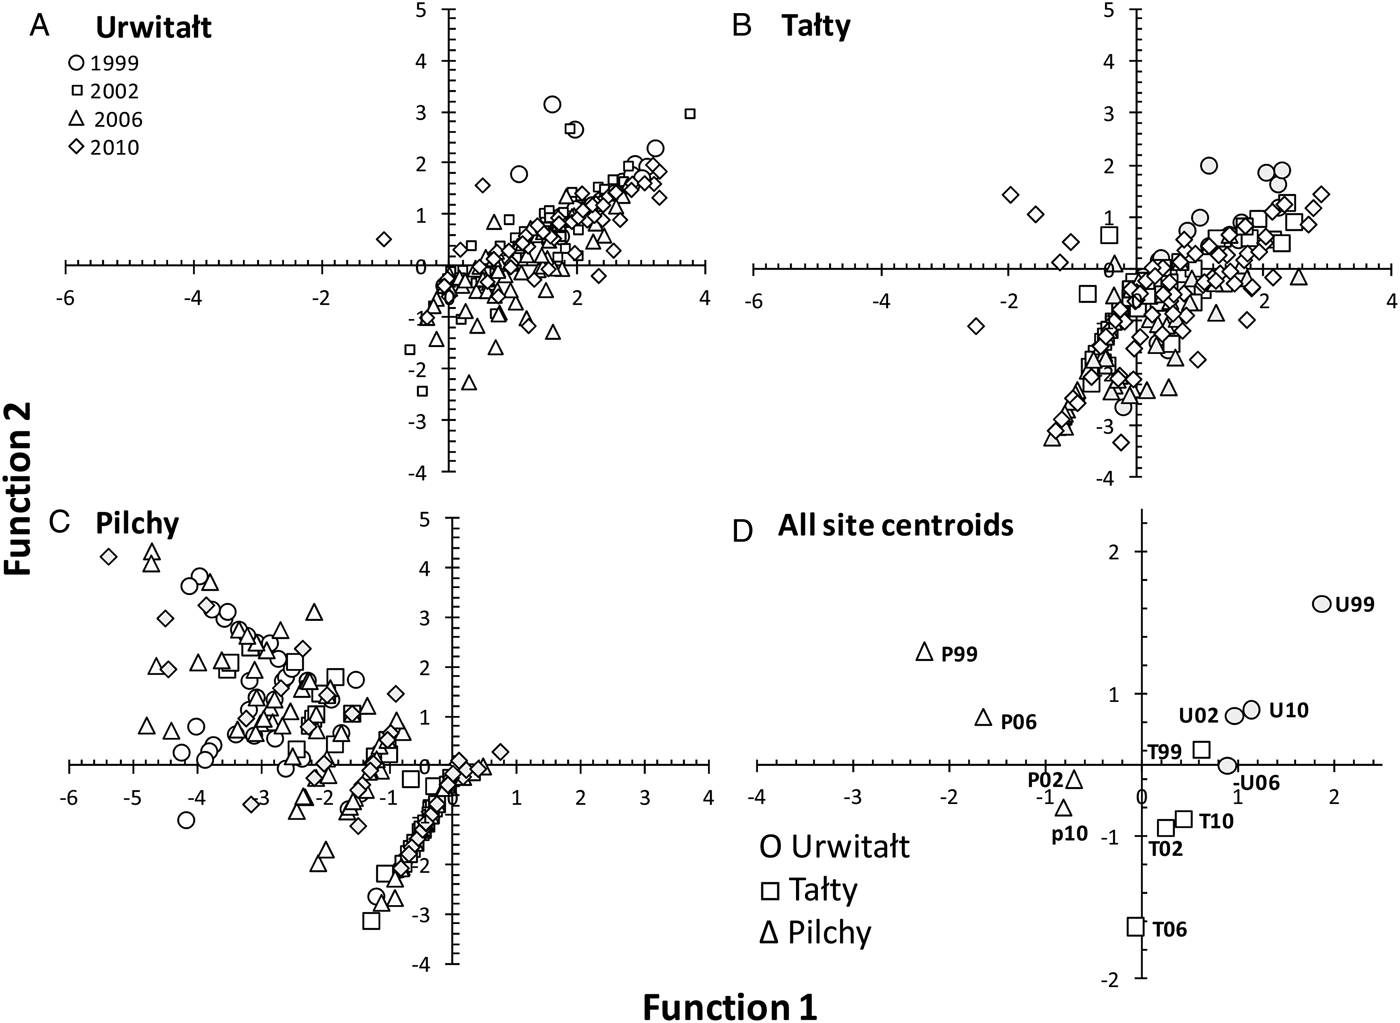
Fig. 8. Scatter plots and a plot of the centroids of functions 1 and 2 derived from Canonical Discriminant Function Analysis for 14 species of helminths in voles grouped by site and year. A, Urwitałt; B, Tałty; C, Pilchy. Key for symbols representing the four surveys in different years are the same for A, B and C and are given in the legend in A. D shows the centroids, each site represented by a different symbol as explained in the legend, and each point annotated with either U, T or P for Urwitałt, Tałty and Pilchy, respectively, and 99, 02, 06 and 10 representing the years 1999, 2002, 2006 and 2010, respectively.
DISCUSSION
The data presented in this paper are based on systematic surveys of helminth parasites of wild rodents exploiting exactly the same study sites over a period of more than a decade. As such the dataset represents one of the longest longitudinal studies on wild rodents in the literature. Perhaps the most interesting outcome is that despite the 11-year period between the first and the fourth survey, some indicators of helminth population structure have remained remarkably stable. At the highest taxonomic level the prevalence of all helminths and of all nematodes (all species combined in each case), in each of the three sites showed relatively little change over the study period, as was also the case for core species such as H. mixtum, H. glareoli and M. muris. Our data for H. mixtum (particularly at Tałty) have some similarity to those of Bugmyrin et al. (Reference Bugmyrin, Ieshko, Anikanova and Bespyatova2005) who found that annual prevalence of this species over the period between 1996 and 2003 varied only between 20 and 40%. Although the worm burdens in that study were lower (generally less than an average of one worm/host) the annual mean burdens hardly varied between years, similarly to our observations at Tałty. Heligmosomum mixtum has been reported previously to have highly stable under-dispersed or weakly aggregated population dynamics (Haukisalmi Reference Haukisalmi1986; Haukisalmi et al Reference Haukisalmi, Henttonen and Vikman1996) and this stability has been linked to the predictable occurrence of this core nematode taxon across wide geographical areas and through relatively long periods of time. However, in our study, the best-fit distribution by far for H. mixtum was a negative binomial distribution, and this remained so even when the data from Pilchy (where it was extremely rare) were omitted from the analysis. Therefore, the long-term stability of this species in our sites must be attributable to other factors which are currently not understood, but likely hypotheses can be linked to the ecological characteristics of the two woodlands in which this species was most common and possibly intrinsic factors including genetic which are known to differ between these bank vole populations (Kloch et al. Reference Kloch, Babik, Bajer, Siński and Radwan2010).
Equally of interest was our finding that where differences in prevalence of H. mixtum, H. glareoli and M. muris existed between sites, they were largely maintained across the entire period. Heligmosomum mixtum always showed the highest prevalence in Urwitałt, followed by Tałty, and with the exception of a single worm collected in 2010, was otherwise absent from Pilchy. Heligmosomoides glareoli consistently showed the highest prevalence in Pilchy, and M. muris showed similar prevalence in Urwitałt and Pilchy but was rare in Tałty. So for these three species and also at the higher taxonomic level of combined helminths and combined nematodes, there was stability and a high degree of predictability in prevalence.
In marked contrast other measures of infracommunity structure showed dramatic, dynamic changes over the period of study and some species had a disproportionate influence on measures of abundance at the higher taxonomic level. In the cases of both combined helminths and combined nematodes, abundance dropped markedly after the 1999 survey and then stabilized at a considerably lower level. The explanation in this case was the disappearance of S. petrusewiczi from each of the three sites over the period, a species that is often found with very high worm burdens in some infected hosts. In 1999 the maximum recorded burden was 4026 worms in a single vole. Abundance was lower in 2002 and then, despite increased sampling effort in the following two surveys, the parasite disappeared completely (our unpublished observations in 2014 also showed no Syphacia in any of these populations). All Syphacia species have the potential to give rise to very intense infections with thousands of worms in a single individual, probably mostly as a result of autoinfection, but usually in only a few intensely infected individuals (Grear and Hudson, Reference Grear and Hudson2011). Why this parasite should die out in each of these three populations is not known since there has been virtually no noticeable ecological change over the period in the sites, other than the generally well perceived climatic trends associated with global warming throughout Europe (Michalska, Reference Michalska2011; Institute of Meteorology and Water Management, Poland, 2013; European Environment Agency, 2014) and infrequent harvesting of trees from the forests by the Polish Government's Department of Forestry (Nadleśnictwo Pisz 2014; Zajączkowski et al. Reference Zajączkowski, Jabłoński, Jabłoński, Małecka, Kowalska, Małachowska and Piwnicki2014). None of the three sites in which we sampled voles has been directly affected by felling, but adjoining areas have been felled and replanted, and in 2002 parts of the Pilchy site adjoining, but not directly at our sampling site, experienced significant wind damage.
In marked contrast to the disappearance of S. petrusewiczi, other species increased significantly in prevalence and abundance. Aonchotheca annulosa was notable among these species. It was not detected at all in any of the voles sampled in 1999. It then increased steadily in Urwitałt, to a lesser extent in Tałty but was still found only sporadically in Pilchy. This increase in both prevalence and abundance of A. annulosa across the 11 years of our study bears some similarity to the consistent increase in prevalence of Aonchotheca murissylvatici (previously Capillaria murissylvatici and a sister species of A. annulosa; Moravec, Reference Moravec1982, Reference Moravec2000) in bank voles over 5 years reported by Haukisalmi et al. (Reference Haukisalmi, Henttonen and Tenora1988). In some respects the increase in A. annulosa in Urwitałt and Tałty was mirrored by the loss of S. petrusewiczi; whether these events were related causally, or just by coincidence in timing, is not known. Not surprisingly therefore, the values of helminth species richness and BID remained relatively steady without major change as loss of one species was compensated by gain of the other.
In relative terms SITE was a key factor in explaining prevalence and abundance of M. muris, H. mixtum and H. glareoli and to some extent also A. tianjinensis confirming that for these species the local environment, whether habitat or host-determined, was relatively stable across the decade of sampling, enabling uninterrupted transmission between hosts, and was therefore an important driver of the intensity of worm burdens. For other species such as A. annulosa, C. henttoneni and even MSR, SITE also explained a significant percentage of deviance in quantitative statistical models, but additionally other factors came into play, so changes over time, host age and different statistical interactions were more important. The CDF analysis (Fig. 8) was particularly instructive in showing that on the basis of the two major axes, largely influenced by the dominant species of helminths, the three sites each delineated their own space on the figure and the centroids for each site clustered closer to one another than to those from other sites with no overlap from the four surveys. This interpretation of the outcomes of the analysis therefore provides support for our hypothesis that the helminth communities in bank voles living in each of the three sites are characterized by certain combinations of species, which show little overall change over the course of a decade. Hence, the site of capture of animals plays a pivotal role in predicting likelihood that they will be infected by a particular species, or combination of helminth species.
The relatively greater influence of extrinsic factors, compared with intrinsic factors, on helminth communities has parallels in other host-helminth systems and site of capture in particular is known to play a major role since it largely determines the infective stages that hosts are likely to be exposed to (Mollhagan, Reference Mollhagan1978; Abu-Madi et al. Reference Abu-Madi, Behnke, Lewis and Gilbert1998; Calvete et al. Reference Calvete, Blanco-Aguiar, Virgós, Cabezas-Díaz and Villafuerte2004; Booth, Reference Booth2006). The spectrum of infective agents in any given locality is dependent primarily on the availability of the most abundant hosts in the vicinity and the parasites that they carry, and stochastic events (local introductions/ extinctions) can drastically alter the local range of available pathogens. However, the ecology of the environment provides a major source of variation for the risk of infection since both the survival of resident and introduced infective stages of parasites may be affected, and as expected helminth communities have been found to vary between rodents sampled in ecologically quite different habitats (Kinsella, Reference Kinsella1974; Martin and Huffman, Reference Martin and Huffman1980; Haukisalmi et al. Reference Haukisalmi, Henttonen and Tenora1987; Montgomery and Montgomery, Reference Montgomery and Montgomery1988, Reference Montgomery and Montgomery1989; Abu-Madi et al. Reference Abu-Madi, Behnke, Lewis and Gilbert1998, Reference Abu-Madi, Behnke, Lewis and Gilbert2000; Simões et al. Reference Simões, Gentile, Rademaker, D'Andrea, Herrera, Freitas, Lanfredi and Maldonado2010; Ribas et al. Reference Ribas, Guivier, Xuéreb, Chaval, Cadet, Poulle, Sironen, Voutilainen, Henttonen, Cosson and Charbonnel2011), although not universally (Haukisalmi et al. Reference Haukisalmi, Henttonen and Tenora1987; Milazzo et al. Reference Milazzo, Casanova, Aloise, Ribas and Cagnin2003). However, it is relevant that, as here, helminth communities in wild rodents have also been found to differ significantly among animals from sites which differ very little ecologically and are located in close proximity to one another (Montgomery and Montgomery, Reference Montgomery and Montgomery1990; Behnke et al. Reference Behnke, Barnard, Bajer, Bray, Dinmore, Frake, Osmond, Race and Siński2001; Krasnov et al. Reference Krasnov, Mouillot, Shenbrot, Khokhlova, Vinarski, Korallo-Vinarskaya and Poulin2010).
As expected many measures of infracommunity structure increased with host age (Tenora and Zejda, Reference Tenora and Zejda1974; Montgomery and Montgomery, Reference Montgomery and Montgomery1989). The worm burdens of individual species, helminth species richness and diversity all generally increased, whether examined in year specific cohorts or by site. There were few exceptions, as indicated earlier. This pattern of increasing prevalence and abundance of worm burdens with host age has been reported consistently in wild rodents (Montgomery and Montgomery, Reference Montgomery and Montgomery1989; Janova et al. Reference Janova, Skoric, Heroldova, Tenora, Fictum and Pavlik2010), including bank voles (e.g. Apostatandrya macrocephala in Haukisalmi et al. Reference Haukisalmi, Henttonen and Tenora1988 and H. mixtum in Bugmyrin et al. Reference Bugmyrin, Ieshko, Anikanova and Bespyatova2005) and is almost certainly generated through the accumulation of these long-lived parasites throughout the life of the host (e.g. M. muris is believed to live for at least a year in wild rodents (Rausch and Tiner, Reference Rausch and Tiner1949, citing Kirschenblatt, Reference Kirschenblatt1938)). Some studies show a decline in intestinal nematode burdens in older animals, perhaps indicating acquired resistance to infection (Haukisalmi et al. Reference Haukisalmi, Henttonen and Tenora1988; Gregory, Montgomery and Montgomery, Reference Gregory, Montgomery and Montgomery1992; Behnke et al. Reference Behnke, Lewis, Mohd Zain and Gilbert1999), but there was little evidence of such a decline with age in our data, other than in the occasional data subset, as for example in H. glareoli in 1999. This lack of evidence for immunological resistance may be due to the high mortality experienced by M. glareolus at these sites; with 50% survival time for bank voles at Urwitałt varying between 1 and 3 months (Paziewska et al. Reference Paziewska, Harris, Zwolińska, Bajer and Siński2012), in order to detect immunological elimination in the current dataset, the effect would have to be particularly strong. Overall, as Fig. 2 shows, the increase in worm burdens with host age was among the strongest intrinsic and most consistent effects on parasite prevalence and abundance observed in the current work and particularly marked in the case of helminth diversity.
In contrast to the age effect, there were few cases of sex-biased prevalence or abundance. We found no evidence for a sex bias in H. mixtum, as reported by Haukisalmi et al. (Reference Haukisalmi, Henttonen and Tenora1988), and more recently by Bugmyrin et al. (Reference Bugmyrin, Ieshko, Anikanova and Bespyatova2005). In our case convincing and consistent disparities between the sexes were detected only in M. muris and A. annulosa and in both cases prevalence was higher in females and cumulatively this was sufficient to generate a significant female sex bias in MSR of helminths. The higher prevalence of M. muris in female bank voles compared with males, has been discussed in some detail in Grzybek et al. (Reference Grzybek, Bajer, Behnke-Borowczyk, Al-Sarraf and Behnke2015), and has been reported previously in these populations (Behnke et al. Reference Behnke, Bajer, Harris, Newington, Pidgeon, Rowlands, Sheriff, Kuliś-Malkowska, Siński, Gilbert and Barnard2008b ). Haukisalmi et al. (Reference Haukisalmi, Henttonen and Tenora1988), also found a higher prevalence and intensity of M. muris in older female bank voles that had overwintered and survived until the autumn, but reported a trend in the opposite direction among summer born mature bank voles. In our data, all other cases of significant sex effects arose only as interactions, with the balance changing between dominance in males and then females depending on year of survey or site. The few instances of sex bias in helminth infections in our data are consistent with the literature for wild rodents, where generally it has been found that differences between the sexes in the worm burdens they carry are minimal (Kisielewska Reference Kisielewska1970b ; O'Sullivan, Smal and Fairley, Reference O'Sullivan, Smal and Fairley1984; Abu-Madi et al. Reference Abu-Madi, Behnke, Lewis and Gilbert2000; Bordes et al. Reference Bordes, Ponlet, de Bellocq, Ribas, Krasnov and Morand2012) but we cannot exclude the possibility that sex-bias is season dependent. All of our sampling was conducted in late summer and early autumn period and it is possible that at other times of the year, host sex-differences in the abundance of some species are more evident and perhaps related to seasonally dependent sexual dichotomy in reproductive behaviour (Bajer et al. Reference Bajer, Behnke, Pawelczyk, Kulis, Sereda and Siński2005).
Although our study was based on destructive cross-sectional surveys, our trap lines covered only a very small area of the extensive forests in each site. Cross-sectional studies based on destructive sampling will have consequences for host populations if conducted too frequently, depending on the number of animals culled and the frequency and extent of culling relative to the total population. Host population density is known to influence parasite burdens (Arneberg, Reference Arneberg2001), so any marked reduction in host population as a result of intervention is likely to have an impact on helminth community structure. Moreover, migration of animals from neighbouring areas into a sample site where density has been reduced may alter the parasite community structure subtly. However, from other work in contiguous forest sites, and elsewhere, it is known that bank vole populations decline markedly in the winter and early spring each year but return to a peak in late summer or autumn (Alibhai and Gipps, Reference Alibhai, Gipps, Flowerdew, Gurnell and Gipps1985; Bujalska, Reference Bujalska2000; Bajer et al. Reference Bajer, Behnke, Pawelczyk, Kulis, Sereda and Siński2005). Sampling at 3 or 4-year intervals, at the peak of population density in early autumn, therefore constitutes a reasonable compromise in facilitating assessment of helminth populations in bank voles without imposing major losses on the host population and destabilizing the transmission of parasites. An alternative is to adopt mark-release-recapture methods to generate longitudinal data based on indirect measures of parasite burdens acquired by non-destructive methods such as by faecal egg counts (FEC; Knowles et al. Reference Knowles, Fenton, Petchey, Jones, Barber and Pedersen2013). There is a strong positive correlation between parasite numbers and FEC in some species (Keymer and Hiorns, Reference Keymer and Hiorns1986; Quinnell, Reference Quinnell1992), and FEC are widely used to assess intestinal helminth infections in humans (Bundy, Reference Bundy, Schad and Warren1990; Levecke et al. Reference Levecke, Behnke, Ajjampur, Albonico, Ame, Charlier, Geiger, Hoa, Kamwa Ngassam, Kotze, McCarthy, Montresor, Periago, Roy, Tchuem Tchuente, Thach and Vercruysse2011). However, although FEC can be useful in a prevalence context framework, it is not helpful for the estimation of some parasite burdens such as those of pinworms of the genus Syphacia spp. (among the most common genus of helminths of European wild rodents). Syphacia spp. release eggs onto the perianal surface of their hosts and not in feces (Lewis and D'Silva, Reference Lewis and D'Silva1986; Baker, Reference Baker and Baker2007) and egg shedding by pinworms can be intermittent (Lewis and D'Silva, Reference Lewis and D'Silva1980; Hill, Randolph and Mandrell, Reference Hill, Randolph and Mandrell2009). Reliance on FEC also misses juvenile, as yet non-fecund worms, and males, in circumstances where sex ratio may not be unity (Anderson, Reference Anderson and Anderson1982). Most importantly however, egg output by helminths is density dependent (Anderson, Reference Anderson and Anderson1982), and FEC cannot be always extrapolated to estimate worm burden accurately (Ghazal and Avery, Reference Ghazal and Avery1974). Density dependence is well understood at an intra-specific level, but is also known to occur between parasite species, and understanding inter-specific interactions is another goal of studies such as this one (data currently in preparation for publication); it is impossible using FEC to distinguish between inter-specific effects on egg outputs of individual worms, and inter-specific effects on worm density. It is pertinent also that some helminths, most notably Syphacia spp. show a highly aggregated distribution of worm burdens among hosts (Scott and Gibbs, Reference Scott and Gibbs1986; Grear and Hudson, Reference Grear and Hudson2011) and some rodents may harbour thousands of individual worms, as found in the current study. This overdispersed distribution would be entirely missed by FEC (Baker, Reference Baker and Baker2007), because as stated above relatively few Syphacia eggs actually end up in the feces. It is also relevant that FEC cannot quantify the larval stages of helminths that reside deep within the host in organs such as the liver (e.g. tapeworm cysts Taenia taeniaeformis, V. mustellae, C. globifera), and for which rodents act as intermediate hosts. Again, as we have found, the parasite burdens with some of these species may be immense; for example, several hundred Mesocestoides individuals may occur in a single host animal (Behnke et al. Reference Behnke, Bajer, Harris, Newington, Pidgeon, Rowlands, Sheriff, Kuliś-Malkowska, Siński, Gilbert and Barnard2008a ).
Finally, the work reported in this paper, has been built on our earlier publications (Behnke et al. Reference Behnke, Barnard, Bajer, Bray, Dinmore, Frake, Osmond, Race and Siński2001, Reference Behnke, Bajer, Harris, Newington, Pidgeon, Rowlands, Sheriff, Kuliś-Malkowska, Siński, Gilbert and Barnard2008b ), extending the period over which the helminth communities of bank voles in our three sites in NE Poland have been monitored by further 8 years (2006 and 2010). Our data emphasize that despite the fluctuations that characterize the prevalence and abundance of the rarer species, there is a large element of stability generated by the dominant species, which show little change over time. This contrasts with the patterns of change detected for haemoparasites, where each of the five species studied showed a different pattern of spatiotemporal change over the 11 years (Bajer et al. Reference Bajer, Welc-Falęciak, Bednarska, Alsarraf, Behnke-Borowczyk, Siński and Behnke2014). The picture with helminths is further complicated by clear trends leading to extinction of species (as in the case of S. petrusewiczi, at least in our sites, but presumably not elsewhere in the vicinity) and the influx of new species (as in the case of A. annulosa) which in time may eventually join the dominant species as established members of the community at particular sites. Our research has generated a long-term dataset, which provides fundamental information about the community ecology of a complex natural system and our findings caution against snap-shot, single cross-sectional surveys that may not provide all the relevant information for hypotheses about parasite-derived long-term selective pressures on hosts living in specific sites. The baseline data we have generated provide a foundation to explore the mechanisms that shape long-term trends in complex communities and continued monitoring of this system will strengthen inferences and focus hypotheses.
ACKNOWLEDGEMENTS
We thank Mgrs Grzegorz Górecki and Anna Zaborowska, the wardens of the field station at Urwitałt, for the use of the facilities. We wish to acknowledge the support of the forestry departments responsible for the woodland sites utilized in our study (Nadleśnictwa Giżycko, Mikołajki and Orzysz). Finally we thank all the undergraduate student helpers from both NU and WU who helped with field work during the four expeditions to our study sites.
FINANCIAL SUPPORT
We thank the Universities of Nottingham and Warsaw for enabling this study through financial support for travel and consumables. Our work was additionally supported by travel grants from the Royal Society (JMB), the British Ecological Society (JMB), the Grabowski Fund (JMB), the Polish State Committee for Scientific Research (KBN, AB), the Ogden Trust (GSB) and by the KBN and British Council's Young Scientist Programme (AB).


