
Introduction
In April 2017, new fieldwork at Ur investigated urban scale, city organization, and the environment of the city's hinterland. Thanks to Woolley's excavations in the 1920s and 1930s, Ur is still today one of the best-known cities in Mesopotamia. However, the site and its surrounding region were passed over entirely by important methodological and interpretive advances in landscape and survey archaeology. Woolley's investigations were long in the past by the time intensive surface collections were undertaken at other important sites in the southern alluvial plain, such as Kish, Uruk, Lagash, and Mashkan-shapir. Henry Wright's survey of the Ur-Eridu basin provided some regional context for the site, but he did not undertake systematic work at Ur. Now that excavation has returned to Ur, it is time to leverage various types of data to better address the demographic and structural history of urbanism at the site. An analysis of new sources of declassified aerial and satellite imagery from the 1950s and 1960s, recent unmanned aerial vehicle (UAV) photos, and a systematic surface collection show that Ur may have expanded to between 120–500 hectares in size during its later periods of inhabitation, far larger than the sixty hectare maximum size estimated by Wright. Traces of buried architecture visible in the UAV photos and topographic models generated from UAV photos allow for the generation of hypotheses about the city plan of Ur during the Late Larsa/Old Babylonian and Neo Babylonian periods. Relict watercourses mapped in the vicinity of the main mound indicate how the city might have been supplied with water in some periods. Alongside this site-based work, historical aerial and satellite imagery provide an updated picture of ancient hydrology, environment, and settlement patterns around Ur, revealing a number of previously unmapped sites and watercourses of unknown periods. Part 1 of this article addresses urban scale at Ur, and Part 2 addresses the regional landscape within the Ur-Eridu basin.
Part 1: The City of Ur
Earlier research at Ur (Tell al-Muqayyar) and in the Ur-Eridu basin was extensive yet still leaves significant questions about environment and urban scale that must be addressed via landscape archaeology. The main sources of published field data concerning Ur's urban layout and the surrounding ancient settlement pattern are the mid-late nineteenth and early twentieth century excavations of a series of archaeologists affiliated with the British Museum, most significantly those of Sir Leonard Woolley (Reference Woolley1922–1934) (Woolley Reference Woolley1934, Reference Woolley1939, Reference Woolley1955, Reference Woolley1962, Reference Woolley1965, Reference Woolley1974; Woolley and Mallowan Reference Woolley and Mallowan1976; for a full summary of all excavations at Ur, see Zettler and Hafford Reference Zettler and Hafford2015), and the regional survey of the Ur-Eridu basin carried out by Henry Wright in 1966 (Wright Reference Wright and Adams1981). While the study of Ur and Mesopotamian cities undoubtedly benefitted enormously from this early focus on the site and its environs, the volume of available data perhaps discouraged further investigation during the decades of archaeology's greatest methodological and theoretical advances from the 1960s to 1980s, in favor of exploration of new areas throughout southern Iraq, especially sites in the central part of the Tigris–Euphrates alluvium. Since the closure of Iraq to foreign researchers in the 1990s, archaeologists have pursued issues of urban scale and landscape at Ur and in the Ur-Eridu basin primarily through satellite remote-sensing analyses. These studies include satellite imagery-based work on the extent of the Persian Gulf and the southern Mesopotamian marshes in antiquity (Pournelle Reference Pournelle2003, Reference Pournelle and Stone2004, Reference Pournelle and Crawford2013) and analysis of Sealand Dynasty period settlement patterns in the Ur region, which draws on satellite imagery and field survey in drained marsh areas (Al-Dafar Reference Al-Dafar2015; Al-Hamdani Reference Al-Hamdani2014).
Ur was an important Mesopotamian city for over three thousand years, from the Ubaid period to the time of the Achaemenids, c. 3800–500 B.C. Excavation of the site has produced important data on temple, administrative, and domestic architecture, neighborhood layout, and most famously the treasures of the Royal Cemetery. The excavated remains extend across a large oval mound, separated into north and south portions by a depression that might correspond to the location of an ancient canal (Stone Reference Stone1991: 238; Woolley Reference Woolley1930) (Fig. 1). Thanks to Woolley's large-scale exposure and publication of a variety of types of urban spaces and the recovery of many cuneiform archives, Ur provides one of the most complete pictures archaeologists have of daily life in third and second millennium B.C. Mesopotamia. Area AH has the largest contiguous area of excavated houses in Mesopotamia and has served as an enduring model of the Mesopotamian neighborhood (Brusasco Reference Brusasco2004; Smith Reference Smith2003: 215–231; Stone and Zimansky Reference Stone and Zimansky2016; Zettler and Hafford Reference Zettler and Hafford2015: 379–382).
Fig. 1 Overview map of Ur showing extent of early twentieth century excavations and dumps in a U2 photograph from mission 8648 (displayed with a 2-standard deviation histogram stretch). The depression separating the north and south portions of the mound, perhaps representing the pathway of an ancient canal, is visible.
However, for all of our knowledge of Ur, archaeologists still do not know the site's maximum extramural size. The Royal Cemetery attests to Ur's wealth in the Early Dynastic period, and Ur was the capital of a territorial state (or nascent empire) in the Ur III period at the end of the third millennium B.C. But Wright has described the site as quite small in these periods: around fifty hectares in size, reaching a minimum of sixty hectares in the following Old Babylonian period (Wright Reference Wright and Adams1981: 330). The Ur III city walls, visible even today on satellite imagery, enclose roughly sixty hectares, including the areas of the north and west harbors. Other important cities in southern Mesopotamia, including Uruk (Finkbeiner Reference Finkbeiner1991), Lagash (Carter Reference Carter1989–90), Umma, Girsu, and Nina, expanded during the late Early Dynastic to 200–500 hectares in size (Ur Reference Ur and Crawford2013a: 141). Woolley's original suggestion that Ur covered 500 hectares was specifically contradicted by Wright (Reference Wright and Adams1981: 330). Thus, the question remains, why do we see such a huge discrepancy in size between Ur and its neighbors during periods when the site was so important? A re-analysis of Ur's urban scale using historical imagery and ground survey offers some answers.
Datasets and Site-Based Methods
Reassessment of Ur and its hinterland began with examination of the site and landscape in historical aerial and satellite imagery. In April 2017, ultra-high resolution imagery of the site was collected using a UAV camera, and subsequently the survey team began a systematic surface collection.
Imagery Datasets
In reassessing the site and its hinterland, four imagery datasets proved useful: KH-4B CORONA satellite imagery captured on 4 May 1968, KH-7 GAMBIT satellite imagery captured on 18 February 1966, U2 aerial photos captured on 30 October 1959, and aerial photos captured using a DJI Phantom 4 in April 2017. The GAMBIT and U2 datasets in particular require further explanation because archaeologists have rarely used them. In the last two decades, the availability of Cold War-era CORONA satellite imagery (captured 1960–1972, declassified in 1996), which provides nearly complete coverage of most of the Middle East, has transformed landscape archaeology in the region (Casana and Cothren Reference Casana and Cothren2008, Reference Casana, Cothren, Comer and Harrower2013; Challis Reference Challis2007; Hritz Reference Hritz2014; Philip et al. Reference Philip, Donoghue, Beck and Galiatsatos2002; Ur Reference Ur2003; Wilkinson Reference Wilkinson2003). The identification of ancient sites, fortifications, road networks, and irrigation networks in modern satellite imagery is limited by the degree to which these features have survived the destructive effects of development and intensive agriculture in the last several decades. Historic imagery sources like CORONA provide archaeologists with a window into the past, before these processes took hold in many rural areas. Remote-sensing studies of ancient southern Mesopotamian sites and environments have extensively employed the highest resolution CORONA images, with a resolution of c. 2 meters near nadir, from the KH-4A and KH-4B missions (1967–1972) (Hritz Reference Hritz2005; Pournelle Reference Pournelle2003; Wilkinson Reference Wilkinson2003). Re-examination of the Ur area drew on aft images from mission 1103 in order to provide data points that are temporally intermediate between U2 and modern imagery.
Archaeologists have more rarely used imagery from KH-7 GAMBIT, another Cold War-era satellite program, because of its much more limited coverage of particular hotspots and its later declassification than CORONA (images captured 1963–1967, declassified in 2002) (Di Giacomo and Scardozzi Reference Di Giacomo and Scardozzi2012; Fowler Reference Fowler2008; Scardozzi Reference Scardozzi2008; Ur Reference Ur2005, Reference Ur2013b). Where available, GAMBIT provides earlier and higher-resolution images than CORONA, with a maximum resolution of c. 2–3 feet (0.61–0.91 m) (Fig. 2). Three GAMBIT scenes (all from February–April 1966) cover Ur and its immediate hinterland, but these scenes unfortunately cover less than 25% of the Ur-Eridu survey area and only show areas close to the modern Euphrates course, where archaeological sites are less likely to be preserved on the surface (Fig. 3). The same GAMBIT scene used in the present study, from mission 4025 (18 February 1966), was earlier employed for cultural heritage monitoring of Ur (Di Giacomo and Scardozzi Reference Di Giacomo and Scardozzi2012).
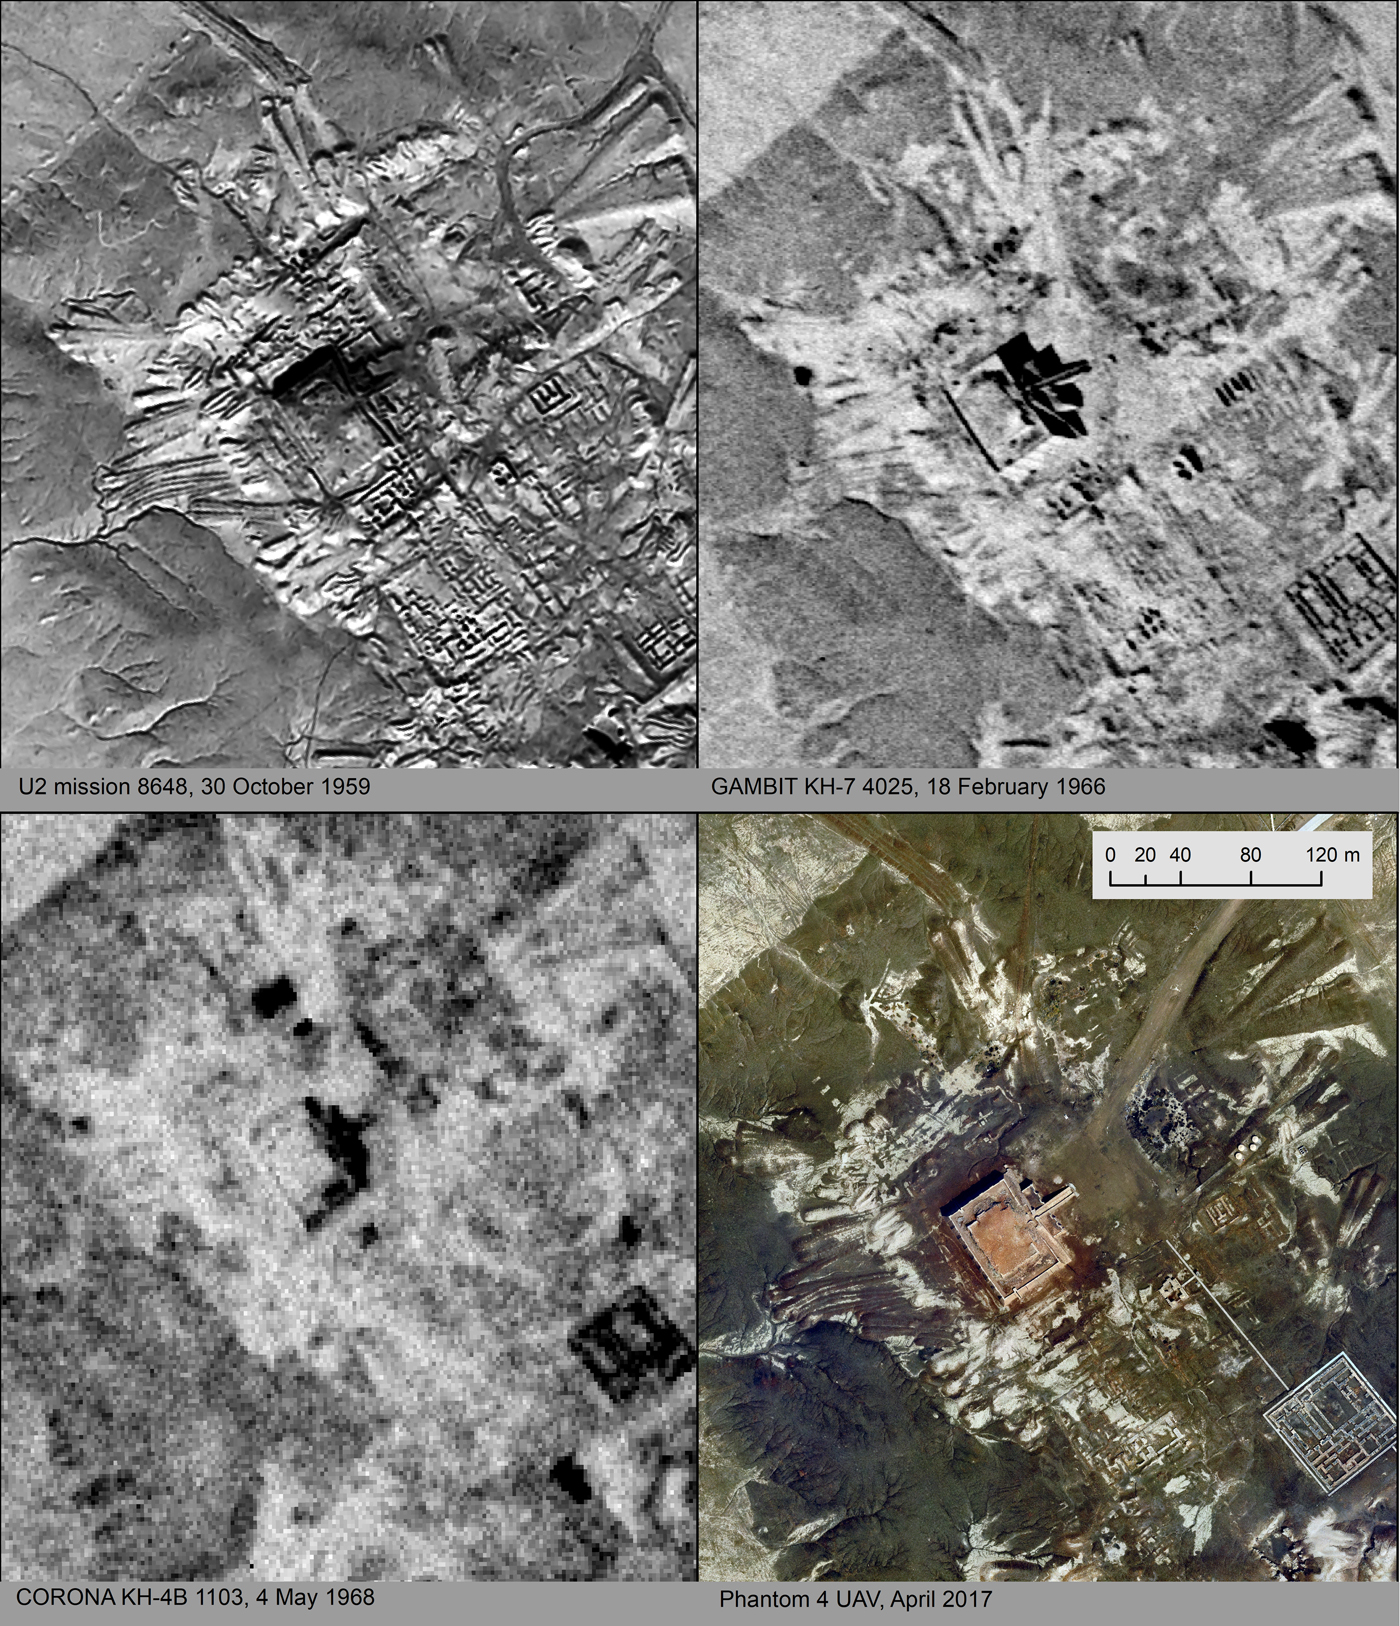
Fig. 2 Comparison of the resolution of U2 mission 8648 (30 October 1959, top left), KH-7 GAMBIT mission 4025 (18 February 1966, top right), KH-4B CORONA mission 1103 (4 May 1968, bottom left), and an orthophoto generated from Phantom 4 photos taken at an altitude of 80 meters (April 2017, bottom right). The view is above the Ur ziggurat. All images are displayed with a 2-standard deviation histogram stretch.
Fig. 3 Map showing the spatial extent of GAMBIT and U2 imagery used in this study in relationship to the location of Ur and the boundary of Wright's Ur-Eridu survey (Reference Wright and Adams1981).
The U2 spy plane program in the Middle East (1956–1960) provides another source of historical imagery from which archaeologists are only beginning to profit (Hammer and Lauricella Reference Hammer and Lauricella2017; Ur and Reade Reference Ur and Reade2015). Publication of a spatial index for Middle Eastern U2 missions and of procedures for obtaining usable digital copies of film rolls should in the near future enhance the accessibility of this archival aerial imagery (Hammer and Ur Reference Hammer and Ur2019). U2 images come from a panoramic camera that normally covered a c. 30 km wide swath under the plane's flight path, at slightly variable resolution. The camera system captured three photos: one vertical and two oblique. The left and right halves of each frame are stored on separate film rolls. Resolution is greatest in vertical frames, approaching 0.3–0.5 m at nadir (Fig. 2). The vertical and oblique photos have considerable overlap, but also three narrow “dead strips” of no coverage between the left and right halves of each frame (typically c. 200–250 m wide). Like GAMBIT, the spatial coverage of U2 photography is limited, but U2 provides an earlier and higher-resolution source of imagery than CORONA. The 8648 U2 mission flew right over Ur in a northwest-to-southeast orientation on 30 October 1959 and therefore captured imagery of much of the Ur-Eridu survey area in addition to imagery of the site itself (Fig. 3).
This repeated coverage in military imagery is not coincidence; Ur is located beside what must have been the U2 and GAMBIT cameras’ target, a railroad and possible military area south of Nasiriyah that later became the Talil Air Base (known to the US military as Imam Ali Air Base). Proximity to Talil has been a double-edged sword for the archaeology of the Ur area. Today, Ur is within the base's security perimeter, which has contributed to the site's generally excellent preservation in the face of extensive looting at many other sites across Iraq in the last two decades (on looting patterns, see Stone Reference Stone2008, Reference Stone2015). However, the massive expansion of this base by the Iraqis before the first Iraq War and especially by the Americans during the second Iraq War has obscured many archaeological sites and ancient watercourses in Ur's hinterland that remained visible at the time of the U2 and GAMBIT photographs.
Landscape-scale mapping using UAVs and structure-from-motion has become a common element of the archaeological toolkit across the world and in other parts of the Middle East (e.g., Campana Reference Campana2017; Hill and Rowan Reference Hill and Rowan2017; Olson and Rouse Reference Olson and Rouse2018; Ur Reference Ur2017; Werke et al. Reference Werke, Adams and Hooten2014), but due to the long research hiatus these methodologies are only just now being applied for the first time in southern Iraq. High resolution UAV imagery of Ur was captured over a period of two weeks in mid-late April 2017 using a DJI Phantom 4 flying at an altitude of 80 m. DroneDeploy flight planning software facilitated obtaining complete coverage of the site and adjacent areas and ensured that photos would have sufficient overlap to be used for photogrammetry. Multiple sets of aerial photographs of the whole site and adjacent areas taken under various lighting and moisture conditions were processed in Agisoft Photoscan to obtain orthophotos of the site at a resolution of c. 3 centimeters and digital elevation models of the site at a resolution of c. 6 centimeters.
Imagery analysis
U2 and GAMBIT imagery were first georeferenced and then systematically inspected in a GIS program in order to map archaeological features. Whenever possible, ground control points for georeferencing were drawn from rectified recent DigitalGlobe imagery available through the ESRI ArcGIS Online Imagery Basemap. Some U2 frames in areas that have been radically transformed by shifting dunes, modern development, and agriculture could not be georeferenced to modern imagery. In these cases, ground control points were drawn from previously georeferenced CORONA scenes covering a much broader area.
Visual inspection of U2, GAMBIT, CORONA, and UAV imagery covered the surface of the site and immediately surrounding areas in order to map soil discolorations, surface architecture, relict watercourses, mounding, and any other potential archaeological features. In historical panchromatic imagery, anthropogenic soils typically appear as dark or light soil discolorations, as they frequently collect or shed moisture at a different rate from surrounding sediments.
UAV images allowed the tracing of buried and surface architecture across the site. Three different types of architectural traces were visible after an April 2017 rainstorm: white linear features, dark linear features, and surface baked brick alignments (reddish in color) (Fig. 4). A regional study of southern Mesopotamian sites mapped similar architectural traces using DigitalGlobe satellite imagery captured after rainstorms, attributing differences in soil color to drainage and differential drying patterns as well as salt concentrations. More specifically, this study noted three distinct patterns: surface baked brick alignments; short-lived dark traces attributed to water concentrations remaining above dense unbaked mudbrick walls after water had drained more rapidly in adjacent less compact room fills and streets; and longer-lived light traces attributed to concentrations of salt above mudbrick walls where there is a saline water table (Stone Reference Stone2014: 181–182). A difference was observed in UAV photos from after a rainstorm at Ur in that both dark and light traces disappeared from view quickly after the rain, and light traces did not seem associated with salt concentrations. On the basis of observations made below, it seems likely that, in the available set of UAV photos of Ur, white linear features can indicate both buried baked brick and buried unbaked mudbrick walls/features. The color of these white lines likely indicates that they are differentially shedding moisture. Unlike the observation made using kite photographs from after a rainstorm at Mashkan-shapir (Stone and Zimansky Reference Stone and Zimansky2004: 335), mudbrick walls at Ur did not always contain more moisture than their surrounding fills, perhaps because the April 2017 rainstorm was a relatively brief one. It seems likely that dark linear features indicate compacted street surfaces or perhaps buried unbaked mudbrick walls/features, but this has yet to be verified, and the difference between light and dark linear features remains unclear. Mudbrick alignments from an aerial perspective do not just represent walls, as bricks were also used for pavements and other features such as vaulted tombs (Stone and Zimansky Reference Stone and Zimansky2004: 59–61).

Fig. 4 Three types of architectural traces are visible in the after-rain UAV photos: light lines, dark lines, and surface baked brick alignments. The basemaps consist of UAV photos following rain with a 2-standard deviation histogram stretch (top) and the hillshade generated from UAV photos (bottom).
The UAV orthophotos also clearly show previously excavated architecture from the campaigns of Woolley and others. Since previous excavations were unevenly documented, the detailed orthophotos can play an important role in the integration of old and new datasets. In particular, they can facilitate the preparation of digital maps that in the future may be integrated with online databases of objects from Ur (Hafford Reference Hafford2013). UAV photos further have been used to generate a detailed three-dimensional model of Ur's ziggurat. This model has been made available online on Sketchfab, which plays a role in public outreach.
The high-resolution elevation model developed from the UAV photos and its derivative hillshade model also aid in mapping and re-investigating a number of features excavated or marked by Woolley (Fig. 5). For example, the elevation model and hillshade model show former excavations, which allows for more precise georeferencing of old plans than has until now been possible with other aerial photography and satellite images (Benati et al. Reference Benati, Leoni and Mantellini2016). The models also show former excavation dumps, which helps in planning survey. The hillshade model shows the shape and topography of some poorly described features, such as the feature closing off what Woolley called the “west harbor.”

Fig. 5 Detail from the hillshade models generated from UAV photos. On the left, the east side of the temenos, showing eroded excavation trenches and dumps. On the right, topographic detail of the feature that Woolley describes as closing off the “West Harbor” after it fell out of use.
Field survey methods
The ground survey begun in April 2017 focused on areas off Ur's mound, with the goal of determining the extent of ceramic scatters beyond the Ur III period walls. In this first season, work took place on and around the south portion of the mound in order to complement the recent excavations in this area by the Stony Brook and Munich University teams (Stone and Zimansky Reference Stone and Zimansky2016). Seventy 10 x 10 m surface collection units were placed on a 100 x 100 m grid using a Trimble Geo7x GPS. Within each surface collection unit, surveyors collected all diagnostics and recorded a count of ceramic slag fragments. At the southwest corner of each unit, surveyors also excavated a 50 x 50 x 50 cm test pit, sieving all sediment and then counting and weighing all pottery, slag, and bronze (Fig. 6). Twenty surface collection and test pit units were collected on the mound itself and fifty were collected in surrounding areas up to 350 m off the mound. This methodology is a modified version of that used to investigate urban scale and organization at the large multi-period northern Mesopotamian cities of Tell Hamoukar and Tell Brak (Ur Reference Ur2010; Ur et al. Reference Ur, Karsgaard and Oates2007, Reference Ur, Karsgaard and Oates2011).

Fig. 6 Photo illustrating the ground survey method, showing a surface collection unit and test pit located to the west of mound.
As with any surface methodology, this approach yields most information on the latest periods of habitation—in the case of Ur, the Achaemenid, Neo-Babylonian, Kassite, and Old Babylonian periods—except in areas where the latest periods of habitation have been removed by erosion. Earlier excavations at Ur provide ample evidence that significant portions of the site's top strata have eroded away due to wind and rainwater. Woolley frequently found late period burials just below the surface. These burials almost certainly had been located beneath building floors, but these floors and associated buildings had disappeared. Persian/Neo-Babylonian and Kassite houses excavated by Woolley only survived in very fragmentary states, with little wall height preserved. When he worked on houses in Area NH, Woolley and his team merely cleared the lines of the walls in order to map them, as little else remained (Woolley Reference Woolley1962: 45–48). Preservation of the latest strata has been poor in new trenches excavated since 2015 (William B. Hafford, personal communication). The results of the survey presented below provide additional information about spatial variability in the preservation of Neo-Babylonian architecture.
Test pits helped to obtain a more accurate count of pottery density and chronological variability than was possible from the surface. The density of material on the surface, especially ceramic slag, made collection problematic, and it simply was not possible to collect all pottery. In fact, it was frequently difficult to tell which sherds were diagnostic because sherds were cemented into the crusted, salinized surface of the site. Surveyors sometimes had to crack the surface in order to check each sherd.
At the end of every workday, diagnostic sherds from surface collection units and test pits were brought back to the excavation house, washed, counted, and weighed. Ceramic fabric characteristics and vessel forms (open versus closed) were recorded as well. A subset of sherds was selected for drawing and further documentation.
Site-Based Results
City Size on the Basis of Remote Sensing
The newly-acquired U2 and GAMBIT imagery suggests that Ur's maximum extramural extent was in some periods much larger than previously recognized. A clear soil discoloration around the high mound, visible in both sets of imagery, extends a significant distance beyond the Ur III period walls, covering almost 500 hectares (Fig. 7). The size of the soil discoloration, even if only parts of it were inhabited, would bring the spatial scale of Ur in line with many of its third millennium B.C. contemporaries.
Fig. 7 Soil discoloration visible in both GAMBIT imagery (mission 4025, 18 February 1966) and U2 photos (mission 8648, 30 October 1959) extends over 380 hectares beyond Ur's Ur III period walls, which encircle the mound.
This size estimate matches well with Woolley's original impression of the site's extent. Woolley did not propose site boundaries, but his contour plan matches the extent of soil discoloration in the imagery (Fig. 8), and he states that Ur must have covered roughly 500 hectares (Woolley Reference Woolley1965: 193). Woolley's workers reportedly picked up objects on their way from their villages or camps to Ur, a commute that took them across an area locally known as Diqdiqqah, located northeast of the Ur temenos (Woolley and Mallowan Reference Woolley and Mallowan1976: 82). The nature of these randomly collected artifacts suggested to Woolley that Diqdiqqah was a suburb of Ur, more specifically a quarter of craftspeople producing terracottas and cylinder seals (Woolley and Mallowan Reference Woolley and Mallowan1976: 12). The content of Ur III and Isin-Larsa period texts collected from this area led Jacobsen to propose that there was a canal crossing or weir in this area at those times (Reference Jacobsen1960: 179–185). A mound excavated by Mallowan at the contour plan's northeastern edge and a chain of mounds between this mound and Ur were recorded as separate sites by Wright during his survey (sites 11 and 12), inhabited in the Ur III, Isin-Larsa, Old Babylonian, Neo-Babylonian, and Persian periods (Reference Wright and Adams1981: 338). However, the soil discoloration in the historical images and this detail about Woolley's workers suggests that Diqdiqqah could have been connected to Ur in at least some periods by inhabited areas—it was not a separate suburb but instead an intensively utilized area at the edge of the city. Similar conclusions were drawn at the northern Mesopotamian city of Tell Brak, where early excavators (Mallowan and Oates) labeled some surrounding areas like Tell Majnuna as separate sites, but later systematic survey and surface collection showed that these areas were connected to Brak (Ur et al. Reference Ur, Karsgaard and Oates2011: 2–3) and subsequent excavations revealed that these areas were used for rubbish discard, burials, and industry (McMahon and Stone Reference McMahon and Stone2013, McMahon et al. Reference McMahon, Sołtysiak and Weber2011).

Fig. 8 Woolley's topographic plan of Ur (Reference Woolley1974) superimposed on GAMBIT imagery (mission 4025, 18 February 1966), showing the correspondence between the extent of his contours and soil discoloration visible in the imagery. Diqdiqqah is visible at the northeast corner of the area.
Not all of the area within this soil discoloration would have necessarily been as densely inhabited as Ur's main mound. A careful look at the nature of the terrain between Ur and Diqdiqqah suggests that a series of small individual mounds characterized this area (Fig. 9). Woolley and Mallowan in fact described Diqdiqqah as a “long broken line of mounds” (Woolley and Mallowan Reference Woolley and Mallowan1976: 81). The shape and extent of these mounds appear most clearly in the U2 imagery due to lighting. Woolley also marked them in his original topographic plan. Their presence and lower profile in comparison to Ur and Diqdiqqah could suggest more dispersed inhabitation and/or a more sporadic occupation history.

Fig. 9 A series of low individual mounds located in the northeast corner of Ur in the possible “suburban” area that Woolley called Diqdiqqah, visible in U2 imagery on the left (mission 8648, 30 October 1959) and a digital elevation model (DEM) created from UAV photos on the right (April 2017). Woolley's contours also show these mounds. On the right, the DEM overlays a DigitalGlobe image (15 July 2015) that gives a sense of the radical transformation of this part of the site by modern construction.
Further investigation of areas surrounding Ur's main mound and the space between Ur and Diqdiqqah are required to confirm the above hypotheses. The UAV results suggest that the ground survey might have some limited success in clarifying the nature of any settlement between Ur and Diqdiqqah. The amount of modern construction to the north and northeast of main mound, especially that associated with the excavation houses and the housing compounds of Ur's guards and other nearby residents, suggests that this area might be too disturbed for surface survey. However, the digital elevation model developed from UAV photos shows traces of the mounds that appear clearly in U2 photos, GAMBIT imagery, and Woolley's contour plan, indicating that the topography has not been too dramatically altered and therefore that stratigraphy may be preserved (Fig. 9).
Architectural Traces, City Organization, and City Size in UAV Photography
In mid-April 2017, the survey team was extremely fortunate be at Ur and equipped with a UAV camera during a relatively rare rainstorm, when moisture in the soil briefly highlighted buried architectural features. Following the rain, one could see these architectural features on the ground, but an aerial perspective was necessary to map them fully at the moment when moisture conditions were ideal. The timing of the aerial photos was critical. Photos captured immediately after the end of the rainstorm clearly showed the three types of linear features discussed above, but buried features were not visible a few hours later, although the soil remained damp. This narrow time window for recognizing mudbrick walls from the surface after a rainstorm was long ago observed in kite photographs at Maskan-shapir (Stone and Zimansky Reference Stone and Zimansky2004: 335). Commercial high-resolution satellite imagery does not show these features, in part because it is considerably lower resolution than orthophotos generated from UAV camera imagery. The walls of Mesopotamian houses average about 60 centimeters in thickness and therefore lie at the limits of resolution for modern commercial imagery (Stone Reference Stone2014: 181).
This high-resolution UAV dataset enabled the mapping of buried and near-surface architecture visible across the north and south portions of the mound (Fig. 10). Surface baked brick alignments and light linear features blanket the south portion of the mound. Many of the light linear features are in alignment with the Neo-Babylonian private houses excavated by Woolley in Area NH, which were constructed wholly of mudbrick without baked brick foundations (Fig. 11) (Woolley Reference Woolley1962: 43–48, pl. 171). Some housing areas at Ur showed continuity in their plans between periods; for example late Isin-Larsa/early Old Babylonian houses with baked brick foundations in Area AH follow the plan of an earlier phase of mudbrick architecture (Stone and Zimansky Reference Stone and Zimansky2016: 255). However, Woolley noted that the Neo-Babylonian houses in Area NH were built on cleared ground in a new orientation, on a plan “which differentiates them altogether from the private houses of former times….The houses lie on either side of a broad and…straight street…this is a remarkable change from the haphazard development of the old Larsa city and seems to imply that a stronger municipal government had taken over control of the street system of Ur” (Woolley Reference Woolley1962: 44). Archaeologists now reject the formerly common assumption that early “disorganized” cities grew organically and that later “organized” cities with orthogonal forms were centrally planned (Smith Reference Smith2003: 225–227; Smith Reference Smith2007). However, many of the strikingly straight and orthogonal, light linear features extending considerable distances across the south portion of the mound could correspond to mudbrick walls of additional houses and structures of Neo-Babylonian date that were constructed according to a new city plan, regardless of whether or not that city plan was “centrally” organized.
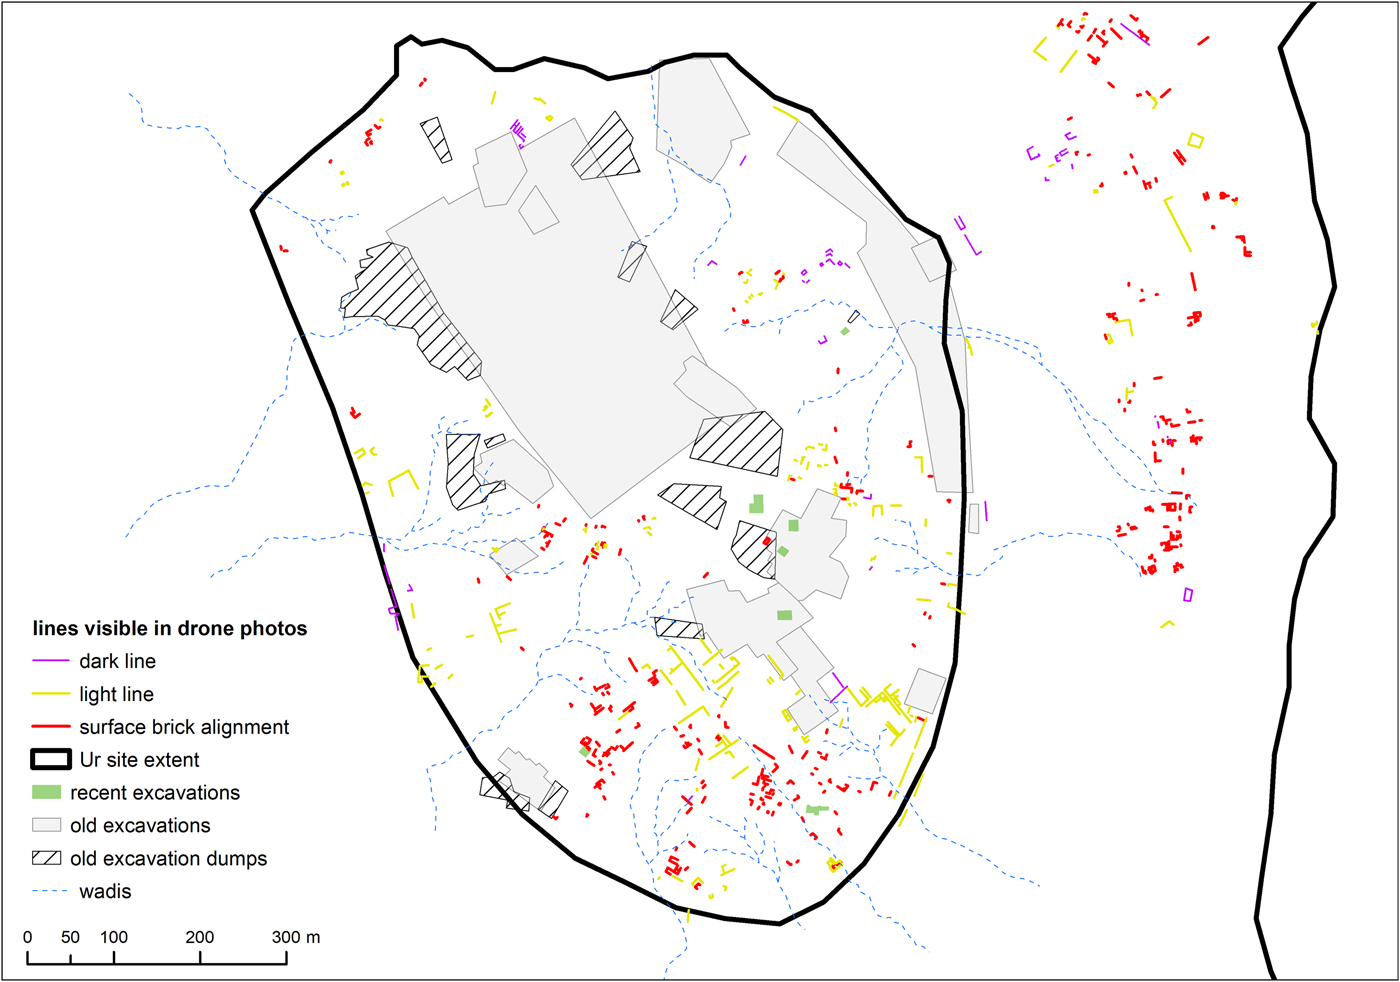
Fig. 10 All architecture traces across Ur mapped from the orthophotos generated from UAV photos taken following a rainstorm. For easier interpretation of this image, see the online colour version.

Fig. 11 Close-up map of architecture traces visible across the south portion of the mound in UAV photos. Many of these are in alignment with Neo-Babylonian houses excavated by Woolley in Area NH, shown in the center-top of the figure. For easier interpretation, see the online colour version.
The surface baked brick alignments on the south portion of the mound are considerably shorter and less uniformly oriented, but they tend to be generally more in alignment with the Isin-Larsa/Old Babylonian houses excavated by Woolley in Area AH (Woolley and Mallowan Reference Woolley and Mallowan1976: 12–29, 118–165, pl. 124). The AH houses had substantial baked brick foundations (Woolley and Mallowan Reference Woolley and Mallowan1976: 17–21), and in fact the only substantial baked brick foundations that Woolley noted in his house excavations came from levels from these periods (Stone and Zimansky Reference Stone and Zimansky2016: 255). It thus seems likely that the baked brick alignments mapped across the south portion of the mound show the layout of Isin-Larsa/Old Babylonian houses and structures. However, at this stage it is not possible to rule out the possibility that baked brick could have been “mined” and reused in structures built in later phases of occupation. Excavations provide ample evidence of such practices (e.g., Woolley Reference Woolley1965: 7; Reference Woolley1974: 62).
The distribution of light linear features versus baked brick alignments across the south portion of the mound provides further clues to the relative dating and preservation of these structures. Generally speaking, the light linear features that are in alignment with Neo-Babylonian houses excavated by Woolley in Area NH are found only on the highest parts of the south portion of the mound, where surface erosion is likely to have been less intense—in fact these architectural traces terminate at the edges of the mound where drainage wadis have formed. Surface baked brick alignments are predominantly found on the sides of the mound, where erosion is likely to have been more intense. In their 2017 excavations on the south slope of the mound, the Munich University team encountered baked brick foundations of Old Babylonian date at the surface. The spatial pattern of architectural traces in relationship to topographic slope generated from UAV photos (Fig. 12) suggests that the light linear features are likely to be of later date than the surface baked brick alignments.
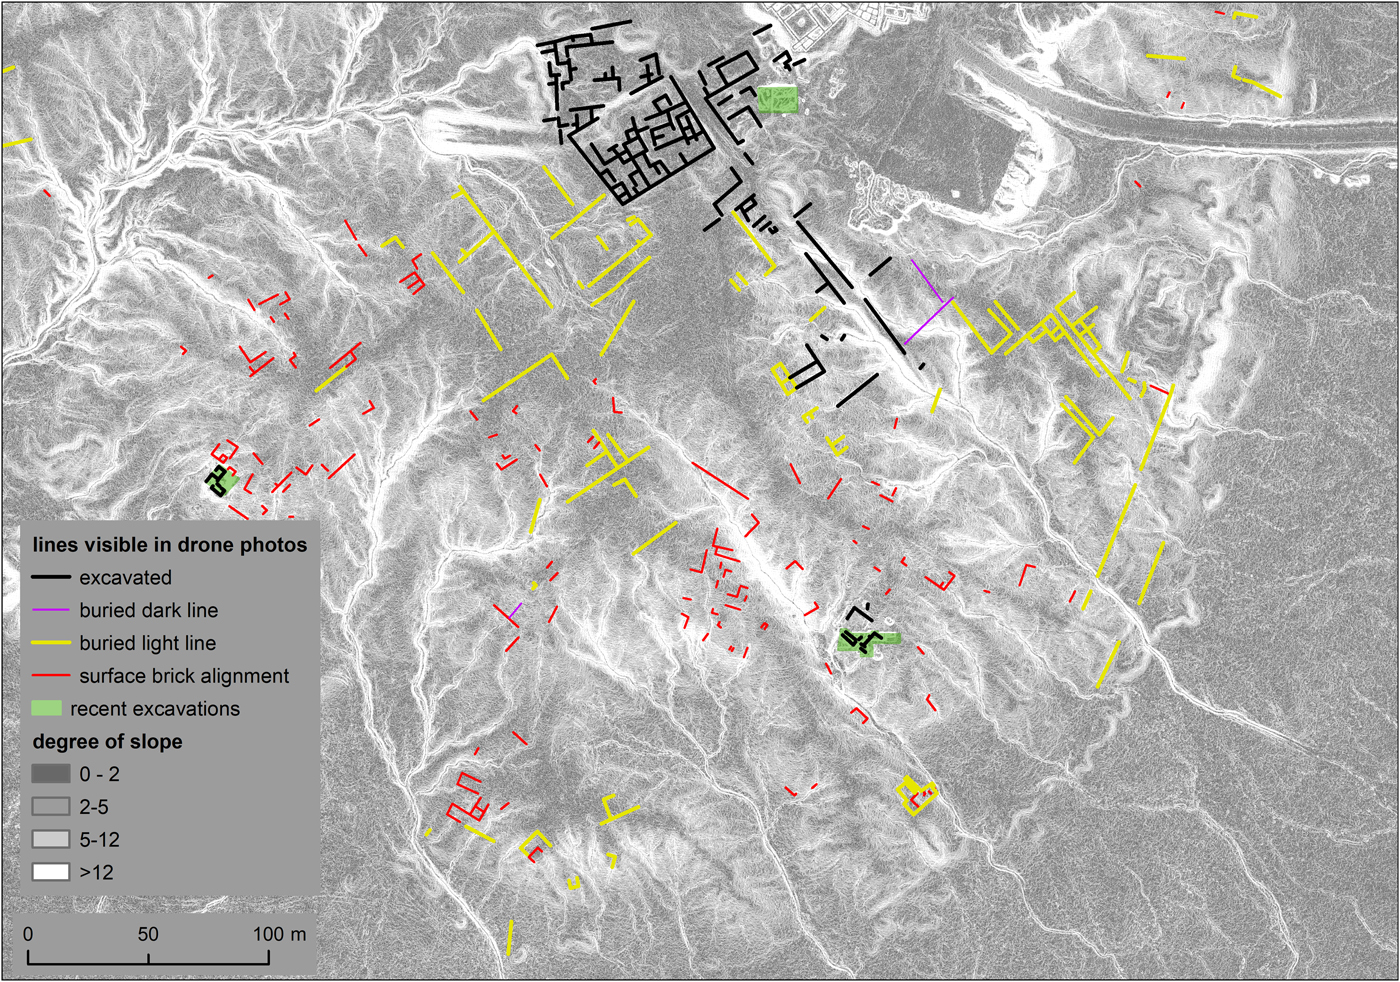
Fig. 12 Degree of slope across the south portion of the mound, generated from UAV photos, showing that long light linear features in alignment with Neo-Babylonian houses occur in flatter areas that are less subject to erosion. Baked brick alignments occur on the mound slopes where erosion is more severe. For easier interpretation, see the online colour version.
The Neo-Babylonian street at the center of the area excavated by Woolley aligns with a deep gully leading to a break in the city wall, visible in the topographic slope map. This suggests that the Neo-Babylonian street could have led to a city gate. It also demonstrates how the latest phases of habitation at a multi-period site like Ur can affect site formation processes.
Open excavation trenches and excavation dumps cover a large percentage of the north portion of the mound, leaving few areas where surface and near-surface features might be preserved or visible. A few light linear features, dark linear features, and surface baked brick alignments are visible in a variety of orientations to the west and east of the temenos and on the edges of the mound. Many of these features are too fragmentary and scattered for interpretation at this stage. However, three concentrations of features are noteworthy: one at the southwest slope of the north portion of the mound, to the southwest of the temenos, a second on a relatively flat area to the east of the temenos and to the west of the Kassite fort and houses on the city wall, and a third along the western edge of the north portion of the mound. The first concentration consists of baked brick alignments and light linear features outlining small interior spaces. It lies directly to the south of Woolley's Area EM, a neighborhood of Isin-Larsa/Old Babylonian houses, and could represent an extension of this residential district. The outlines of what may be a larger building sit to the southwest, on the edge of the north portion of the mound. The second concentration of baked brick alignments and both dark and light linear features also outline small interior spaces and therefore could represent a residential neighborhood, though one of uncertain date. The third concentration consists of dark and light linear features and represents structures associated with the city wall, some of which were quickly cleared and partially excavated by Woolley, although not mapped.
Abundant architectural remains, especially surface baked brick alignments, are also visible on and surrounding a small mound to the east of the main mound (Fig. 13). Woolley did not investigate this area, and Wright did not mark it during his regional survey. It will be a priority for survey investigation in future seasons. Like the surface baked brick alignments carpeting the south portion of the mound, the alignments visible on this small east mound are likely to show the layout of Isin-Larsa/Old Babylonian houses and structures. A few long, light linear features on the small east mound and to its northeast are, remarkably, almost exactly in alignment with similar features adjacent to the Neo-Babylonian houses excavated in Area NH, c. 750 meters away, and could also represent an extension of the Neo-Babylonian city plan off the main mound.

Fig. 13 Close-up map of architecture traces visible across the mound to the east of the main mound. For easier interpretation, see the online colour version.
On the basis of the mapped surface and near-surface architecture, Ur may have expanded considerably beyond its city walls in its later periods of inhabitation. A conservative, incomplete estimate of the extramural area with surface architecture elevates Ur's minimum size from 60 to 103 hectares. The area of surface baked brick alignments to the east of the main mound could have continued further to the north before modern construction flattened them.
Data collected from the UAV photos also allow for the generation of information on Ur's most famous building, the ziggurat. The high resolution digital elevation model shows that, as currently reconstructed, its volume is c. 35,000 m3. The measurements of a baked brick from the ziggurat stamped with an inscription of Ur-Nammu, held by the British Museum, are 30 x 30 x 6 centimeters. Assuming a brick size of 5400 cubic centimeters, the construction of the ziggurat would have required roughly 6.5 million bricks.
Field Survey Results
The soil discoloration in U2 and GAMBIT imagery formed the basis of an off-mound survey to determine if settlement extended beyond the mound in some periods. At this stage, the results from the systematic site survey remain very preliminary and confined to the south portion of the mound. The results thus far primarily show the effectiveness of the methods and suggest the extent of settlement and/or associated activities off the south portion of the mound. A more through presentation of the data awaits additional fieldwork and ceramic analysis.
The pottery counts from the surface collections and test pits track each other, demonstrating that both methodologies show the same relative differences in ceramic density (Fig. 14). Dating of the pottery collections is ongoing. The majority of the recognizable diagnostics from both surface collections and test pits are from the Old Babylonian period and later. Thus, the material collected on and around the south portion of the mound will likely be of limited use for assessing earlier urban extent and organization, at least in this part of the site. Further to the north, however, the situation could change, especially as the survey continues on the sides of the mound that are closer to the site's original core. The earliest phases of the site's inhabitation are likely too deeply buried for a representative sample to appear except in certain disturbed areas, but more material from the third millennium B.C. might be present elsewhere.

Fig. 14 Preliminary results of the survey: count (left) and weight (right) of diagnostic pottery from surface collection units compared to count (left) and weight (right) of all pottery from test pits. Substantial surface and near-surface artifact scatter continues a significant distance from the edge of the south portion of the mound.
The ceramic densities recorded already suggest that Ur's inhabited area extended a significant distance off the south portion of the mound. The survey recorded a steeper drop-off in ceramic density to the south than to the west or east; in fact the survey has not yet reached the edge of the dense ceramic scatter in the latter two directions. However, settlement or other activities appear to have extended up to 250-300 m south of the mound, more than 250 m east of the mound, and more than 300 m west of the mound during the Old Babylonian period and later. Unfortunately the surface collection did not yet reach the area with surface architecture to the east of the main mound.
Watercourses near Ur
U2 and GAMBIT imagery also reveal the hydrological situation around Ur. Given the regional scale of the Ur-Eridu basin survey map, Wright did not include much detail concerning the ancient watercourses in the immediate vicinity of Ur (Reference Wright and Adams1981: 299). Both U2 and GAMBIT show several previously untraced watercourses on all sides of the main mound. Most significantly, these imagery sources show a watercourse following the east side of the north portion of the mound that, based on its position, might have fed the canal separating the north and south portions of the mound. This watercourse is also visible, albeit in less detail, on CORONA imagery. Woolley knew of this relict watercourse (Reference Woolley1930), though he did not include it in his maps. Additional smaller watercourses are visible only in UAV imagery in this area. Although a definite connection is not visible in the imagery, this watercourse could have been fed from the northwest of Ur, where another relict channel is visible and intersects the north portion of the mound at its northwestern corner.
The highest resolution imagery also shows much smaller hydrological features. Connected to a c. 400 meter-long stretch of the northwest channel are the traces of a relict field system and a set of orthogonal distributary canals, visible in both GAMBIT and UAV imagery. Traces of another relict field system, best visible in GAMBIT imagery, are associated with two relict channels to the south of the main mound (Fig. 15). The dating of these channels and field systems will be investigated through future survey and geoarchaeological work. A wider view of watercourses in the Ur region requires an expansion outward to the regional scale of investigation.

Fig. 15 Relict watercourses in the immediate vicinity of Ur, as visible in U2, GAMBIT, and UAV imagery. The watercourse on the east side of the north portion of the mound could have fed the canal separating the mound's north and south portions. UAV imagery shows relict field systems along the watercourse to the northwest of the Ur main mound. GAMBIT imagery shows relict field systems along two watercourses to the south of the main mound. The base image is from GAMBIT (2-standard deviation histogram stretch).
Part 2: The Landscape of the Ur-Eridu Basin
Ur is located ten kilometers south of the modern course of the Euphrates and fifteen kilometers southwest of the modern city of Nasiriyah. Today, it sits just outside the cultivated area, within a large basin bounded to the north by the modern Euphrates levee and to the south by limestone bedrock outcrops and the sand dunes and salt flats of the North Arabian desert. This basin also hosted the important Mesopotamian city of Eridu (Tell Abu Shahrein), nineteen kilometers southwest of Ur. The Ur-Eridu basin is divided by a sandstone ridge that separates the area around Eridu from the main part of the Euphrates alluvium, creating a “cul-de-sac” southeast of Eridu (Fig. 16).
Fig. 16 Overview map of the Ur-Eridu basin showing major topographic features, the boundaries of Wright's survey area, and the greatest northwestern extent of the Gulf around 4000 B.C. according to the reconstructions of Pournelle (Reference Pournelle2003). 30-meter data from the Shuttle Radar Topography Mission has been clipped to show slight differences in elevation.
The location of sites in the Ur-Eridu area, historical imagery, and topographic data show that ancient courses of the Euphrates flowed near to Ur and Eridu at various points in time. Because the twin rivers of Mesopotamia in their southern reaches seasonally flooded and created raised levees, regional topographic datasets can often show the rivers’ former courses (Hritz Reference Hritz2010; Hritz and Wilkinson Reference Hritz and Wilkinson2006). In a digital elevation model where slight topographic differences have been exaggerated (Fig. 16), the levees of ancient courses of the Euphrates that flowed towards Ur and Eridu are visible in a northwest-southeast orientation. To the southeast of Ur lies a slight depression. The coastline of the Gulf extended significantly further to the northwest in antiquity than it does today, due to higher sea level and a landscape that had not yet been blanketed by depositions of silt resulting from upstream irrigation agriculture (Sanlaville Reference Sanlaville1989, Reference Sanlaville, Nicholson and Clark2003). According to Pournelle's reconstructions, this depression, plus marine sediments in geological cores from the region and the presence of former beach ridges, indicate that around 4000 B.C. the coastline of the Gulf extended close to Ur (Pournelle Reference Pournelle and Crawford2013). However, other lines of evidence, such as the study of salt and freshwater fish remains and a critical analysis of references in cuneiform texts to “the sea”, suggest that the Gulf shoreline could not have extended close to Ur and Eridu (reviewed in Potts Reference Potts1997: 30–39). The nature of the ancient environment in the Ur-Eridu area at various points in time thus remains an open question.
Henry Wright was the first to map ancient watercourses in the Ur-Eridu basin, tracing them from high-resolution aerial photographs accessed after the conclusion of his ground survey (Reference Wright and Adams1981: 299). These photographs unfortunately no longer exist (Pournelle Reference Pournelle2003: 46). Wright's map clearly shows the general northwest-southeast orientation of ancient channels of the Euphrates that flowed near to Ur, Eridu, and on the south side of the sandstone ridge dividing the basin. The remains of the Eridu channel curve significantly to the south, following the edge of the basin. The 192 sites recorded by Wright's ground survey are located on and sometimes even within the path of these former watercourses.
The published data from Wright's ground survey were, by his own admission, minimal (Reference Wright and Adams1981: 297–298, 300), including little more than an estimation of site size and mound height, periods represented among surface diagnostics, site size estimates for inhabited periods, and a description of any special artifacts or features of interest. As the publication maps were produced before civilian use of GPS, site locations are approximate. Still, these data are important for their comparability to the surveys of Adams and others in the central part of the southern Mesopotamian plain (Adams Reference Adams1965, Reference Adams1981; Adams and Nissen Reference Adams and Nissen1972; Gibson Reference Gibson1972). For the Ur-Eridu basin, the data clearly show a local peak in settlement numbers and total settled hectares in the Late Larsa/Old Babylonian period (Ur Reference Ur and Crawford2013a).
Given the central role that the Ur-Eridu area plays in arguments about the environmental setting of early Mesopotamian cities and in our understanding of demographic trends in early complex societies, it is important to reassess and enhance Wright's survey in relationship to newly acquired data, including recently declassified aerial and satellite imagery from the 1950s and 1960s. The historical imagery allows us to add specific details about site size, morphology, and relationship to relict channels. Archaeologists now approach the question of site size in a more empirical and expansive way than they did at the time of Adams’ and Wright's surveys, taking into account not only the mounded tells typically measured by these early surveyors, but also the un- or barely-mounded areas around them that represent residential neighborhoods and lower-density urban spaces. These areas typically must be mapped through systematic surface collections like the one just begun at Ur, as such investigations can show changes in ceramic density by period and changes in artifact densities that may represent distinct activity areas (Carter Reference Carter1989–90; Finkbeiner Reference Finkbeiner1991; Gibson Reference Gibson1972; Stone and Zimansky Reference Stone and Zimansky2004; Ur et al. Reference Ur, Karsgaard and Oates2007). However, some “lower towns” and lower-density urban areas can appear clearly in aerial or satellite imagery and may be remotely documented for future ground investigations.
Regional Mapping Methods
U2, GAMBIT, and CORONA imagery were visually “surveyed” in GIS in order to fully map archaeological sites and ancient watercourses. U2 and GAMBIT resolve much more detail than CORONA and were therefore inspected first. For this initial stage of study, only a portion of Wright's original study area has been reassessed and mapped. The reassessed area includes that covered by the GAMBIT image and by U2 frames 1347–1354. This strip of ground covers sixty-six sites in the central part of Wright's survey area. A full reassessment of the survey area is forthcoming. An interactive webmap of the historical imagery and of the reassessed survey results may be consulted on ArcGIS Online: https://arcg.is/v504j
Sites and watercourses typically appear in the historical panchromatic imagery as dark soil discolorations. Some sites are clearly visible through mounding or through a combination of mounding and soil discoloration (Fig. 17). Many of the mapped sites and watercourses could be matched with features documented by Wright, while others are potentially sites and channels that were either missed or mis-recorded by his survey.

Fig. 17 Example of an Ur-Eridu survey site, visible through soil discoloration and mounding in U2 (right) and GAMBIT (left) imagery (both displayed with a 2-standard deviation histogram stretch). This is Wright's site 13, an unnamed site with surface ceramics of the Late Larsa, Kassite, and Neo-Babylonian periods. In this case the imagery adds to our knowledge. The morphology and environmental situation of the site were not recorded by Wright, but are clearly visible here: a low mound on a levee with a “lower town” surrounding it.
Tracing ancient watercourses, both natural and artificial, is often not straightforward. The taphonomic processes that have differentially affected parts of the Ur-Eridu basin sometimes make these features so diffuse that they can be difficult to trace. In other places where watercourses remain distinct, multiple phases of channel shifts may be visible on the surface and therefore difficult to accurately represent in drawn map format. Less than seven to eight years separate the U2 and GAMBIT or CORONA imagery, but the differences in these images show that the visibility of archaeological landscape features can change drastically in short periods of time. For example, some channels were more visible in 1959 because sand had shifted over them by 1966 (Fig. 18). This demonstrates that the use of just one historical imagery dataset is insufficient to fully document historical watercourses. Wright only had access to one set of aerial photos, and some subsequent work has relied on high-resolution CORONA (Al-Dafar Reference Al-Dafar2015; Pournelle Reference Pournelle2003), which only provides images of the Ur-Eridu area for 1968–1969 (May 1968, August 1968 and 1969). The availability of U2 and GAMBIT thus allows for a more complete mapping of ancient channels.

Fig. 18 When tracing ancient watercourses, the complementarity of U2 (1959) and GAMBIT (1966) imagery becomes clear. In this pair of images, of an area approximately 6 kilometers southwest of the Ur ziggurat in the vicinity of Wright's Site 82, channels in the southwest corner were more visible in 1959 because sand had shifted over them by 1966. But the 1966 image shows other channels more clearly in the northwest corner of the image that appear only faintly in the 1959 image. Both images are displayed with a 2-standard deviation histogram stretch.
Furthermore, the mapping of ancient watercourses requires care to ensure that relatively modern canal and drainage systems are not included. These systems tend to have a narrower profile than more ancient watercourses and also tend to differ in their orientation. As illustrated in Wright's original survey map, the major ancient channels in the Ur-Eridu basin tend to have a northwest-southeast path. Because of the position of the Euphrates over at least the last several centuries, more recent watercourses in the area tend to be oriented north-south or north-northeast-to-south-southwest. For this reason, any channels with those orientations were not included in the map of ancient watercourses. U2 imagery was particularly useful for identifying twentieth-century field and irrigation systems that had gone out of use and looked potentially “archaeological” in later GAMBIT, CORONA, and DigitalGlobe imagery.
Regional Landscape Results
The systematic inspection of GAMBIT and U2 imagery allows a new archaeological assessment of the Ur-Eridu basin. New details gleaned from the imagery, including the potential sizes, morphologies, and relationship to relict channels, for both twenty-five newly documented potential sites and sixty-six Ur-Eridu survey sites, are presented in both map and table format (Fig. 19, Table 1) as well as in an interactive webmap (link above). These new details frequently include the presence of lower towns and the situation of mounds on or off specific river levees and canals. Many of the newly documented potential sites would be difficult if not impossible to survey today because they are located in areas that have been radically transformed by agriculture and the Talil Air Base.

Fig. 19 New map of ancient settlements in the Ur-Eridu basin. This area contains 66 of Wright's survey sites. 32 of these sites are visible in the imagery and therefore can be precisely located. The other 34 sites are not visible in the imagery and have been placed relative to surrounding sites, watercourses, and topography. Relict watercourses and 25 possible new sites visible in the U2 and GAMBIT imagery have been traced. An interactive version of this figure is available on ArcGIS Online: https://arcg.is/v504j
Table 1 Information on Wright's sites and possible new sites, with notes on sites’ environmental positions and visibility on U2, GAMBIT, and Digital Globe imagery. The “Corrected” column indicates if a site was visible in imagery and therefore could be precisely located (=1); not visible in imagery and position was corrected relative to features mentioned in the “Notes” (=2); or not visible in imagery and position is likely to only be approximate for reasons mentioned in the “Notes” (=3). “New” indicates newly mapped possible sites, with accurate spatial information. The visibility columns indicate whether the site was visible in that type of imagery (=1), not visible even though imagery covered the area (=0), or not covered by that type of imagery (=X). Some sites “will be” covered by U2 imagery when more of that imagery is processed. Size estimates on the basis of mounding and soil discoloration visible in imagery are only available for “new” sites and for Wright sites that could be precisely located on the imagery.

The twenty-five newly documented potential sites (numbers 200–224) are clustered in the area around Ur and the area where the Eridu branch of the Euphrates formerly broke through the sandstone ridge separating the Ur and Eridu portions of the basin (Fig. 19). These potential sites are mostly small mounds adjacent to relict watercourses, marked by dark soil discoloration, and mostly under 1 hectare in size (but with some in the 2–2.5 hectare range). One potential new site (206) northwest of Site 81 shows the soil mark outlines of a large rectilinear structure measuring at least 110 m by 65 m, partly erased by (or built into?) a relict watercourse. Three of the newly documented potential sites were previously noted by another team using GAMBIT imagery (Benati et al. Reference Benati, Leoni and Mantellini2016). These three sites (213, 214, 215) are located along the north side of a watercourse to the south of Ur. Since the sites identified by Wright along the south side of this watercourse (13, 14, 109) all date to the late Larsa period (with some Neo-Babylonian pottery at sites 13 and 109 and some Kassite pottery at site 13), it seems likely that the three sites identified by Benati et al., plus a fourth site newly identified here (216), also date to the late Larsa period.
Of the sixty-six Wright sites located within the area reassessed using imagery, thirty-two appear clearly in the imagery and are thus securely located. For the purposes of presenting a more accurate map of locations (Fig. 19), the positions of the other thirty-four sites have been “corrected” on the basis of their relative position to relict channels and other sites, as traced in the original survey map (Wright Reference Wright and Adams1981: 299). This may not be an accurate method, since Wright only had access to the aerial photos from which he traced the relict channels after the conclusion of his survey. Depending on the relative accuracy of the final survey map, it is possible that some of the “newly documented” possible sites are in fact among Wright's originally documented sites, but that the position on the final survey map was not correct. Without fuller descriptions of site morphology, it could be difficult to match them to surveyed sites.
The high resolution of the U2 and GAMBIT imagery shows many previously unrecognized relict watercourses. Many sites are located at the intersection of two or more watercourses, and some of the major distinct groups of watercourses have other previously unmapped watercourses linking them. The images also enable a better measurement of the width of the relict water courses, which are not always represented in Wright's map. Wright's tracing of the watercourses is in its broad outlines, however, largely consistent with what is visible in U2 and GAMBIT imagery.
One place where U2 imagery reveals a very different hydrological situation than that represented in the Wright map is the region just north of the “cut” in the sandstone ridge, in the area between Sites 15, 88, 111, 29, and 127 (Fig. 20a and b; GAMBIT imagery does not cover this area). Wright's map represents Sites 15 and 88 as located along a single watercourse, with Site 111 slightly removed from this watercourse and Sites 29 [Woolley's Merejib (Woolley Reference Woolley1955)] and 127 located on a different watercourse to the south (Reference Wright and Adams1981: 299). However, U2 imagery suggests that Sites 15, 88, and 111 were located along three separate watercourses and that Sites 88, 29, and 127 were located along the same watercourse. Further, the imagery shows at least five areas of mounding and soil discoloration along the Site 88 and Site 111 watercourses that could be additional sites (219, 220, 221, 222, 223). The Site 88 watercourse looks like a canal. Unlike many other watercourses mapped, it appears to be bordered by dark soil accumulations from channel cleaning. Most significantly, the tracing of channels in this area suggests that there were not one but two “cuts” through the sandstone ridge that served as exits for the Eridu branch of the Euphrates at various points in time. The major cut, discussed by Wright, is marked by the scars of a major relict channel and lined by Sites 131–135 (Reference Wright and Adams1981: 300–301). Another minor cut that may have had water flowing through it lies 3.3 km to the northwest. U2 imagery is not particularly clear in this area but faintly shows a small channel, also visible in CORONA imagery, that flowed through this topographical break in the ridge and may have ultimately connected the Ur and Eridu branches of the Euphrates (Fig. 20c).
Fig. 20 A) Hydrological situation surrounding Sites 29, 88, 11, and 127, which differs from that mapped by Wright. Base imagery from U2 mission 8648. B) Possible canal extending from Site 88 to two nearby possible sites (219, 220) that were not marked by Wright. Base imagery from U2 mission 8648, displayed with a 2-standard deviation histogram stretch. C) Possible second exit for the Eridu channel of the Euphrates through a second breach in the sandstone ridge, which contains traces of relict channels that are much smaller than those at the breach marked by Wright to the south. Base imagery from CORONA mission 1103, displayed with a 2-standard deviation histogram stretch.
This additional break in the sandstone ridge is significant because, according to Wright's environmental narrative for the survey area (Reference Wright and Adams1981: 300–301), seasonal flooding of the Euphrates would have caused a freshwater lake or marsh to form in the basin's “cul-de-sac” southeast of Eridu, and this lake or marsh could have only drained through the breach (now breaches) in the sandstone ridge.
Conclusions and Future Work
The survey and imagery analysis presented here provide a more detailed picture of the size of Ur, its urban organization, and the settlement pattern characteristics of the Ur-Eridu basin. This is the type of data archaeologists must keep collecting in order to ask questions about the site's demographic and urban history and to put our knowledge of Ur on par with our knowledge of places like Tell Brak in northern Mesopotamia that have been much more intensively studied using a range of landscape archaeology methods in recent decades. Further imagery reassessment is needed across the remainder of Wright's survey area, and further ground survey is needed across other areas of the site. If time and resources allow, the sampling interval of the surface collection units should be increased to 50 meters. This work continued in Spring 2019.
The first results are already promising; they allow us to integrate old and new datasets, to begin to empirically assess Ur's extramural size, to investigate the ancient environment, and to trace quite a bit of buried architecture that likely reveals aspects of city organization in the second and first millennia B.C. The reassessment of the Ur-Eridu sites via historical imagery has identified potential new sites and has mapped new relict watercourses that clarify the environmental situation of sites already known from Wright's survey. In particular, this mapping of relict channels suggests that there were not one but two outlets for the Eridu branch of the Euphrates, across adjacent breaks in the sandstone ridge separating the Ur and Eridu basins. The UAV survey of Ur itself shows that the site has at least forty-three additional hectares of previously unmapped surface architecture that likely dates to the Late Larsa/Old Babylonian and Neo-Babylonian periods. The surface ceramics collection suggests that some settlement and activity areas could have extended across an additional area of c. twenty hectares around the south portion of the mound that does not have surface architecture. Together, these newly documented details bring the minimum size of Ur to around 120 hectares, doubling the size as estimated by Wright. Historical imagery and topographical models generated from UAV imagery suggest that the Diqdiqqah area to the northeast of the Ur temenos was a part of Ur itself, at least in some periods, and was inhabited at variable density/intensity. If the ground survey in the future verifies this hypothesis, Ur may have approached 500 hectares. Depending on the date of habitation of various surveyed areas like Diqdiqqah, Ur might have been, contrary to previous conclusions, among the largest of the third-first millennium B.C. Mesopotamian cities.
Acknowledgements
The Oriental Institute of the University of Chicago generously provided funding for the first year of survey at Ur. I thank the Ur Excavation Team, especially Elizabeth Stone, Paul Zimansky, Abdulamir al-Hamdani and William B. Hafford, for enabling my participation in the field project. I also thank the State Board of Antiquities and Heritage of Iraq, especially Ur's Reference Ur2017 representatives, Haidar Mohammed Nasr, Mundadher Majid Kamil, and Fadhil Hassan, for their role in facilitating all of our work. Without the assistance of Imad Ali Abdul Hussein and his DJI Phantom 4, it would have been impossible to collect high-resolution imagery of Ur. Various archaeology students from Nasiriyah helped collect survey data from the collection units, especially Karrar Jamal Abdul Ghani and Karrar Abd Ali Kiwali. The National Archives’ Aerial Film Section in Greenbelt, Maryland, enabled access to U2 imagery used in this article. I thank the staff of that facility, especially Gerald Luchansky and Andrew Knight, for their assistance. KH-7 GAMBIT imagery, KH-4B CORONA imagery, and Shuttle Radar Topography Mission data appear courtesy of the US Geological Survey (USGS). The text of the article benefitted from comments provided by William B. Hafford, Jason Ur, and two anonymous reviewers.


