


Introduction
Echinococcus granulosus sensu lato (s.l.) is a tapeworm that causes cystic echinococcosis (CE). It is distributed in both livestock and humans worldwide (Addy et al., Reference Addy, Wassermann, Kagendo, Ebi, Zeyhle, Elmahdi, Umhang, Casulli, Harandi, Aschenborn, Kern, Mackenstedt and Romig2017). It is quite widespread in countries where pastoral activities are more common. E. granulosus s.l. consists of five cryptic species on the basis of mitochondrial (mt) and nuclear DNA sequences: E. granulosus sensu stricto (s.s.) (genotypes G1 and G3), E. equinus (genotype G4), E. ortleppi (genotype G5), E. canadensis (genotype G6–G10) and E. felidis (Wen et al., Reference Wen, Vuitton, Tuxun, Li, Vuitton, Zhang and McManus2019).
A report on food-borne parasites in humans listed CE as the second most serious disease from such parasites [EFSA Panel on Biological Hazards (BIOHAZ) et al., Reference Koutsoumanis, Allende, Alvarez-Ordóñez, Bolton, Bover-Cid, Chemaly, Davies, De Cesare, Herman, Hilbert, Lindqvist, Nauta, Peixe, Ru, Simmons, Skandamis, Suffredini, Cacciò, Chalmers, Deplazes, Devleesschauwer, Innes, Romig, van der Giessen, Hempen, Van der Stede and Robertson2018]. Wild carnivores and dogs are the definitive host, and the intermediate host are livestock species while accidental intermediate hosts are humans in the parasite's life cycle. Contaminated water and food with parasite eggs are responsible for human infection after ingestion. Typically, the development of the hydatid cyst affects the lungs and liver of the intermediate host. The cycle continues until a carnivore ingests the infected host's fertile cyst (Kinkar et al., Reference Kinkar, Laurimae, Simsek, Balkaya, Casulli and Manfredi2016). The rate of spread of E. granulosus s.s. (genotypes G1 and G3) has increased in domestic and wild animals of South America and Central Asia. It is also involved in 88% of human infection worldwide (Kinkar et al., Reference Kinkar, Laurimae, Sharbatkhori, Mirhendi, Kia and Ponce-Gordo2017).
At least 270 million people (58% of the total population) in Central Asian countries such as Pakistan, Iran, Afghanistan, Turkmenistan, Mongolia, Tajikistan, Kazakhistan, Kyrgyzstan and China are at risk of CE (Zhang et al., Reference Zhang, Zhang, Wu, Shi, Li and Zhou2015). Southwestern part of the China is one of main affected regions of CE infections, where it has been reported in 20 provinces. Climate change and geologic events may be responsible for the high level of species biodiversity in that area (Wang et al., Reference Wang, Wang, Hu, Zhong, Wang, Gu and Yang2014a, Reference Wang, Huang, Huang, Yu, He and Zhongb). In Iran, the prevalence of CE have been reported in 5.1–74% of sheep, 1.7–20% of goats, 11.4–70% of camels and 3.5–38.3% of cattle (Sharbatkhori et al., Reference Sharbatkhori, Mirhendi, Harandi, Rezaeian, Mohebali, Eshraghian and Kia2010). Further, humans are greatly affected by CE (Shahnazi et al., Reference Shahnazi, Hejazi, Salehi and Andalib2011).
Hydatid cysts were found in 12.2% (28/230) of sheep and 10.7% (21/197) of goats in Kangra Valley of the northwestern Himalayas, India (Moudgil et al., Reference Moudgil, Moudgil, Asrani and Agnihotri2019). Moreover, in northern India 4130 animals were examined, 66 (1.6%) were positive for hydatid cysts. The occurrence of CE was 5.39%, 4.36%, 3.09%, 2.23% and 0.41% in cattle, buffaloes, pigs, sheep and goats, respectively (Singh et al., Reference Singh, Sharma, Tuli, Sharma, Bal, Aulakh and Gill2014). Out of 1429 human samples from Kashmir, North India, 72 (5.03%) were immunoglobulin G-positive by enzyme-linked immunosorbent assay (Fomda et al., Reference Fomda, Khan, Thokar, Malik, Fazili, Dar, Sharma and Malla2015). Hydatidosis causes US$212.35 million economic losses annualy in India (Singh et al., Reference Singh, Dhand, Ghatak and Gill2013).
CE in humans has been documented all over the Pakistan, including the Lahore, Karachi, Hyderabad, Peshawar and Punjab Sindh provinces (Khan et al., Reference Khan, Ahmed, Khan, Saleem, Simsek, Brunetti, Afzal, Manciulli and Budke2020). In Karachi, more than 225 CE cases were reported over a 10-year period (Butt and Khan, Reference Butt and Khan2020). In Pakistan, CE cases increases day by the day and cause health issues, and the annual economic losses of the livestock sector are about US$26.5 million (Haleem et al., Reference Haleem, Niaz, Qureshi, Ullah, Alsaid and Alqahtani2018).
Currently, livestock import and export has increased between Pakistan and its neighbouring countries such as Iran, India and China. This is the main reason for the genetic variation and gene flow among Echinococcus spp. isolates, as in Iran (Spotin et al., Reference Spotin, Mahami-Oskouei, Harandi, Baratchian, Bordbar, Ahmadpour and Ebrahimi2017). However, there is currently no comparative study on the population structure and genetic variability of Echinococcus spp. in the above geographic line.
The objective of the current study was to compare the mt gene sequences (co1, cytb, and nadh1) belonging to E. granulosus s.l. human isolates in Pakistan with published sequences from China, Iran and India to track the evolutionary history of CE isolates that have drifted among these regions.
Materials and methods
Data collection
The dataset was created from E. granulosus s.s. mt-co1 (n = 19), mt-nadh1 (n = 11) and mt-cytb (n = 9) nucleotide sequences and two mt-co1 nucleotide sequences of E. canadensis (G6/G7) isolates of human origin from Pakistan that had been previously submitted by our team to the National Center for Biotechnology Information (NCBI) database. From the NCBI database, we also retrieved 28 mt-co1 (374 bp), 26 mt-nadh1 (743 bp) and 26 mt-cytb (547 bp) nucleotide sequences of E. granulosus s.s. and 12 mt-co1 (366 bp) nucleotide sequences of E. canadensis (G6/G7) isolates based on neighboring countries like Iran, China and India to determine the genealogical relationships (Table 1). The sequence data for each gene fragment from PubMed were searched for the three countries. Based on the search results, sequences with a length close to that of our gene region were selected, and only one of the group sequences was selected for the analysis. The published sequence data were retrieved from NCBI PubMed during May 2020.
Table 1. Pakistani (PK), Iranian (IR), Chinese (CH), and Indian (IND) mt-co1, mt-cytb, and mt-nadh1 gene sequences of E. granulosus s.l.

Data and phylogenetic analysis
We selected 47 mt-co1 (374 bp), 37 mt-nadh1 (743 bp) and 35 mt-cytb (547 bp) nucleotide sequences from E. granulosus s.s. and 14 mt-co1 (366 bp) sequences of E. canadensis (G6/G7) for the analysis. All sequence data were downloaded from GenBank in FASTA format. The files were uploaded to MEGA-X tool for alignment (Kumar et al., Reference Kumar, Stecher, Li, Knyaz and Tamura2018). Sequences of several lengths were aligned using ClustalW to generate output formats such as FASTA and NEXUS for subsequent analysis. The aligned sequences with unequal lengths were trimmed at the ends for equalization. Akaike and Bayesian information criterion analyses were used to analyze the sequences in MEGA-X and most fesible model was obtained while evolutinary tree was obtained separately for each gene region (Kumar et al., Reference Kumar, Stecher, Li, Knyaz and Tamura2018). The statistical analysis for unique clades was run through 1,000 bootstrapping replicates.
Haplotype analysis
The haplotype analysis of the sequences was performed in DnaSP 6 package (Rozas et al., Reference Rozas, Ferrer-Mata, Sánchez-DelBarrio, Guirao-Rico, Librado, Ramos-Onsins and Sánchez-Gracia2017). Using this package, population diversity indices [haplotype numbers (h), nucleotide diversity (π), haplotype diversity (Hd)], neutrality indices (Tajima's D statistics, Fu's statistics), and Fu and Li's D test and F test were performed (Rozas et al., Reference Rozas, Ferrer-Mata, Sánchez-DelBarrio, Guirao-Rico, Librado, Ramos-Onsins and Sánchez-Gracia2017). The NEXUS format for the subsequent analysis was also generated. Later on, networks were constructed with the MSN (minimum spanning networks) (Bandelt et al., Reference Bandelt, Forster and Röhl1999) method using PopART 1.7 software (Leigh et al., Reference Leigh, Bryant and Steel2015).
Results
Neutrality and diversity indices of the sequences from mt-co1, mt-cytb and mt-nadh1 from E. granulosus s.l. isolates from Pakistan, Iran, China and India are shown in Table 2. The mt-co1 gene of E. granulosus s.s. had the highest haplotype diversity. Tajima's D values were observed negative for all of the sequences, indicating purifying selection and/or population expansion. In particular, Fu's F value (−14 106) was quite negative for mt-co1 gene of E. granulosus s.s.
Table 2. DnaSP output showing diversity and neutrality indices.

n, Number of isolates; H, number of haplotypes; hd, haplotype diversity; πd, nucleotide diversity; s.d., standard deviation; FLD, Fu and Li's D* statistical test; FLF, Fu and Li's F* statistical test.
Phylogenetic analysis
Figure 1 illustrates the evolutionary analysis of the E. granulosus s.s. mt-co1 nucleotide sequence (374 bp). Two human (IND1 and IND2) and two buffalo (IND3 and IND4) isolates were identified as the most distant isolates. Figure 2 shows the genetic tree of the E. granulosus s.s. mt-cytb nucleotide sequence (547 bp). The Indian buffalo isolates (IND11 and IND13) were identified as the most distant sequences. The other distant isolates from the main clade were the PK30, PK35, PK28, PK36, PK31 and PK34 isolates (all human). For the E. granulosus s.s. mt-nadh1 nucleotide sequence (743 bp), two Iranian sheep isolates (IR27 and IR30) were identified as the most distant isolates, followed by isolates IR23 (camel) and IR26 (camel) (Fig. 3). Figure 4 shows the phylogenetic analysis of the mt-co1 nucleotide sequence (366 bp) of E. canadensis (G6/G7). The IR37 human isolate was a separate branch from the main clade. The others were in the main clade.

Fig. 1. Phylogenetic tree of E. granulosus s.s. isolates using the mt-co1 gene sequence. MEGA X was used to construct a maximum likelihood tree based on the HKY + I model. The reliability of the tree was assessed by 1000 bootstrap replications. Echinococcus equinus (GenBank accession no. KC953029), E. canadensis (GenBank accession no. KT881547), E. ortleppi (GenBank accession no. KU743926) and E. multilocularis (GenBank accession no. AB461416) were used as reference sequences, while Taenia hydatigena (GenBank accession no. LC500284), T. saginata (GenBank accession no. AB271695) and T. multiceps (GenBank accession no. LC271740) were used as outgroup sequences for phylogenetic tree construction.
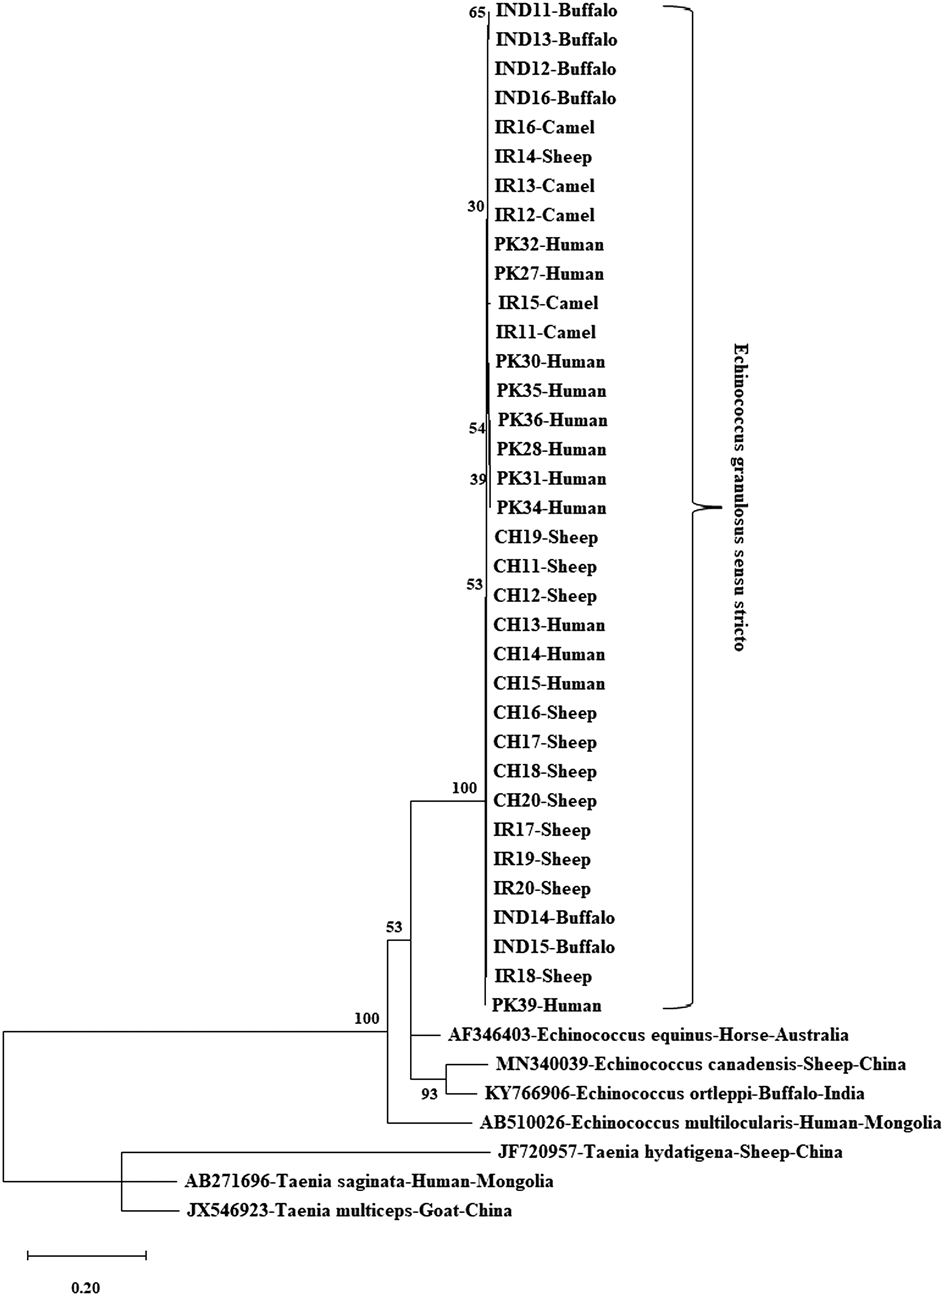
Fig. 2. Phylogenetic tree view of E. granulosus s.s. isolates using the mt-cytb gene sequence. MEGA X was used to construct a maximum likelihood tree based on the HKY + G + I model. The reliability of the tree was assessed by 1000 bootstrap replications. Echinococcus equinus (GenBank accession no. AF346403), E. canadensis (GenBank accession no. MN340039), E. ortleppi (GenBank accession no. KY766906) and E. multilocularis (GenBank accession no. AB510026) were used as reference sequences, while T. hydatigena (GenBank accession no. JF720957), T. saginata (GenBank accession no. AB271696) and T. multiceps (GenBank accession no. JX546923) were used as outgroup sequences for phylogenetic tree construction.
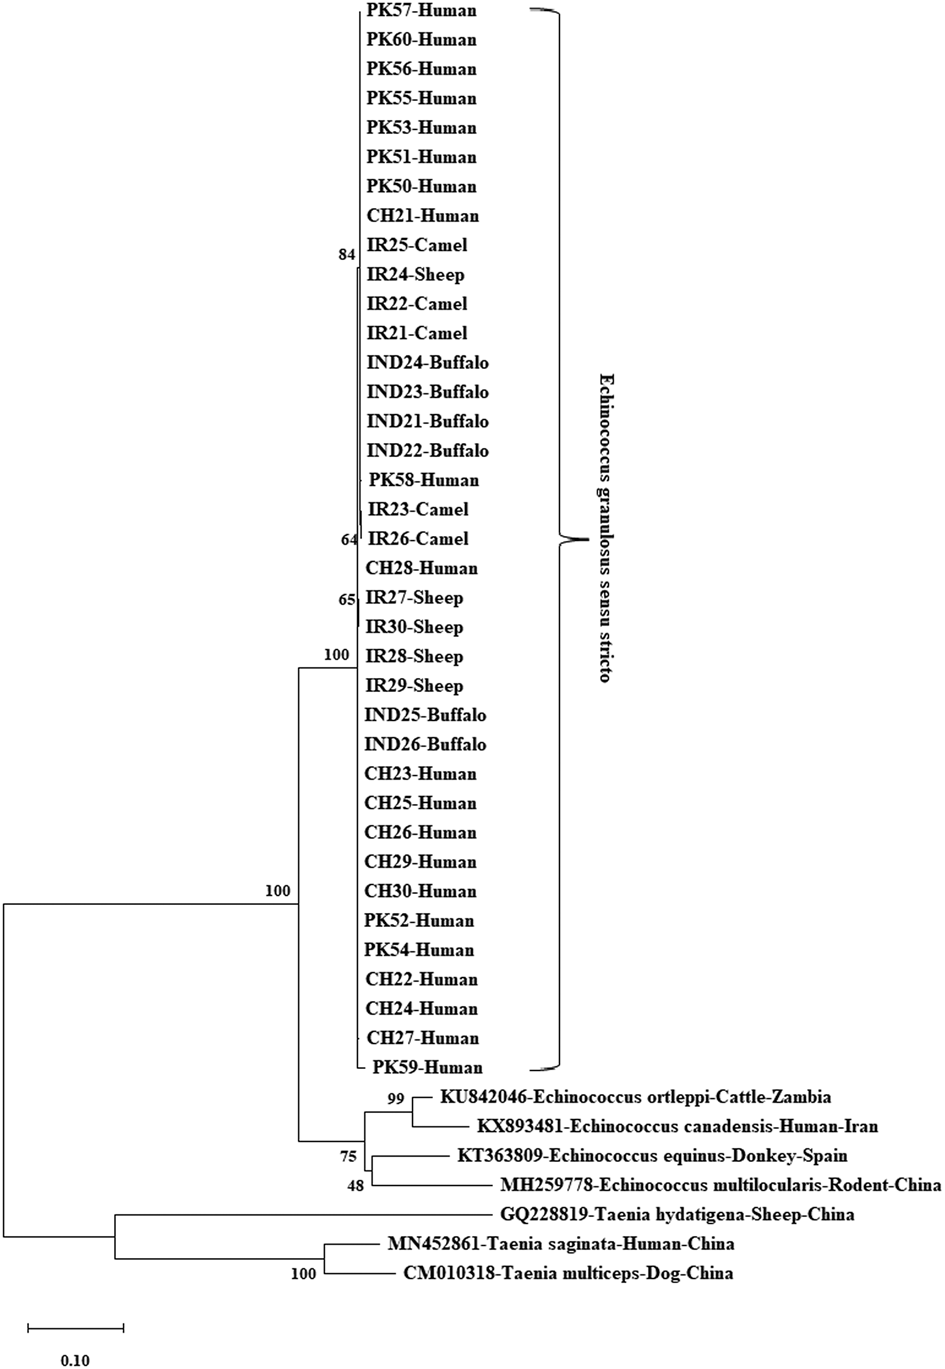
Fig. 3. Phylogenetic tree view of E. granulosus s.s. isolates using the mt-nadh1 gene sequence. MEGA X was used to construct a maximum likelihood tree based on the HKY + I model. The reliability of the tree was assessed by 1000 bootstrap replications. Echinococcus equinus (GenBank accession no. KT363809), E. canadensis (GenBank accession no. KX893481), E. ortleppi (GenBank accession no. KU842046) and E. multilocularis (GenBank accession no. MH259778) were used as reference sequences, while T. hydatigena (GenBank accession no. GQ228819), T. saginata (GenBank accession no. MN452861) and T. multiceps (GenBank accession no. CM010318) were used as outgroup sequences for phylogenetic tree construction.
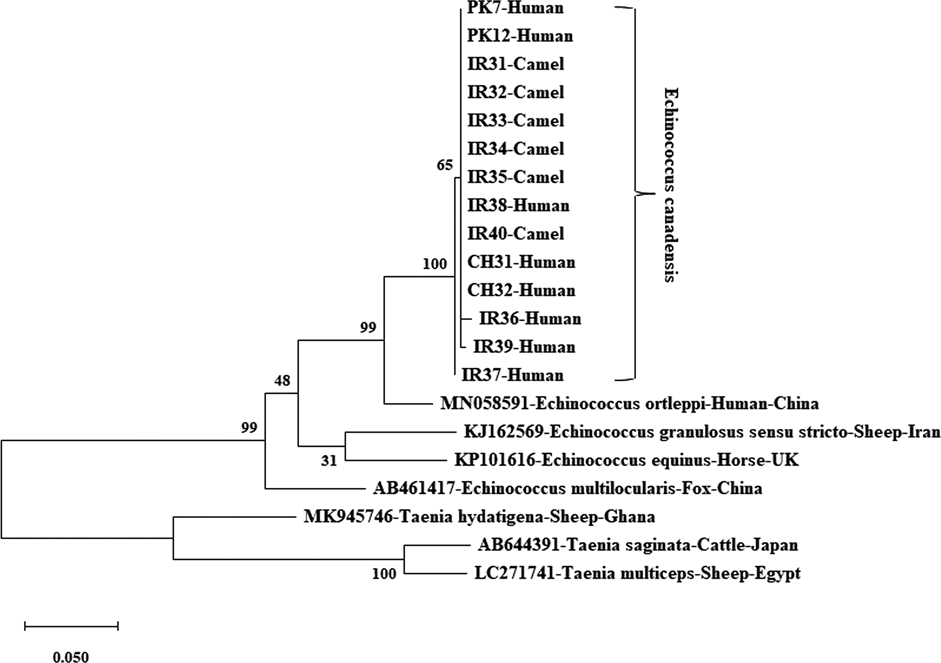
Fig. 4. Phylogenetic tree view of E. canadensis (G6/G7) isolates using the mt-co1 gene sequence. MEGA X was used to construct a maximum likelihood tree based on the HKY + I model. The reliability of the tree was assessed by 1000 bootstrap replications. Echinococcus equinus (GenBank accession no. KP101616), E. granulosus s.s. (GenBank accession no. KJ162569), E. ortleppi (GenBank accession no. MN058591) and E. multilocularis (GenBank accession no. AB461417) were used as reference sequences, while T. hydatigena (GenBank accession no. MK945746), T. saginata (GenBank accession no. AB644391) and T. multiceps (GenBank accession no. LC271741) were used as outgroup sequences for phylogenetic tree construction.
Haplotype analysis
The analysis showed the presence of 19 polymorphic sites of the mt-co1 nucleotide sequences; of which 31.6% (6/19) were of parsimony-informative. The E. granulosus s.s. mt-co1 haplotype network had 20 haplotypes, organized in a star-like orientation, alongside of fundamental focal haplotype, isoated from different haplotypes by 1–5 mutational points and incorporating 29.8% (14/47) of the all studied isolates. This major haplotype included five (26.3%) Pakistani and six (60%) Chinese human isolates, one (10%) Iranian sheep isolate and two (25%) Indian buffalo isolates. Next, the main haplotype included five (50%) Iranian isolates (camel, n = 4; sheep, n = 1), one (5.3%) Pakistani human isolate and one (12.5%) Indian buffalo isolate. Within the mt-co1 haplotype network the frequency of unique singleton haplotypes were 61.4% (13/19), with the most of them from the Pakistani isolates (n = 5), followed by that from the Chinese (n = 4), Indian (n = 3) and Iranian (n = 1) (Fig. 5).

Fig. 5. Haplotype network of E. granulosus s.s. mt-co1 gene. Different colours indicate the geographical distribution of the haplotypes. Circle sizes are related to haplotype frequency. Hatch marks show the number of mutations distinguishing the haplotypes.
The analysed mt-cytb gene sequence length of the E. granulosus s.s. isolates was 547 bp. Twelve sites were polymorphic for the mt-cytb sequence; 25% (3/12) were parsimony-informative. The haplotype network had 12 haplotypes, organized in a star-like orientattion, alongside of fundamental focal haplotype, isolated from different haplotypes by 1–6 mutational advances and incorporating 40% (14/35) of all the studied isolates. This main haplotype comprised nine (90%) Chinese isolates (sheep, n = 6; human, n = 3), three (30%) Iranian sheep isolates, and two (33.3%) Indian buffalo isolates. Next, the main haplotype included four (44.4%) Iranian isolates (camel, n = 3; sheep, n = 1), two (22.2%) Pakistani human isolates and two (33.3%) Indian buffalo isolates. There were 66.7% (8/12) unique singleton haplotypes within the mt-cytb haplotype network; the most were reported from Pakistan (n = 4), followed by Iran (n = 3) and China (n = 1) (Fig. 6).

Fig. 6. Haplotype network of E. granulosus s.s. mt-cytb gene. Different colours indicate the geographical distribution of the haplotypes. Circle sizes are related to the haplotype frequency. Hatch marks show the number of mutations distinguishing the haplotypes.
For the E. granulosus s.s. mt-nadh1 sequence, 743-bp sequences were analysed. Twenty polymorphic sites for the mt-nadh1 sequence were detected; 20% (4/20) were parsimony-informative. Low nucleotide diversity and high haplotype diversity were observed. There were 12 haplotypes in the mt-nadh1 haplotype network, were organized in a star-like orientation, alongside of fundamental focal haplotype, isolated from different haplotypes by 1–11 mutational points, and comprised 29.8% (16/37) of all the studied isolates. The major haplotype have seven (43.8%) Pakistani human isolates, four (66.7%) Indian buffalo isolates, four (40%) Iranian isolates (camel, n = 3; sheep, n = 1) and one (10%) Chinese human isolate. 66.7% (8/12) singleton haplotypes were unique within the mt-nadh1 haplotype network, the most from China (n = 4), followed by Pakistan (n = 2) and Iran (n = 1) (Fig. 7).

Fig. 7. Haplotype network of E. granulosus s.s. mt-nadh1 gene. Different colours indicate the geographical distribution of the haplotypes. Circle sizes are related to the haplotype frequency. Hatch marks show the number of mutations distinguishing the haplotypes.
After trimming the raw sequences, the 366-bp length of mt-co1 sequence of E. canadensis (G6/G7) was analysed. We detected four polymorphic sites without any parsimony-informative site. The mt-co1 haplotype network contained four haplotypes, with a central major haplotype separated by 1–3 mutational steps from the other haplotypes and which covered 78.6% (11/14) of all analyzed isolates. This haplotype have seven (26.3%) Iranian isolates (human, n = 1; camel, n = 6), two (100%) Pakistani isolates and two (100%) Chinese human isolates. There were 75% (3/4) unique singleton haplotypes within the mt-co1 haplotype network, with the most reported from the Iranian isolates (n = 3) (Fig. 8).

Fig. 8. Haplotype network of E. canadensis (G6/G7) mt-co1 gene. Different colours indicate the geographical distribution of the haplotypes. Circle sizes are related to the haplotype frequency. Hatch marks show the number of mutations distinguishing the haplotypes.
Discussion
Generally, E. granulosus s.s. is one of the most common genotypes all over the world (Alvarez et al., Reference Alvarez Rojas, Romig and Lightowlers2014; Kinkar et al., Reference Kinkar, Laurimäe, Acosta-Jamett, Andresiuk, Balkaya and Casulli2018). The mt-co1 gene can be used to differentiate inter- and intra-specific variants in evolutinary terms (Nakao et al., Reference Nakao, Lavikainen, Yanagida and Ito2013). The Echinococcus spp. reproduction system is unique because adult worms are hermaphrodites, and their asexual reproduction occurs at the larval stage. This reproduction method might lead to many genetic mutations and result in variations at genus and species level (Smyth and Smyth, Reference Smyth and Smyth1969), and is supported by the occurence of two different haplotypes in a single intermediate host (Casulli et al., Reference Casulli, Interisano, Sreter, Chitimia, Kirkova and Rosa2012).
Here, the E. granulosus s.s. haplotype network in the mt-co1 region revealed that most sequences were of Chinese origin (28.6%, 6/14). Following this, the main haplotype included isolates from Pakistan (n = 5), India (n = 2) and Iran (n = 1). There were 65% (13/20) unique singleton haplotypes within the mt-co1 haplotype network, with the most reported from the Pakistani isolates (n = 5), followed by that of the Chinese (n = 4), Indian (n = 3) and Iranian isolates (n = 1), while the E. canadensis (G6/G7) haplotype network in the mt-co1 region revealed sequences that were mostly of Iranian origin (63.6%, 7/11) in the main haplotype. There were three single haplotypes in the E. canadensis (G6/G7) isolates, all belonging to the Iranian isolates.
In the E. granulosus s.s. mt-cytb region, the main haplotype comprised 90% (9/10) of Chinese isolates, and three Iranian isolates and two Indian isolates. There were 66.7% (8/12) unique singleton haplotypes within the mt-cytb haplotype network, with the most reported from Pakistan, followed by Iran and China. Analysis of the E. granulosus s.s. mt-cytb sequence was restricted to BLAST search because sample size was small. Wang et al. (Reference Wang, Wang, Hu, Zhong, Wang, Gu and Yang2014a, Reference Wang, Huang, Huang, Yu, He and Zhongb) collected 45 hydatid cysts from human, sheep and yak hosts in China, sequenced the cytb gene, and confirmed 10 haplotypes from the 45 isolates. The results indicate that each haplotype has specificity for its intermediate host. In that study, haplotype diversity was observed as 0.626, while nucleotide diversity was noted 0.001 (Zhong et al., Reference Zhong, Wang, Hu, Wang, Liu, Gu, Wang, Peng and Yang2014). Similarly, we detected 12 sites that were polymorphic for the mt-cytb, out of which 25% (3/12) sites were parsimony-informative. A total of 12 haplotypes were observed in the haplotype network, with a central main haplotype separated by 1–6 mutational steps from the other haplotypes.
The haplotype network of the E. granulosus s.s. mt-nadh1 region revealed sequences that were mostly of Pakistan origin (43.8%, 7/16). The other elements of this main haplotype were the Indian (66.7%, 4/6), Iranian (40%, 4/10) and Chinese isolates 10% (1/10). The findings show that the same haplotype contained a diversity of both geography and species such as human, buffalo, sheep and camel, and that there was a close relationship between them. On the contrary, there were 66.7% (8/12) unique singleton haplotypes in the mt-nadh1 haplotype network, most of which were from the human isolates of China (n = 4), followed by that of Pakistan (n = 2) and sheep isolates of Iran (n = 2). Genetically different E. granulosus s.s. variants were obtained in the same host, which is evident by all these mutations. The presence of the different variants also suggests that out-crossing between different adult worms might have occurred in the same final host.
The nucleotide diversity and total haplotype values were 0.00157 and 0.396, respectively. They were relatively low for the mt-co1 gene from the E. canadensis (G6/G7) analyzed isolates. These results show that E. canadensis (G6/G7) haplotypes are not genetically diverse. In the current scenario, 7 out of 11 isolates were of Iranian origin while Pakistani and Chinese isolates were also located in the main haplotype.
The mt-co1 gene is one of the best options for analysis to determine the genetic variability of the different E. granulosus s.s. isolates (Kamenetzky et al., Reference Kamenetzky, Gutierrez, Canova, Haag, Guarnera and Parra2002; Haag et al., Reference Haag, Alves-Junior, Zaha and Ayala2004; Badaraco et al., Reference Badaraco, Ayala, Bart, Gottstein and Haag2008; Nakao et al., Reference Nakao, Li, Han, Ma, Xiao and Qiu2010). The mt-co1 gene of the E. granulosus s.s. isolates had 0.883 and 0.00593 of haplotype and nucleotide diversity, respectively, which were relatively higher as compared to that of the other genes. In this case, it is not surprising that 20 haplotypes were identified within 47 isolates. The higher haplotype variations in the mt-co1 gene showed a star-shaped network with a centrally placed main haplotype (EgUK01), as previously reported (Boufana et al., Reference Boufana, Lett, Lahmar, Buishi, Bodell and Varcasia2015). Similarly, there is high haplotype variability in the E. granulosus s.s. G1 genotype, and 171 haplotypes have been found in 212 samples (Kinkar et al., Reference Kinkar, Laurimäe, Acosta-Jamett, Andresiuk, Balkaya and Casulli2018). Excessive genetic diversity of E. granulosus s.s. was observed by using sequences of shorter length (Casulli et al., Reference Casulli, Interisano, Sreter, Chitimia, Kirkova and Rosa2012; Rojas et al., Reference Rojas, Fredes, Torres, Acosta-Jamett, Alvarez and Pavletic2016). Previously, E. granulosus s.s. (G1 and G3) was reported from Italian and Eastern European populations, where 21 and four haplotypes were confirmed in Eastern Europe and Italy, respectively (Casulli et al., Reference Casulli, Interisano, Sreter, Chitimia, Kirkova and Rosa2012).
The overall outcomes of the present study clearly indicate low nucleotide diversity and high haplotype diversity in general. Tajima's D was recorded negative for all analyzed sequences, indicating population expansion and/or purifying selection. Recent population expansion or hitchhiking in E. granulosus s.s. can be explained by the significantly highest negative Fu's F values in sequence comparison of mt-co1, which showed the presence of rare haplotypes. Fu's F test was developed based on haplotype or allele distribution. The existence of unmatched single haplotypes for the mt-co1 (13/20) sequences of E. granulosus s.s. is concordant with the structure of the haplotype networks.
The negative values of both tests show the excess of rare mutations present in a population (Sharma et al., Reference Sharma, Fomda, Mazta, Sehgal, Singh and Malla2013). On the other hand, a common founder, i.e. an E. granulosus haplotype (EgUK01), along with negative neutrality, show evidence of a recent history of bottleneck or founder events among populations and their expansion. The similarity in the E. granulosus s.s. genomes from different geographical regions indicate the presence of a single lineage globally. The most probable reason for population expansion might be the anthropogenic movement of animal hosts (Nakao et al., Reference Nakao, Li, Han, Ma, Xiao and Qiu2010). However, the E. granulosus s.s. co1 gene (828 bp) shows considerable genetic variation, and the pair-wise fixation index for the E. granulosus s.s. co1 gene from donkeys was significantly higher compared to that of other intermediate hosts. That study also indicated that the E. granulosus donkey subpopulations are distinct from the subpopulations of other hosts. The statistically significant Fs values of the donkey E. granulosus isolates as compared to that of other hosts indicates the presence of surplus variable alleles, further indicating the limited gene flow (Boufana et al., Reference Boufana, Lett, Lahmar, Buishi, Bodell and Varcasia2015).
Our findings for Pakistan are in line with that of other studies. In Tunisian isolates, the low nucleotide diversity coupled with high haplotype diversity in E. granulosus s.s. was comparable to other countries such as China, Europe, Iran and Jordan (Nakao et al., Reference Nakao, Li, Han, Ma, Xiao and Qiu2010; Casulli et al., Reference Casulli, Interisano, Sreter, Chitimia, Kirkova and Rosa2012; Yanagida et al., Reference Yanagida, Mohammadzadeh, Kamhawi, Nakao, Sadjjadi and Hijjawi2012), which indicates a rapid demographic expansion (Avise, Reference Avise2000). In the present study, Tajima's D values were negative which indicates a bias towards the presence of nucleotide variations, a feature of recent population increase. The negative Fu's F values for most of the E. granulosus s.s. subpopulations indicate bottleneck and/or purifying selection event that might have happened in the past, with similar findings reported from China and Jordan (Nakao et al., Reference Nakao, Li, Han, Ma, Xiao and Qiu2010; Yanagida et al., Reference Yanagida, Mohammadzadeh, Kamhawi, Nakao, Sadjjadi and Hijjawi2012). Interestingly, it has been postulated that E. granulosus genetic diversity in the Middle East is the result of parasitic shift that might have occured from wild to domestic hosts (Yanagida et al., Reference Yanagida, Mohammadzadeh, Kamhawi, Nakao, Sadjjadi and Hijjawi2012).
Conclusion
We used three mt-DNA markers to investigate the population genetic structure of E. granulosus s.s. and E. canadensis (G6/G7) sequences from livestock and human species. The analysis of the mt-co1, mt-cytb and mt-nadh1 gene fragments showed that the parasite's genetic diversity in Pakistan, China, Iran and India has increased continually. However, further studies are required to confirm this conclusion. In addition, it is important to search and track sources of infection, using adult parasites obtained from different final host species, to analyse the evolutionary history and to determine the pathogenicity of E. granulosus s.l.
Data
All relevant data are within the manuscript.
Acknowledgements
The authors would like to thank Professor Wenqin Wang at Shanghai Jiaotong University for help with the bioinformatics analysis, Dr Wang Yanjuan, Dr Jianhai Yin, and Dr Ying Wang at the National Institute of Parasitic Diseases, Chinese Center for Disease Control and Prevention, for technical guidance.
Author contributions
AK, SS, FC, KS, MSA, and MRK performed the bioinformatic analyses, evaluated the results, and drafted the paper. HA and JC participated in the conception and design of the study. HL and YS contributed to the data analysis and revised the manuscript. FC and SS contributed to the data analysis. All authors have read and approved the final manuscript.
Financial support
This study was supported by the National Natural Science Foundation of China (grant nos. 81772225 and 81971969 to JC), the Fifth Round of Three-Year Public Health Action Plan of Shanghai (No. GWV-10.1-XK13 to JC), and the Laboratory of Parasite and Vector Biology, National Health Commission of the People's Republic of China (grant no. WSBKFKT2017-01 to AK). The funders had no role in study design, data collection and analysis, decision to publish, or preparation of the manuscript.
Conflict of interest
None.
Ethical standards
Not applicable.
Consent to publication
Not applicable.


