Introduction
In vitro embryo production (IVP) is a promising tool as it allows the optimized use of oocytes from donor females, as well as increasing the number of embryos produced under laboratory conditions (Choi et al., Reference Choi, Kang, Park, Kim, Moon, Saadeldin, Jang and Lee2013). In vitro maturation (IVM) of oocytes is the most important stage of IVP because it determines the successful fertilization, zygote formation, achievement of blastocyst stage and further pregnancy (Leoni et al., Reference Leoni, Succu, Satta, Paolo, Bogliolo, Bebbere, Spezzigu, Madeddu, Berlinguer, Ledda and Naitana2009). However, currently, IVP in goats is marked by unsatisfactory rates when compared with results observed in other species such as human (Srivastava et al., Reference Srivastava, Desai, Coutinho and Govil2006) and bovine (Bueno and Beltran, Reference Bueno and Beltran2008). Some studies have reported on goat oocyte physiology, as well as its metabolic requirements to achieve better IVM rates. This information may be the key to success for this biotechnology in such species (Zhou et al., Reference Zhou, Wu, Li, Lan, Wang and Gao2008; Souza-Fabjan et al., Reference Souza-Fabjan, Locatelli, Duffard, Corbin, Batista, Freitas, Beckers and Mermillod2016). One factor that culminates instability in IVM rates is the negative influence of high reactive oxygen species (ROS) production, which affects in vitro embryo development in conventional culture systems. This production occurs mainly in the IVM stage due to excessive oocyte manipulation, light exposure and high oxygen tension, causing an imbalance in the oxidation−reduction mechanism (Pu et al., Reference Pu, Wang, Bian, Zhang, Yang, Li, Zhang, Fang, Cao and Zhang2014). High ROS production can block or delay oocyte development and decrease the viability of these cells (Kang et al., Reference Kang, Kwon, Park, Kim, Moon, Koo, Jang and Lee2013). However, the equilibrium of ROS concentrations in ideal conditions has a positive effect on IVP because it promotes oocyte and embryo competency from energy generation during metabolism (Guemra et al., Reference Guemra, Monzani, Santos, Zanin, Ohashi, Miranda and Adona2013).
Substances that are inhibitory to ROS, i.e. antioxidants, have been to be considered significant components to supplement IVM medium. Some examples are cysteamine (Mudo et al., Reference Mudo, Silva, Bastos, Silva, Guimarães, Medina, Cordeiro and Lopes Júnior2015), cysteine (Pu et al., Reference Pu, Wang, Bian, Zhang, Yang, Li, Zhang, Fang, Cao and Zhang2014) and vitamin E (Silva, Reference Silva2015). However, these substances have raised the cost of IVM medium, although they present satisfactory results. Therefore, the addition of alternative substances with antioxidant action that could reduce the cost of maturation medium is necessary to improve oocyte IVM.
Quercetin (3,5,7,3′-4′-pentahiroxyflavone) is a natural flavonoid widely found in vegetables, grains, fruits, flowers, teas. It has therapeutics properties and antioxidant potential (Behling et al., Reference Behling, Senadão, Francescato, Antunes and Bianchi2004). Positive effects of quercetin have been already observed on the IVM of bovine (Guemra et al., Reference Guemra, Monzani, Santos, Zanin, Ohashi, Miranda and Adona2013). The presence of quercetin promoted excellent oocyte maturation rates and blastocyst development in swine by reduction of ROS intracellular levels (Orlovschi et al., Reference Orlovschi, Miclea, Zahan, Miclea and Pernes2014). Furthermore, quercetin reduces the cost of IVM for oocytes because this flavonoid is 3.6 times less expensive than conventional antioxidant cysteamine (Guemra et al., Reference Guemra, Monzani, Santos, Zanin, Ohashi, Miranda and Adona2013). However, there have been no reports on effects of quercetin inclusion on oocyte IVM in goats.
Therefore, the aim of the present study was to evaluate the effect of two quercetin concentrations (4 µM and 8 µM) as an alternative oxidant to cysteamine for IVM of goat oocytes.
Materials and methods
Chemicals
Chemicals used in this study were purchased from Sigma (Sigma-Aldrich Corp., St. Louis, MO, USA) or from another company specified in the text.
Aspiration of oocytes
Goat ovaries (n = 176) were collected from a local slaughterhouse and transported to the laboratory within 3 h after collection in saline solution (NaCl 0.9%, Fresenius®, Dismed, Brazil) at 30°C (Souza-Fabjan et al., Reference Souza-Fabjan, Locatelli, Duffard, Corbin, Batista, Freitas, Beckers and Mermillod2016). Ovaries were washed three times in prewarmed fresh saline (30°C) and maintained in a water bath (MODEL 1102®, Fanem, Brazil). Oocytes were aspirated from all visible follicles between 2 and 6 mm in diameter with an 18-gauge short bevel needle (Solidor®, Lamedid Comercial & Serviços, Brazil) connected to a Falcon tube under controlled vacuum (30 mmHg or 6–8 ml/min). The collection tube was filled with 3−5 ml of tissue culture medium 199 (TCM199) supplemented with 50 IU/ml heparin, 50 µg/ml gentamycin and 10% (v/v) of fetal calf serum (FCS).
Evaluation of oocytes
After collection, cumulus–oocyte complexes (COCs) were transferred to 60 mm Petri dishes (Petri Dish60®, Nutricell, Brazil), analyzed under a stereozoom microscope (SMZ 645®, Nikon, Japan) and classified into different grades according to Avelar et al. (Reference Avelar, Moura, Sousa, Pereira, Almeida, Melo, Teles-Filho, Baril, Melo, Teixeira and Freitas2012). Only COCs classified as Grade I (with more than three layers of compact cumulus cells) and Grade II (with one to three layers of cumulus cells finely granulated) were indicated for IVM.
IVM of oocytes and experimental design
Selected oocytes were washed in collection medium until maturation procedures. Then, these COCs were allocated randomly into three maturation groups with 15−17 oocytes for the following groups:
∙ CIS group, with oocytes matured in TCM-199 supplemented with EGF (10 µl/ml), follicle stimulating hormone (FSH)/LH (10 µl/ml), oestrus serum sheep (100 µl/ml) and cysteamine (10 µl/ml);
∙ Q4 and Q8 groups, with oocytes matured at medium used in the CIS group but without cysteamine and supplemented with 4 µM or 8 µM of quercetin, respectively.
The COCs were transferred to 5-well Petri dishes (Thermo Scientific®, Nutricell, Brazil) containing 500 µl of maturation medium, under mineral oil, for 24 h at 38.5ºC, in a humidified atmosphere of 5% CO2 in air. Therefore, nine replicates were performed with 426 oocytes designated for IVM.
In vitro maturation evaluation (IVM)
Morphological evaluation
In order to evaluate the expansion of cumulus cells, matured oocytes were evaluated under a stereozoom microscope (SMZ 645®, Nikon, Japan) to determine the presence or absence of cumulus cells expansion, according to published methodology (Avelar et al., Reference Avelar, Moura, Sousa, Pereira, Almeida, Melo, Teles-Filho, Baril, Melo, Teixeira and Freitas2012). In addition, the cumulus cell expansion grade was evaluated and classified as Total (Grade I), Moderate (Grade II) or Light (Grade III), according Aghaz et al. (Reference Aghaz, Hajarian, Shabankareh and Abdolmohammadi2015). Briefly, the scoring system spanned from 0 to +4. A score of 0 indicated no expansion; +l indicated the minimum observable expansion in which cumulus cells had a glistening appearance; +2 indicated oocytes with partial expansion; +3 indicated oocytes with cumulus cells completely expanded, except corona radiata; and +4 indicated the maximum degree of expansion (Vanderhyden et al., Reference Vanderhyden, Caron, Buccione and Eppig1990).
Evaluation of chromatin configuration and oocyte DNA fragmentation
At the end of maturation, oocytes were submitted to terminal deoxynucleotidyl transferase dUTP nick end labelling (TUNEL) assay based on previous methodology (Gouveia et al., Reference Gouveia, Macedo, Santos, Barberino, Menezes, Müller, Almeida, Figueiredo and Matos2016). Briefly, oocytes were denuded and fixed in 4% paraformaldehyde solution for 1 h at room temperature. Then, oocytes (approximately 10 oocytes per treatment group) were washed three times in solution of PBS/polyvinylpyrrolidone (PVP) and stored at 4°C in an Eppendorf tube (Eppendorf 1.5®, Eppendorf do Brasil, Brazil) with 400 µl of PBS/PVP (Freezer Horizontal H400®, Electrolux, Sweden), prior to the TUNEL procedure. Oocytes were incubated in 100 µl droplets of permeabilizing solution [0.1% (v:v) Triton X-100 in 10 mM PBS] for 3 h at room temperature. Positive and negative controls were incubated in 100 µl droplets containing DNase-free RNase (Invitrogen Corporation, Carlsbad, CA, USA) at room temperature for 1 h and washed three times in drops of PBS/PVP. TUNEL assay was prepared for 15 min as indicated by the manufacturer and at 4°C (In Situ Cell Detection Kit, Fluorescein: Boehringer Mannheim/Roche Diagnostics Ltd, Indianapolis, USA). For this purpose, 112.5 µl terminal deoxynucleotidyl transferase enzyme and 112.5 µl of marker solution of 2-deoxyuridine triphosphate 5-FITC were combined to give 225 µl TUNEL mixture for the reaction. The experimental groups and the positive control were incubated with 15 µl of this solution for 1 h at 37°C in a moist chamber (Equilam®, KEQ300UM, Brazil) in the dark. The negative control was incubated with 15 µl of the marker solution. Oocytes were washed three times in 50 µl drops of PBS/PVP and incubated in 50 µl drops of PBS containing 10 mM Hoechst 33342 stain for 15 min at room temperature in the dark. Then, oocytes were washed three times in 50 µl drops of PBS/PVP; slides (Coleman®, Roster, Brazil) were prepared for evaluation using an epifluorescence microscope (Nikon E200®, Tokyo, Japan) at a magnification of ×400. Oocytes were considered apoptotic when they exhibited marked chromatin green fluorescence. Finally, for oocytes, chromatin and the different meiosis stages: germinal vesicle (GV), germinal vesicle breakdown (GVBD), metaphase I (MI) and metaphase II (MII) were evaluated, following previously published methodology (Rajabi-Toustani et al., Reference Rajabi-Toustani, Motamedi-Mojdehi, Mehr and Motamedi-Mojdehi2013).
Assessment of oxidative stress markers (ROS and GSH intracellular levels) and metabolically active mitochondria
After IVM, 10 matured oocytes from each experimental group were denuded and intracellular reduced glutathione (GSH) and ROS levels and mitochondrial activity were measured as previously described by Lins et al. (Reference Lins, Cavalcante, Santos, Menezes, Barros, Barberino, Bezerra, Macedo and Matos2017), with minor modifications. Briefly, 4-chloromethyl-6.8-difluoro-7-hydroxycoumarin (CellTracker® Blue; CMF2HC; Invitrogen Corporation), 2′,7′-dichlorodihydrofluorescein diacetate (H2DCFDA; Invitrogen Corporation) and MitoTracker Red (MitoTracker® Red, CMXRos, Molecular Probes, Melbourne, Victoria, Australia) were used to detect intracellular GSH, ROS and mitochondrial activity levels as blue, green and red fluorescence, respectively. Oocytes (approximately 10 oocytes per treatment group) were incubated in the dark for 30 min in PBS supplemented with 10 mM of CellTracker® Blue, 10 mM of H2DCFDA and 100 nM MitoTracker® Red at 39ºC. After incubation, the oocytes were washed with PBS and their fluorescence was observed under an epifluorescence microscope with UV filters (370 nm for GSH, 460 nm for ROS and 579–599 nm for active mitochondria). Fluorescence intensities of oocytes were analyzed using Image J software (National Institutes of Health, Bethesda, MD, USA).
Statistical analysis
Data on maturation rate, cumulus cell expansion and retraction rates, different grades of cumulus cell expansion rates and DNA fragmentation were expressed as percentages and compared using the chi-squared test using Epi Info software (Epi Info 7.1.5.0, Atlanta, GA, USA, 2015). Data for GSH levels and mitochondrial activity were submitted to the Shapiro–Wilk test to verify the normal distribution of residues and homogeneity of variances. Then, the Kruskal–Wallis non-parametric test was used for comparisons. When main effects or interactions were significant, means were compared using the Student−Newman−Keuls test. Data from apoptotic cells (TUNEL) were submitted to the least significant difference Fisher test and expressed as percentage. The results were expressed as the means ± standard error of the mean, and differences were considered significant when P-values were<0.05.
Results
Morphological evaluation after IVM
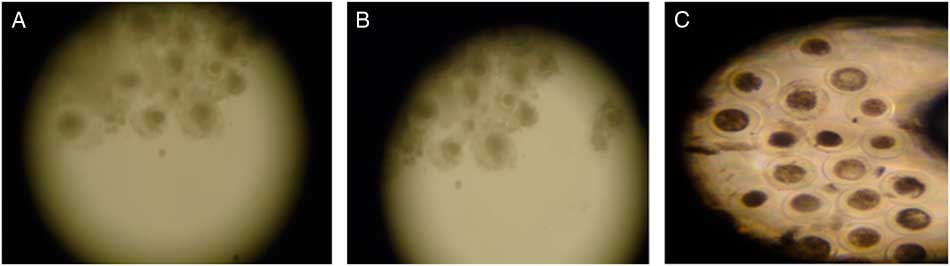
CIS group (control; Fig. 1A ) presented the same percentage of expanded cumulus cells as the Q4 group (Fig. 1B ; Table 1; P > 0.05) but in the Q8 group the percentage was lower (P<0.05) than for the other groups (Fig. 1C ). At 24 h from maturation onset, oocyte retraction rate in medium containing 8 µM of quercetin was superior (P<0.001) to that of other treatments (Table 1).

Figure 1 Expanded goat oocytes matured in vitro in medium containing cysteamine (CIS group. (A), 4 µM (Q4 group; (B) or 8 µM (Q8 group; (C) of quercetin (×70 magnification).
Table 1 Cumulus cells expansion and oocyte retraction rates (%) in goat cumulus–oocyte complexes (COCs) matured in vitro at medium containing cysteamine (CIS), 4 µM (Q4) or 8 µM (Q8) of quercetin
Data are expressed as the mean ± standard error of the mean (SEM) (n = 10 replicates).
a,b Within a column, values with different superscripts differ significantly (P<0.05).
For cumulus cell expansion grades, treatment containing 8 µM of quercetin resulted in a lower proportion of expanded oocytes at the Grade I (Total) stage and a higher percentage of expanded oocytes at the Grade III (Light) stage compared with treatments containing cysteamine and 4 µM of quercetin (P<0.05) (Table 2).
Table 2 Effect of inclusion of quercetin on grade of expansion of goat cumulus–oocyte complexes (COCs) matured in vitro in medium containing cysteamine (CIS), 4 µM (Q4) or 8 µM (Q8) of quercetin

Data are expressed as the mean±standard error of the mean (SEM) (n = 10 replicates).
a,b Within a column, values with different superscripts differ significantly (P<0.05).
Analysis of chromatin configuration and DNA fragmentation
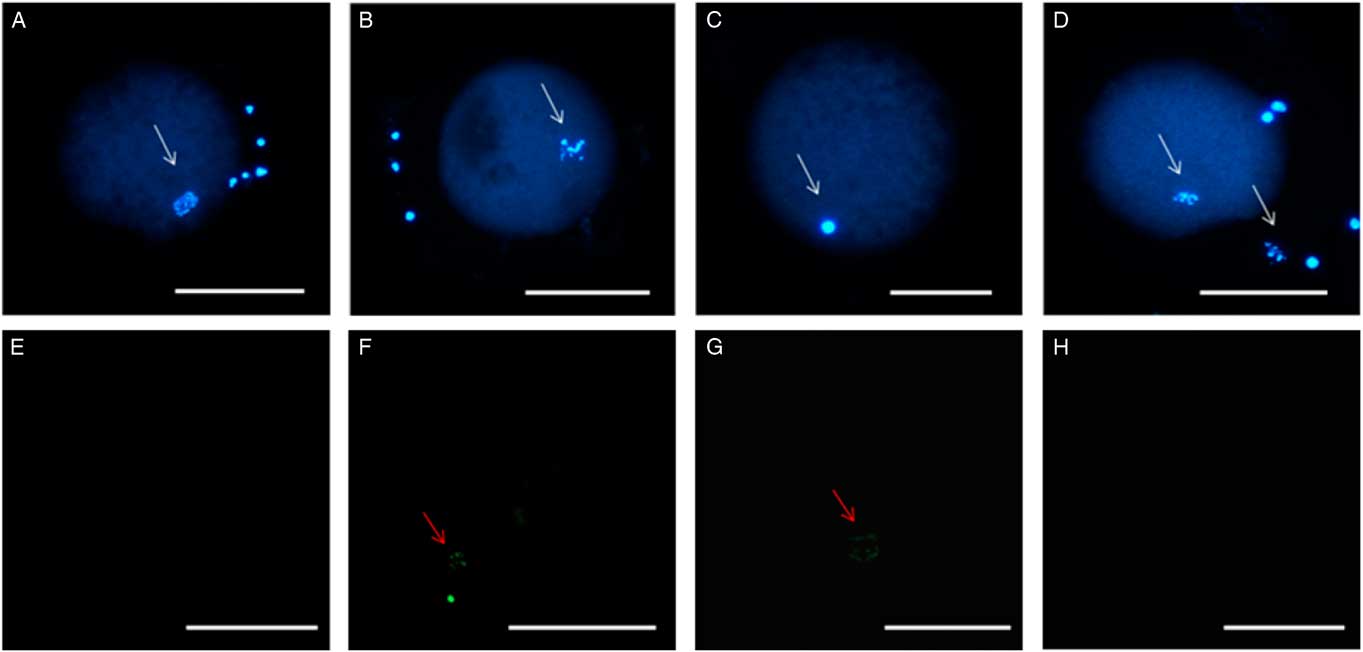
For nuclear maturation rate, the percentage of oocytes that reached the metaphase II stage was higher in medium supplemented with 4 µM of quercetin than in medium containing cysteamine (P<0.05), but there was no significant difference between CIS and Q8 (Table 3; Fig. 2). There was a significant increase (P<0.05) in TUNEL-positive cells in the CIS group (28.2%) compared with the Q4 group (0%) or the Q8 (0%) group (Fig. 2).
Table 3 Stages of nuclear maturation of goat oocytes matured in vitro in medium containing cysteamine (CIS), 4 µM (Q4) or 8 µM (Q8) of quercetin
a,b Within a column, values with different superscripts differ significantly (P<0.05).
GV, germinal vesicle; GVBD, germinal vesicle breakdown.

Figure 2 Stained chromatin after TUNEL reaction. (A) Germinal vesicle breakdown (GVBD) after treatment with 8 µM of quercetin (Q8). (B) Oocyte in metaphase I after using cysteamine (CIS). (C) Oocyte in metaphase II after using 4 µM of quercetin. Absence of TUNEL staining in the negative control (D) and Q4 group (E). Staining of fragmented DNA with TUNEL in the positive control (F) and after CIS treatment (G). Absence of labelling in the Q4 treatment group (H). White arrows indicate chromatin stained with Hoechst. Red arrows indicate chromatin stained using the TUNEL assay. Scale bar: 100 µm.
Quantification of reactive oxygen species levels (ROS), glutathione levels (GSH) and mitochondrial activity
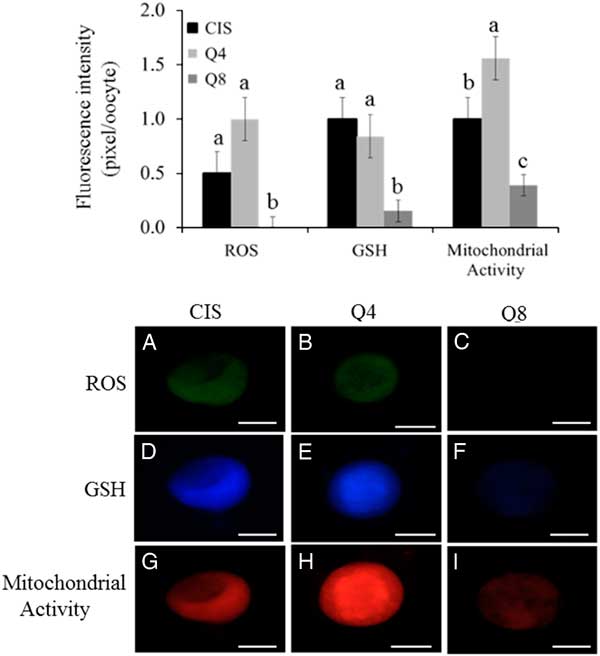
Oocyte intracellular levels of ROS, GSH and mitochondrial activity are presented at Figs 3 and 4. Oocytes treated with 8 µM of quercetin had lower (P<0.05) ROS and GSH levels compared with female gametes matured under CIS and Q4 group conditions; there was no significant difference between CIS and Q4 groups (P > 0.05). Oocytes matured in the presence of 4 µM of quercetin (Q4) presented higher (P<0.05) mitochondrial activity than female gametes treated under CIS and Q8 group conditions. Moreover, oocytes matured under Q8 group conditions presented lower (P<0.05) mitochondrial activity than female gametes treated under CIS group and Q4 group conditions.

Figure 3 (Upper) Intracellular levels of ROS, GSH and mitochondrial activity (pixel/oocyte) of oocytes matured under different concentrations of quercetin: 0 µM (CIS); 4 µM (Q4) e 8 µM (Q8). Different small letters among columns, within of each parameter, indicate significant difference (P<0.05). (Lower) Epifluorescence photomicrograph of goat oocytes stained with dichlorofluorescin (A−C), cell tracker blue (D−F) and Mito Tracker Red (G−I) representing intracellular levels of ROS, GSH and mitochondrial activity (pixel/oocyte) respectively of oocytes matured using different concentrations of quercetin: 0 µM (CIS); 4 µM (Q4) and 8 µM (Q8). Scale bar: 75 µm.
Discussion
This study is the first to report the effects of inclusion of quercetin as an alternative antioxidant to cysteamine on IVM of goat oocytes. IVM medium supplemented with 4 µM of quercetin (Q4) or 100 µM of cysteamine (CIS) presented similar expanded cumulus cells and oocyte retraction rates (they did not promote cell damage). Our results are similar to reports from Orlovschi et al. (Reference Orlovschi, Miclea, Zahan, Miclea and Pernes2014) that observed a high percentage of cumulus cells expansion rates in porcine oocytes matured at medium containing 25 µg/ml of quercetin. These results suggested that supplementing with 4 µM of quercetin or 100 µM of cysteamine can influence the mucification process and quality of oocyte.
In contrast, supplementation with 8 µM of quercetin at IVM medium promoted a lower cumulus cells expansion rate and a higher percentage of oocyte retraction than other treatments. A possible explanation is that the molecular structure of this flavonoid is similar to the structure of estrogens and therefore it probably interacts with estrogen receptors as well as a phytoestrogen. Quercetin would modulate oocyte activity (Orlovschi et al., Reference Orlovschi, Miclea, Zahan, Miclea and Pernes2014), promoting the decrease of synthesis and release of 17β-estradiol (E2) as well as the synthesis of growth factors from granulosa cells (Santini et al., Reference Santini, Basini, Bussolati and Grasselli2009). This flavonoid there affects the cellular environment, reducing the expansion of cumulus cells, as E2 added significant function to the mucification of intrafollicular cells (Kubo et al., Reference Kubo, Cayo-Colca and Miyano2015).
In the present study, we observed a higher percentage of oocytes in the Q4 group that reached metaphase II stage than matured oocytes matured from the control group. By contrast, Guemra et al. (Reference Guemra, Monzani, Santos, Zanin, Ohashi, Miranda and Adona2013) verified that there was no significant difference in the proportion of bovine oocytes that reached metaphase II stage after IVM in the presence of quercetin or cysteamine. It is important to emphasize that nuclear maturation does not depend directly on cumulus cells expansion (Crocomo et al., Reference Crocomo, Marques Filho, Ulian, Branchini, Silva, Ackermann, Landim-Alvarenga and Bicudo2015), as previously verified in cattle (Shirazi et al., Reference Shirazi, Bahiraee, Ahmadi, Nazari, Heidari and Borjian2009) and goat (Hand et al., Reference Hand, Lan, Wu, Han, Wang and Tan2006).
Although quercetin does not act directly on nuclear or cytoplasmic maturation (Kang et al., Reference Kang, Kwon, Park, Kim, Moon, Koo, Jang and Lee2013), the maturation rate observed for oocytes in medium containing 4 µM of quercetin (Q4 group) can be explained by higher mitochondrial activity and lower DNA fragmentation. compared with female gametes matured with cysteamine (CIS group). Mitochondrial activity is considered to be an excellent marker of oocyte quality and viability. This is because active mitochondria ensure functional competence in oocytes mainly during cytoplasmic and nuclear maturation (Moussa et al., Reference Moussa, Shu, Zhanq and Zenq2015). Mitochondrial activity during nuclear and cytoplasmic maturation is higher in mature oocytes (Tarazona et al., Reference Tarazona, Rodriguez, Restrepo and Olivera-Angel2006). In addition, mitochondria have a significant function during programmed cell death, which starts with intracellular and extracellular signals propagated by mitochondrial that promote mitochondrial disruption and cellular death (Tanabe et al., Reference Tanabe, Tamura, Taketani, Okada, Lee, Tamura, Maekawa, Asada, Yamagata and Sugino2015).
Corroborating our results, Jia et al. (Reference Jia, Lin, Mi and Zhang2011) evaluated the effect of adding quercetin to chicken follicle cultures and cytotoxicity using cadmium. They observed that the inclusion of quercetin in the culture medium reduced the number of apoptotic cells. The antioxidant potential of quercetin successfully protected the cell from possible damage and ensured, consequently, a lower rate of apoptosis. Therefore, we suggested that the higher maturation rate, after supplementing with 4 µM of quercetin, can be associated with higher oocyte quality that transferred to female gametes a greater ability to proceed to meiosis (Crocomo et al., Reference Crocomo, Marques Filho, Sudano, Paschoal, Alvarenga and Bicudo2013).
The positive effects of quercetin and cysteamine during IVM and oocyte culture are due to the antioxidant potential of these substances. In adequate concentrations, these antioxidants mediate the equilibrium during ROS production, resulting in cells of better quality and with higher viability (Orlovschi et al., Reference Orlovschi, Miclea, Zahan, Miclea and Pernes2014). There was no significant difference (P > 0.05) between the CIS and Q4 groups regarding intracellular ROS and GSH levels. In contrast, Guemra et al. (Reference Guemra, Monzani, Santos, Zanin, Ohashi, Miranda and Adona2013) found lower GSH levels in oocytes matured in the presence of quercetin (2−10 µM). Quercetin equilibrates ROS production because it interacts with superoxide ions, chelates iron ions and reduces lipid peroxidation, reducing cellular damage associated with oxidative stress (Johinke et al., Reference Johinke, De Graaf and Bathgate2014). However, quercetin can increase or decrease GSH levels based on its concentration. In addition, oocytes have endogenous GSH, which it is found during maturation and metaphase II stage. Quercetin concentrations can be changed dependent on in vitro cellular culture systems adopted in the laboratory (Liu et al., Reference Liu, Hou, Yao, Zhanq, Sun, Nüssler and Liu2010).
An 8 µM quercetin concentration reduced ROS, GSH and mitochondrial activity levels. Similar results were observed for bovine (Tvrdá et al., Reference Tvrdá, Tusimová, Kovácik, Paál, Libová and Lukác2016) and human (Khanduja et al., Reference Khanduja, Verma and Bhardwaj2002) sperm diluted in semen extender on the presence of quercetin. High concentrations of quercetin reduced the modulatory activity of Ca2+-ATPase resulting in a higher influx of intracellular calcium, cell damage, mitochondrial disruption, reduction of mitochondria activity and lower production of ROS by mitochondria (Khanduja et al., Reference Khanduja, Verma and Bhardwaj2002; Tvrdá et al., Reference Tvrdá, Tusimová, Kovácik, Paál, Libová and Lukác2016).
In conclusion, 4 µM of quercetin can be used as alternative to cysteamine for IVM of goat oocytes. However, more studies are necessary in order to find the ideal concentration of quercetin for IVM in goat oocytes and consequent in vitro fertilization and IVP.
Conflicts of interest
The authors have declared no conflict of interests.
Financial support
A.A.A. Silva was supported by CAPES and Federal University of San Francisco Valley. The authors wish to thank FACEPE for the financial support associated to project ‘Effect of inclusion of quercetin and pentoxifylline on in vitro production of goat embryos at semiarid of Northeastern Brazil’ (APQ10635.05/15).
Ethical standards
All protocols used in this study were approved by the Ethics and Deontology Committee in Studies and Researches of the Federal University of Saint Francisco Valley (Process 0004/120215/CEDEP/UNIVASF).