


Introduction
Volumetric modulated arc therapy (VMAT) is a novel form of radiotherapy (RT) of cancer treatment. Compared to other older RT techniques, it offers plan quality with shorter treatment delivery times and reduced doses. It allows the radiation dose to be delivered in 360° gantry rotation. In treatment planning for prostate cancer, intensity-modulated radiotherapy (IMRT) and VMAT both produced more favourable dose distributions than could be achieved with 3D conformal radiotherapy (3DCRT), but VMAT has added advantages of reduced monitor units (MUs) and dose to critical structures. Reference Palma, Vollans and James1,Reference Atiq, Atiq and Iqbal2 Zhang et al. compared VMAT and standard IMRT plans and showed that VMAT treatment decreased the beam-on time up to 55% while keeping the dosimetric quality unchanged. Reference Zhang, Happersett and Hunt3 Bedford et al. also investigated VMAT plans for different sites, including the prostate, and proved that VMAT has high-quality dose delivery in shorter times compared to IMRT Reference Bedford4
In all the cases, planners intend to achieve a homogenous dose distribution within the planning target volume (PTV). A direct association of accurate dose distribution and good treatment outcome is highly desired. Reference Rousseau, Autret and Krhili5 The homogeneity and uniformity of dose distribution in the PTV allows us to quantify the relationship between planned dose and treatment outcome. Reference Voyant, Julian, Roustit, Biffi and Lantieri6 Sometimes due to differences in the anatomy, shape of the target, objective defined and target volume margins, this goal is unachievable; therefore, in practice, some heterogeneity of dose distribution is always present and has to be accepted within a tolerance limit. It is, therefore, essential to evaluate treatment techniques with regard to acceptable plan quality and treatment efficiency.
In this study, we evaluated VMAT plans for prostate cancer generated with a commercially available planning system capable of optimizing intensity-modulated arc plans. There are several recommendations concerning dose distribution uniformity, homogeneity, coverage and plan evaluation. According to the ICRU Report 50, the uniformity of dose distribution is described in terms of the maximum and minimum doses within the PTV. Reference Landberg, Chavaudra and Dobbs7 Pre-treatment verifications using phantom measurements have been recommended in the literature. Reference Ma, Jiang and Pawlicki8–Reference Ravichandran, Binukumar, Sivakumar, Krishnamurthy and Davis10 The gamma index is an essential tool for a quantitative assessment of computational quality and has the potential to detect drawbacks in intended planar dose distributions. It provides for a powerful analysis of 3D treatment planning systems (TPS). Reference Low, Harms and Mutic11 Since the introduction of the gamma index by Low et al., it has been adopted for quality assurance (QA) by various teams. Reference Agazaryan, Solberg and DeMarco12–Reference Zulkafal, Khan and MW15 A pass/fail decision for the evaluation of gamma index was proposed by Chung et al. Reference Chung, Kim, Ha and Ye16 IMRT-specific QA guidelines are given by the European Society of Radiotherapy and Oncology (ESTRO) Reference Mijheer and Georg17 and the American Association of Physicists in Medicine (AAPM) Task Group 119 report. Reference Ezzell, Burmeister and Dogan18 For comparison between measured and calculated dose distributions, the gamma evaluation method was adopted in this study, which quantifies both absolute dose difference and distance to agreement criteria. Reference Low and Dempsey14
This work focused on the plan acceptability criteria by finding dose indices, that is, homogeneity index (HI), uniformity index (UI), coverage, radical dose HI (rDHI) and moderate dose HI (mDHI) by studying the dose–volume histograms (DVH) of plans and also by gamma analysis.
Material and Method
In this research, 35 patients with prostate cancer were included. CT simulation was done using a flat-couch CT scanner (Toshiba, Tsx-021B, Japan) of 3 mm slice. Images of all patients were exported to TPS for treatment planning. Target volumes and organs at risk were outlined by a radiation oncologist, that is, clinical target volume (CTV) in all directions. PTV was drawn by the addition of 1 cm to the CTV excluding the posterior margin to minimize dose to the rectum. Critical organs such as femoral heads, rectum and bladder were also drawn according to the Radiation Therapy Oncology Group (RTOG-0815). Reference Shaw, Kline and Gillin20 VMAT plans were calculated using 15 MV photon energy and 6,000 cGy prescribed dose (PD) in 20 fractions on an Eclipse Treatment Planning System (Varian 6.5, Aria 15, Varian Associates, Palo Alto, CA, USA; Helios inverse planning software). A typical treatment plan is shown in Figure 1.
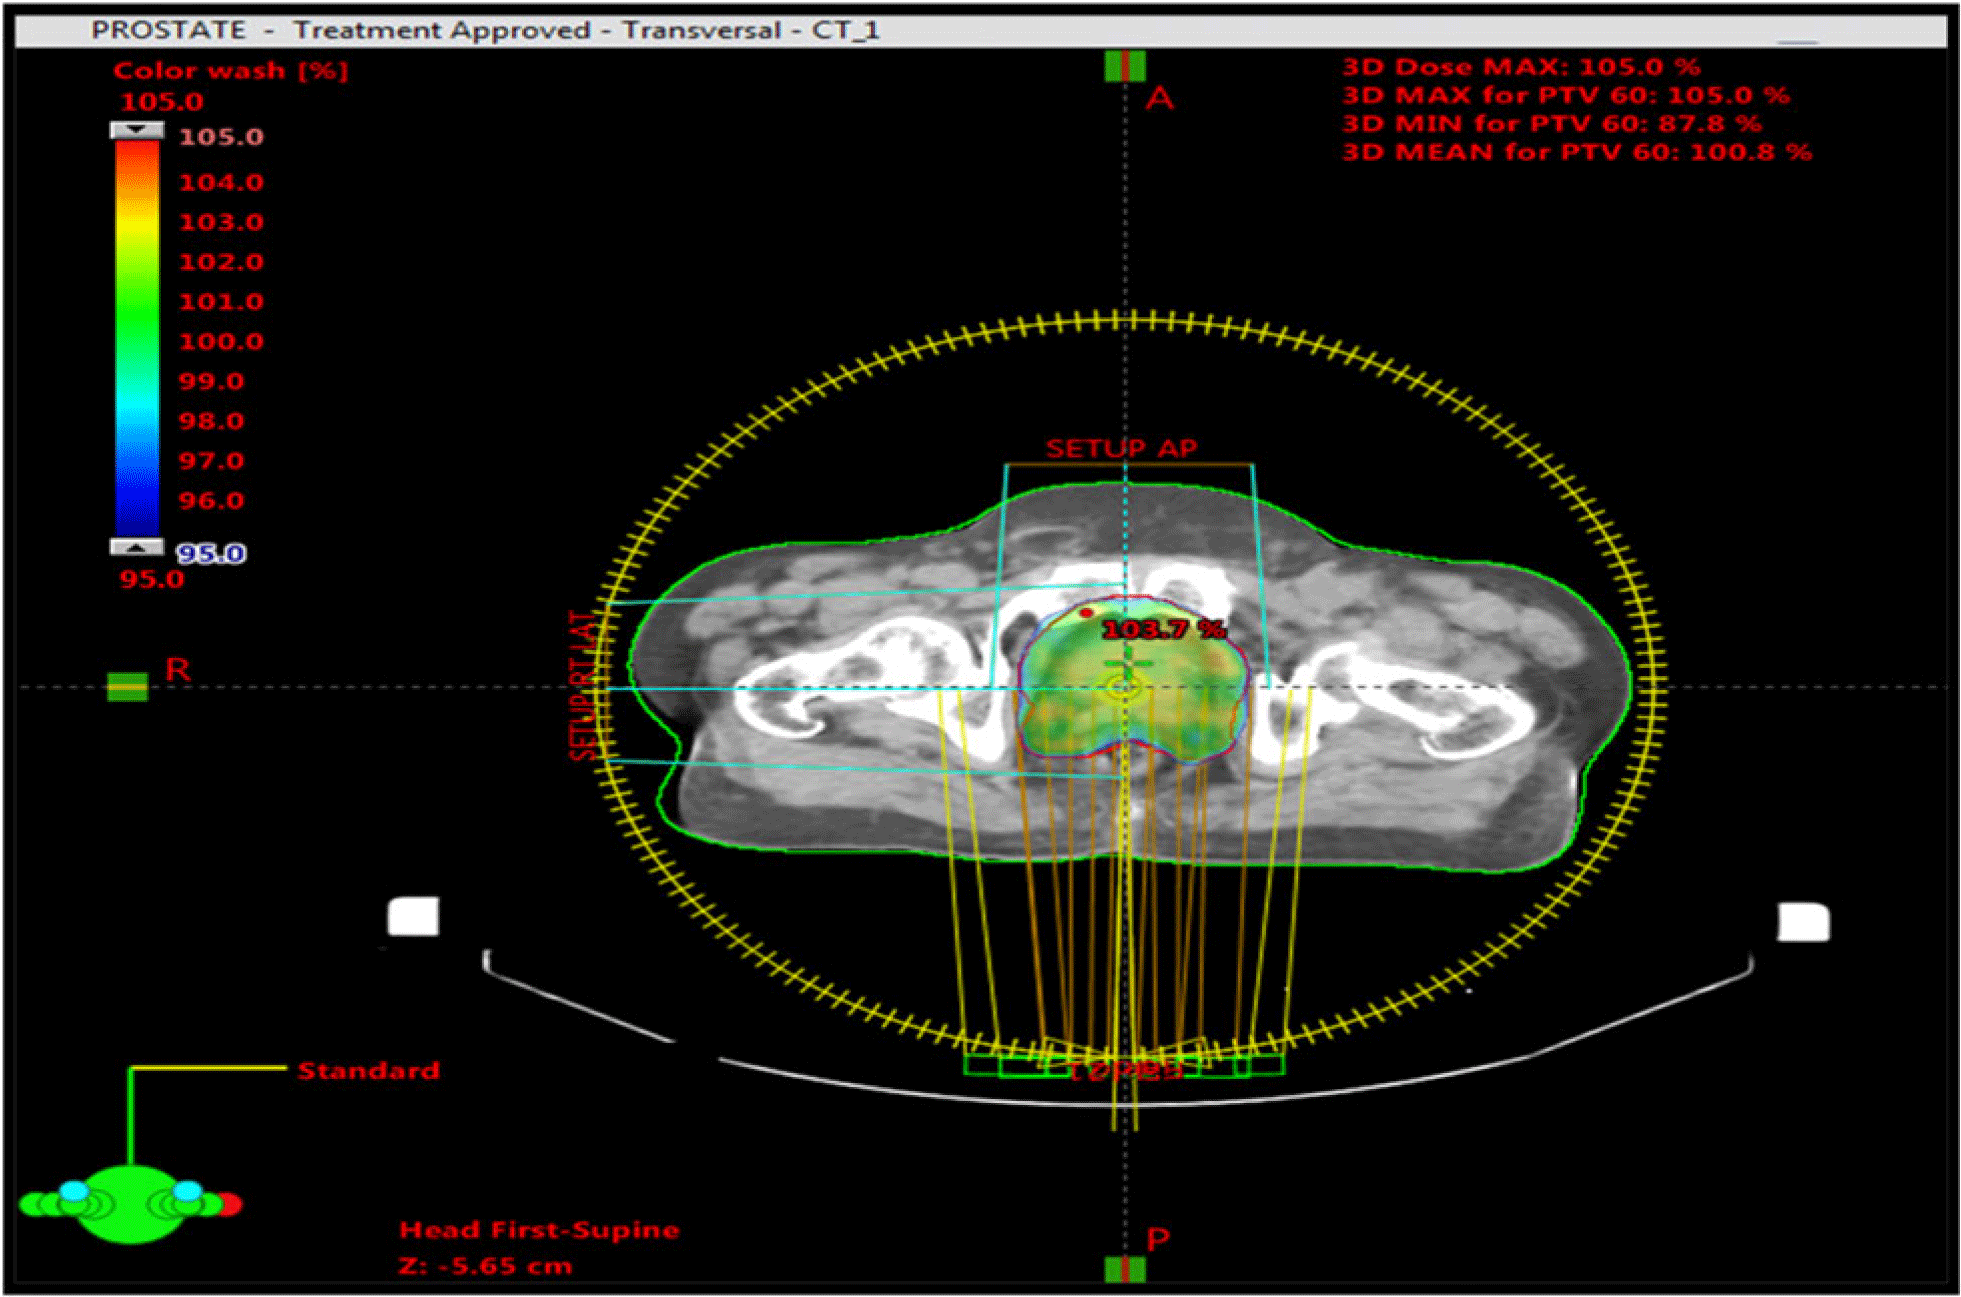
Figure 1. Treatment plan showing PTV and dose distribution in colour wash.
Treatment plans were delivered using Varian Clinac® DHX linac (Varian Medical Systems, Palo Alto, CA, USA) with a high-definition 120-leaf collimator and an electronic portal imager (EPID), which consists of amorphous silicon (aSi) detector technology. The aSi active detector area is 30 × 40 cm, resolution is 512 × 384 pixels (0·78 mm) and maximum image resolution is 1,024 × 768 (0·39 mm).
A cumulative DVH obtained from these plans was used to obtain the PD, maximum dose (D max), minimum dose (D min), dose at 95% of target volume (D 95) and dose at 5% of target volume (D 5) for each patient separately. In this study, only dose values of PTV, shown in Figure 2 by a red line, are considered in calculations. Other lines show the dose delivery to different nearby critical organs. HI and dose coverage were defined by the RTOG in 1993. A figure of merit for dose homogeneity within the target volume is determined as the maximum dose in the treatment volume divided by the prescription dose.
 $${\rm{HI = }}{{\rm{D}}_{{\rm{max}}}}{\rm{/PD}}$$

Figure 2. Dose–volume histogram of prostate patient indicating dose to PTV, red line and other critical structures.
This ratio shall be less than or equal to 2·0, and if achieved, the case will be per protocol. An HI index greater than 2 but less than 2·5 shall be classified as minor deviation. An HI index greater than 2·5 shall be classified as major acceptable. Because of its simplicity, this formula is extensively used in clinical applications. Reference Atiq, Atiq, Iqbal, Shamsi and Buzdar19,Reference Shaw, Kline and Gillin20
If 90% of the prescription isodose line completely encompasses the target, the case is considered per protocol. If 90% of the prescription isodose line does not completely cover the target, it shall be regarded as a major/minor deviation. Reference Atiq, Atiq, Iqbal, Shamsi and Buzdar19
rDHI and mDHI indices, defined by Oliver in 2007, were utilized in this study for VMAT plan verification: Reference Oliver, Chen, Wong, Van Dyk and Perera21
 $${\rm{rDHI = }}\,{{\rm{D}}_{{\rm{min}}}}{\rm{/}}{{\rm{D}}_{{\rm{max}}}}$$
 $${\rm{mDHI = }}\,{{\rm{D}}_{{\rm{95}}}}{\rm{/}}{{\rm{D}}_{\rm{5}}}$$
Here D95 = dose at 95% of target volume, D5 = dose at 5% of target volume.
The UI, proposed by Chitapanarux in 2015, Reference Chitapanarux, Tharavichitkul and Nobnop22 was also calculated.
 $${\rm{UI = }}\,{{\rm{D}}_{\rm{5}}}{\rm{/}}{{\rm{D}}_{{\rm{95}}}}$$
Cumulative DVHs were generated automatically by the treatment planning software from where all the values of doses, that is, D max, D min, D 5, D 95 and PD, were obtained, as shown in Figure 2. Finally, an analysis of the gamma index was performed to find the agreement between the computed dose from TPS and recorded doses using the 3%/3 mm criterion, as shown in Figure 3.

Figure 3. Gamma analysis with 3%/3 mm criterion.
Factors considered in the gamma analysis included area gamma < 1 with 95% tolerance, area gamma > 1·2 with 0·50% tolerance, maximum gamma with 3·5 tolerance, average gamma of tolerance 0·50, maximum and average dose difference and their means and SDs.
Results
In this study, various dose verification indices were calculated for each patient, including HI, coverage, UI, rDHI and mDHI. Statistical analyses showed mean, SD and mean SD error of HI, coverage, UI, mDHI and rDHI as listed in Table 1.
Table 1. Mean, SD and mean SD error of HI, coverage, UI, mDHI and rDHI

Patient-to-patient HI, coverage, UI, rDHI and mDHI were calculated as represented in Graph 1.

Graph 1. Values of HI, coverage, UI, mDHI and rDHI.
Dosage values were taken from the DVHs of the plans. Means of D 5 and D 95 were 6,252·9 and 5,757·4 cGy, respectively, with a PD of 6,000 cGy. The maximum allowable dose within the PTV was <107% of the PD to a volume that was at least 0·03 cc. The minimum allowable dose within the PTV was >95% of the PD to a volume that was at least 0·03 cc, which ranged between 5,700 and 6,420 cGy. While D min ranged from 4,682 to 5,790 cGy in all the planes, D max ranged between 6,485 and 6,345 cGy. D 5, D 95, D max and D min along with PDs of all the patients are shown in Graph 2.

Graph 2. Values of D 5, D 95, D min and D max.
The determination of calculation accuracy indicated that γ < 1 corresponded to locations where the calculation met the acceptance criteria, Reference Elawady, Attalla and Elshemey23 while γ > 1 did not meet the acceptance criteria. In this study, gamma analysis showed that mean area gamma < 1 was 99·12% with a tolerance limit of 95% (Graph 3). Mean area gamma > 1·2 was 0·242% with a tolerance limit of 0·5% (Graph 4). Maximum dose difference was 0·6 control unit (CU) with a tolerance limit of 1·0 CU, and average dose difference was 0·029 CU with a tolerance limit of 0·2 CU.

Graph 3. Area gamma < 1 showing all points passing with a passing rate >95%.

Graph 4. Area gamma > 1·2 showing all points passing with a passing rate <0·5%.
Discussion
Dose computations by advanced TPS and dose delivery need to be verified by accurate dosimetric measurements before implementation in clinical practice. Dose homogeneity and dose conformity are independent specifications of the quality of the absorbed dose distribution. Dose homogeneity characterizes the uniformity of the absorbed dose distribution within the target volume. If the value of HI is closer to 2, it indicates better homogeneity. An HI index greater than 2 but less than 2·5 shall be classified as minor deviation, while an HI index greater than 2·5 shall be classified as major deviation. In the present study, HI showed a favourable outcome with a mean value of 1·01 and SD of 0·04, as shown in Table 1. Graph 1 indicates that HI ranged between 1·01 and 1·09, which is within the acceptable range and no deviation was observed. If 90% of the prescription dose completely covers the PTV, the case is considered per our protocol. If only 80% of the prescription isodose line (but less than 90%) does completely cover the target, this shall be classified as minor deviation. If 80% of the prescription isodose line does not completely cover the target, this shall be classified as major deviation. In this study, we observed neither major or minor deviation in all patient doses, that is, >90% of PTV. Similarly, rDHI >1 depicts a heterogeneous dose distribution (ideal value is 1). Reference Oliver, Chen, Wong, Van Dyk and Perera21 Graph 1 indicates that the value of rDHI did not exceed 1 and ranged between 0·81 and 0·93 with a mean value of 0·86 and SD 0·03, confirming a more homogeneous dose distribution. An HI index closer to zero represents the most homogenous dose distribution. Reference Chitapanarux, Tharavichitkul and Nobnop22 In the present study, mDHI was observed at a mean value of 0·96 and SD of 0·01 (Table 1). HI is hence a good indicator of plan quality and provides an overview of dose inclination within the PTV. Moreover, coverage and UI also showed very low SD (0·019 and 0·143, respectively). Our analysis revealed that there was a level of agreement among various indices.
Results would be further verified by including a larger number of patients. It is recommended that the determination of this parameter be taken into account in clinical practice when investigating a new technique.
According to the ICRU Report 83, 24 homogeneity inside the target volume is considered acceptable if the PTV receives a dose between 95% and 107% of PD. A minimum dose that is <95% but >93% or a maximum dose that is >107% and <110% of the PD will be scored as acceptable according to RTOG-0815. Reference Shaw, Kline and Gillin20 For this study, minimum and maximum allowed doses were 5,700 and 6,420 cGy for acceptable plans, while the observed ranges were 5,657·7–6,413 cGy and considered acceptable. D 5, D 95, D max and D min along with the PD of all patients are shown in Graph 2, indicating the fulfilment of acceptable dose criteria according to international standards.
The gamma index indicates the difference between calculated and measured dose distributions. A gamma index distribution displays regions that pass or fail the acceptance criteria. This has the potential to provide a powerful evaluation of 3D TPS. While area gamma < 1 (i.e. passing rate >95%) corresponds to locations where the calculation meets the acceptance criteria, Reference Elawady, Attalla and Elshemey23,Reference Altaf, Iqbal, Akram and Buzdar25 area gamma > 1 (i.e. passing rate >0·5%) does not meet the acceptance criteria. In this study, gamma analysis showed a mean area gamma < 1 of 99·12% with a tolerance limit of 95%. Graph 3 clearly indicates that none of the plans exceeded the tolerance limit with a minimum passing rate of 97%. The mean area gamma> 1·2 was 0·242%, with a tolerance limit of 0·5%, as shown in Graph 4. The maximum dose difference was 0·6 CU with a tolerance limit of 1·0 CU, and the average dose difference was 0·029 CU with a tolerance limit of 0·2 CU. Graphs 3–5 depict the assessment of the dosimeters with 15 MV. Excellent passing rates were obtained from the gamma analysis with 3%/3 mm criterion compared with planar dose distributions from the TPS for 15 MV.

Graph 5. Maximum and average dose differences versus patient numbers.
Conclusion
VMAT has a strong and growing role in the treatment of several tumours, but it cannot be considered the solution to all clinical cases. Each clinical case must be evaluated on an individual basis, choosing the most favourable radiation technique that will give the best outcomes. VMAT plans showed improved homogeneity and conformity of dose distribution in the target volume. UI and SD values also confirmed better 3D dose homogeneity in the PTV with IMRT. With this method, the maximum dose coverage within the PTV was achieved. Also, the gamma passing rates obtained in the study for prostate cancer depicted excellent results, confirming the strong ability of VMAT plans to be delivered successfully and efficiently. A combination of dose verification method and pre-treatment QA will provide more detailed information about increasing the confidence level of treatment.
Acknowledgement
The authors are very thankful to the Clinical and Radiation Oncology Department, Shaukat Khanum Memorial Cancer Hospital & Research Center, Lahore, Pakistan, for assisting with IMRT/VMAT treatment plans.


