Introduction
The reservoir of an infectious agent is the natural habitat in which the agent normally lives and multiplies. Reservoirs may include humans, animals and environmental sources, and they may or may not be the source from which an agent is transferred to a host (Bonita et al., Reference Bonita, Beaglehole and Kjellström2006; Dicker et al., Reference Dicker, Coronado, Koo and Parrish2011). Rodents are important reservoirs of diseases of relevance to livestock and human health (Han et al., Reference Han, Schmidt, Bowden and Drake2015), so there is considerable interest in understanding endemic infections in natural rodent host populations. The re-emergence of zoonotic diseases of risk to humans heightens the necessity to understand how infections are maintained and transmitted in ecosystems (Morner et al., Reference Morner, Obendorf, Artois and Woodford2002). Understanding natural infections requires knowledge on how host density, which may be very variable in space or time, and seasonality influence pathogen prevalence, as well as knowledge on the role that vectors play in pathogen transmission (e.g. Telfer et al., Reference Telfer, Begon, Bennett, Bown, Burthe, Lambin, Telford and Birtles2007a). In particular, vector-borne pathogens offer the opportunity to determine how vector and pathogen dynamics are linked to host dynamics in order to identify reservoirs and transmission pathways. Rodents are frequently exposed to ectoparasites that transmit pathogens (Gratz, Reference Gratz, Buckle and Smith1994). These are transmitted by arthropods to rodents and from rodents to humans, livestock and domestic animals. Among arthropods, ticks, mosquitoes and fleas are the main vectors of pathogens that constitute a burden to public health. For instance, the dynamics of Trypanosoma microti, a flea-borne protozoan, were strongly influenced by flea dynamics in cyclic populations of field voles (Microtus agrestis) (Smith et al., Reference Smith, Telfer, Burthe, Bennett and Begon2005), whereas vole host density was more influential than flea abundance in explaining the dynamics of a flea-borne bacterium, Bartonella spp. (Telfer et al., Reference Telfer, Begon, Bennett, Bown, Burthe, Lambin, Telford and Birtles2007a). These findings were attributed to fleas exploiting, and being affected by, several host species in the ecosystem.
Coinfections occur when a host is infected by different parasites, at the same time or sequentially. Parasite interactions can result in co-occurrence or in competition between parasites for a shared resource, such as food or habitat, thus affecting host population and resulting in direct interactions. The immune response of the host to one parasite may affect the host's ability to control a second parasite species, and coinfection may favour the transmission and progression of other diseases (Jolles et al., Reference Jolles, Ezenwa, Etienne, Turner and Olff2008; Telfer et al., Reference Telfer, Lambin, Birtles, Beldomenico, Burthe, Paterson and Begon2010). In this case, the presence of a parasite can increase the host susceptibility to be infected with a second parasite or, on the contrary, decrease the probability of infection by another parasite due to an immune response (Cox, Reference Cox2001). Coinfections not only result from the interactions among parasites, but also from shared risk factors such as environmental and climatic conditions, vectors or groups of vectors, host density or host physiological conditions. Many studies have shown that rodents can be simultaneously infected by more than one pathogen (Meerburg et al., Reference Meerburg, Singleton and Kijlstra2009; Buffet et al., Reference Buffet, Marsot, Vaumourin, Gasqui, Masséglia, Marcheteau, Huet, Chapuis, Pisanu, Ferquel, Halos, Vourc'h and Vayssier-Taussat2012; Kallio et al., Reference Kallio, Begon, Birtles, Bown, Koskela, Mappes and Watts2014; Razzauti et al., Reference Razzauti, Galan, Bernard, Maman, Klopp, Charbonnel, Vayssier-Taussat, Eloit and Cosson2015; Koskela et al., Reference Koskela, Kalin-Mänttäri, Hemmilä, Smura, Kinnunen, Niemimaa, Henttonen and Nikkari2017). However, the existence and types of interactions between parasites in natural systems, which may be essential to predict disease dynamics and control parasites, remain poorly known (but see Telfer et al., Reference Telfer, Lambin, Birtles, Beldomenico, Burthe, Paterson and Begon2010).
The common vole (Microtus arvalis) is one of the most abundant and widespread mammals in continental Europe (Jacob and Tkadlec, Reference Jacob, Tkadlec, Singleton, Belmain, Brown and Hardy2010). Throughout its range, common vole populations typically exhibit regular fluctuations in abundance or irruptive outbreaks (Tkadlec and Stenseth, Reference Tkadlec and Stenseth2001; Lambin et al., Reference Lambin, Bretagnolle and Yoccoz2006). The species recently colonized ca. 5 million ha of farmland in northwest Spain during a rapid range expansion (<20 years), coinciding with an increase in the surface area of irrigated herbaceous crops, in particular alfalfa (Luque-Larena et al., Reference Luque-Larena, Mougeot, Viñuela, Jareño, Arroyo, Lambin and Arroyo2013; Jareño et al., Reference Jareño, Viñuela, Luque-Larena, Arroyo, Arroyo and Mougeot2015). Large-scale regional vole outbreaks followed this colonization and occurred every ca. 5 years since early 1980s (Luque-Larena et al., Reference Luque-Larena, Mougeot, Viñuela, Jareño, Arroyo, Lambin and Arroyo2013), with very high vole abundances (>1000 individuals ha−1) during peak phases. These outbreaks have caused unprecedented public health risks because voles carry and amplify the bacterium Francisella tularensis, a highly infectious agent causing tularemia (Rossow et al., Reference Rossow, Ollgren, Hytonen, Rissanen, Huitu, Henttonen, Kuusi and Vapalahti2015; Luque-Larena et al., Reference Luque-Larena, Mougeot, Arroyo, Vidal, Rodríguez-Pastor, Escudero, Anda and Lambin2017). Francisella tularensis prevalence in voles was found to increase with vole abundance (direct-density dependence; Rodríguez-Pastor et al., Reference Rodríguez-Pastor, Escudero, Vidal, Mougeot, Arroyo, Lambin, Vila-Coro, Rodríguez-Moreno, Anda and Luque-Larena2017) and human cases of tularemia were found to greatly increase during vole outbreak years (Luque-Larena et al., Reference Luque-Larena, Mougeot, Roig, Lambin, Rodríguez-Pastor, Rodríguez-Valín, Anda and Escudero2015). As reported in other rodents, common voles from Northwest Spain could be simultaneously infected by other vector-borne pathogens, but the occurrence, dynamics and coinfection patterns of several pathogens remain empirically unknown for these populations, as well as their interactions with vectors. Ticks and fleas can be found on voles, and both vectors can potentially transmit F. tularensis (Hopla, Reference Hopla1974; Bibikova, Reference Bibikova1977) as well as other pathogens. Therefore, to obtain a complete understanding of the dynamics of pathogens, it is necessary to take into account not only the dynamics of the hosts, but also the dynamics of vectors, pathogen interactions (coinfections) and their consequences in the environment.
Here, we investigated the occurrence and dynamics of six vector-borne pathogens of zoonotic risk to humans in fluctuating populations of common voles in Northwest Spain across a sectional study of 2 years. Specifically, we screened every 4 months the occurrence of three tick-borne bacteria (Anaplasma phagocytophilum, Borrelia spp. and Coxiella burnetii), and three flea- and tick-borne bacteria (Bartonella spp., Rikettsia spp. and F. tularensis) that are often reported in voles species (including the common vole) across Europe (Barandika et al., Reference Barandika, Hurtado, García-Esteban, Gil, Escudero, Barral, Jado, Juste, Anda and García-Pérez2007; Telfer et al., Reference Telfer, Lambin, Birtles, Beldomenico, Burthe, Paterson and Begon2010; Buffet et al., Reference Buffet, Marsot, Vaumourin, Gasqui, Masséglia, Marcheteau, Huet, Chapuis, Pisanu, Ferquel, Halos, Vourc'h and Vayssier-Taussat2012; Silaghi et al., Reference Silaghi, Woll, Hamel, Pfister, Mahling and Pfeffer2012; Kallio et al., Reference Kallio, Begon, Birtles, Bown, Koskela, Mappes and Watts2014; Rossow et al., Reference Rossow, Forbes, Tarkka, Kinnunen, Hemmilä, Huitu, Nikkari, Henttonen, Kipar and Vapalahti2014; Rodríguez-Pastor et al., Reference Rodríguez-Pastor, Escudero, Vidal, Mougeot, Arroyo, Lambin, Vila-Coro, Rodríguez-Moreno, Anda and Luque-Larena2017; Fischer et al., Reference Fischer, Spierling, Heuser, Kling, Schmidt, Rosenfeld, Reil, Imholt, Jacob, Ulrich and Essbauer2018). We also investigated whether the prevalence of these pathogens in common voles varied with vole population density and the density of other coexisting potential hosts (the wood mouse Apodemus sylvaticus, and the Algerian mouse Mus spretus). Common voles typically occur at much greater abundances than coexisting mice (Lambin et al., Reference Lambin, Bretagnolle and Yoccoz2006; Rodríguez-Pastor et al., Reference Rodríguez-Pastor, Luque-Larena, Lambin and Mougeot2016), so we expected pathogen prevalence to be more heavily influenced by vole density (positive density dependence). We also looked for associations between vector (flea) and pathogen prevalence to assess whether vectors participated in pathogen transmission. Finally, we investigated coinfection patterns and tested whether the infection probability by a given pathogen varied depending on the presence of a second pathogen.
Material and methods
We held all the necessary licenses and permits for conducting this work: JJLL, FM and RRP held official animal experimentation licenses of level B-C for Spain, and capture permission (permit number 4801646) was provided by the Dirección General del Medio Natural, Junta de Castilla-y-León, Spain.
Study area
The study was conducted in an 80 km2 area of farmland located in Palencia province, Castilla-y-León autonomous region, north-western Spain (42°01′N, 4°42′W), which is recurrently affected by common vole outbreaks (Luque-Larena et al., Reference Luque-Larena, Mougeot, Viñuela, Jareño, Arroyo, Lambin and Arroyo2013). We sampled voles between March 2013 and March 2015, when vole abundance increased region-wide, peaked to outbreak densities in July 2014, and thereafter declined (Luque-Larena et al., Reference Luque-Larena, Mougeot, Roig, Lambin, Rodríguez-Pastor, Rodríguez-Valín, Anda and Escudero2015; Rodríguez-Pastor et al., Reference Rodríguez-Pastor, Escudero, Vidal, Mougeot, Arroyo, Lambin, Vila-Coro, Rodríguez-Moreno, Anda and Luque-Larena2017). Pre-outbreak vole abundance data (2009–2013) were also available (Rodríguez-Pastor et al., Reference Rodríguez-Pastor, Luque-Larena, Lambin and Mougeot2016), allowing us to investigate delayed-density-dependent patterns.
Bacterial zoonoses and small mammals in Spain: background
Six vector-borne pathogens (A. phagocytophilum, Bartonella spp., Borrelia spp., C. burnetii, F. tularensis and Rickettsia spp.) were studied in common voles. Empirical data about the role of the common vole as a reservoir of zoonotic bacteria are very scarce in Spain, although information is available from other sympatric small mammals (Oporto et al., Reference Oporto, Gil, Barral, Hurtado, Juste and Garcia-Perez2003; Gil et al., Reference Gil, Barral, Escudero, Garcia-Perez and Anda2005; Barandika et al., Reference Barandika, Hurtado, García-Esteban, Gil, Escudero, Barral, Jado, Juste, Anda and García-Pérez2007). In northern Spain, tick-borne zoonotic bacteria, such as Borrelia spp., A. phagocytophilum and C. burnetii, have been detected in small mammals, but not the spotted fever group rickettsiae (Barandika et al., Reference Barandika, Hurtado, García-Esteban, Gil, Escudero, Barral, Jado, Juste, Anda and García-Pérez2007). All these pathogens are considered as agents of emerging human diseases (Table S1).
Common vole sampling
Common vole abundance, as well as pathogen and vector prevalence were monitored every 4 months during March, July and November. Voles were live trapped using LFAHD Sherman© traps (8 cm × 9 cm × 23 cm) baited with carrots. At each seasonal sampling, trap lines were set in 24 randomly selected fields and their adjacent margins. Thirty-five traps per trap line spaced by 2 m between each other were operated, with 10 traps set along a margin and 25 traps set perpendicularly inside the field (see Rodríguez-Pastor et al., Reference Rodríguez-Pastor, Luque-Larena, Lambin and Mougeot2016 for more details on the trapping scheme). Traps were opened in the morning and checked the following morning, with a constant vole trapping effort (840 traps set for 24 h per seasonal sampling, making up a total sampling effort of 5880 trap night). Since our trapping method was extractive, we avoided sampling the same fields during consecutive trapping events in order to minimize any potential impact on host populations. Common voles live in sympatry with other rodent species in the area, but the majority of captures were voles (76%; 929/1221), followed by A. sylvaticus (18.5%; 226/1221) and M. spretus (5%; 66/1221). From a total of 929 voles captured between March 2013 and March 2015, a subset of 240 voles (105 males and 135 females) was used for pathogen and vector screening. The selection was based on a representative sample of captured voles that arrived alive at the laboratory and was stratified by seasonal sampling event and vole gender.
Laboratory procedure
Each vole was sexed, weighed and euthanatized through medical CO2 inhalation, following a protocol approved by our institution ethics committee (CEEBA, Universidad de Valladolid; authorization code: 4801646). Immediately after death, each individual was examined for ectoparasites (fleas and ticks) through careful visual inspection and by gently blowing the vole's fur while holding the animal over a white plastic tray (520 × 420 × 95 mm) filled with water. Collected ectoparasites were counted and preserved at room temperature in individually labelled tubes filled with 70% ethanol. Fleas were subsequently identified to species level using a binocular microscope (×10 and ×40 magnification; Nikon Optiphot-2) based on morphological traits following Gómez et al. (Reference Gómez López, Martín Mateo, Martínez and Barrientos2004). Three flea species were identified (Ctenophthalmus apertus, Nosopsyllus fasciatus and Leptopsylla taschenbergi). Ticks were rarely found and collected on voles, so we did not identify ticks to genus and/or species levels, or record the developmental stage (i.e. larva, nymph or adult). Vole carcasses were kept frozen at −23°C until dissection, which followed standard protocols. The spleen and liver were kept separately in labelled tubes and stored at −23°C until used for molecular detection of pathogens.
DNA extraction and multiplex polymerase chain reaction-reverse line blot
DNA was extracted from a homogenized mix of liver and spleen (ca. 25 mg) using commercial kits (QIAamp® DNA Mini Kit, Qiagen, Hilden, Germany) according to the standard procedures of the manufacturer. A multiplex polymerase chain reaction (PCR) was set up for the simultaneous detection of six vector-borne pathogens (A. phagocytophilum, Bartonella spp., Borrelia spp., C. burnetii, F. tularensis and Rickettsia spp.) combined with a reverse line blotting (RLB), as previously described (Anda et al., Reference Anda, Escudero, Rodriguez-Moreno, Jado and Jimenez-Alonso2012). Sensitivity of the multiplex PCR was between 10 and 100 GE (Genome Equivalents), and specificity with unrelated bacteria, mammals and arthropods was 100% (Anda et al., Reference Anda, Escudero, Rodriguez-Moreno, Jado and Jimenez-Alonso2012). All positive samples to any given pathogen were further tested separately using specific probes with an individual PCR and subsequent RLB.
Detection of F. tularensis
We used a phylogenetically informative region of gene lpnA (231 bp) that was amplified by conventional PCR and further hybridization with specific probes by RLB as previously described in Escudero et al. (Reference Escudero, Toledo, Gil, Kovacsova, Rodriguez-Vargas, Jado, Garcia-Amil, Lobo, Bhide and Anda2008). Positive samples were tested using a real-time multitarget TaqMan PCR, using tul4 and ISFtu2 assays (Versage et al., Reference Versage, Severin, Chu and Petersen2003). A negative PCR control as well as a negative control for DNA extraction was included in each group of samples tested. For real-time PCR using tul4, ISFtu2, a type A positive control was used, as type A strains are restricted to North America. Rodríguez-Pastor et al. (Reference Rodríguez-Pastor, Escudero, Vidal, Mougeot, Arroyo, Lambin, Vila-Coro, Rodríguez-Moreno, Anda and Luque-Larena2017) previously screened 243 common voles for a single pathogen (F. tularensis); here, we screened 240 (99%) of these voles for six pathogens (including F. tularensis) using the multiplex PCR (Escudero et al., Reference Escudero, Toledo, Gil, Kovacsova, Rodriguez-Vargas, Jado, Garcia-Amil, Lobo, Bhide and Anda2008).
Identification of Bartonella species infecting voles
Bartonella-positive samples were further analysed using a multiplex PCR targeting the 16S rRNA and the intergenic transcribed spacer (ITS) 16S-23S rRNA. Subsequently, amplicons were analysed with a RLB that included 36 probes for the identification of the different genotypes and species of Bartonella (Garcia-Esteban et al., Reference Garcia-Esteban, Gil, Rodriguez-Vargas, Gerrikagoitia, Barandika, Escudero, Jado, Garcia-Amil, Barral, Garcia-Perez, Bhide and Anda2008; Gil et al., Reference Gil, García-Esteban, Barandika, Peig, Toledo, Escudero, Jado, Rodríguez-Vargas, García-Amil, Lobo, Roales, Rodríguez-Moreno, Olmeda, García-Pérez and Anda2010).
Statistical analyses
We focused on Bartonella and F. tularensis because the other pathogens screened were not detected in voles. We used Generalized Linear Models (GLM) with a binomial error structure and logit link for all the analyses of prevalence, which were done with R v3.4.1 (R Development Core Team, 2017). Model selection was performed using the Akaike Information Criterion for small sample size (Δ-AICc) with the ‘AICcmodavg’ package in R and compared. In order to evaluate hypotheses on pathogen prevalence, we calculated time-varying host population-level covariates and individual-level vole host covariates. The former included mean vole abundance, mean mouse abundance (wood mouse and Algerian mouse pooled) per seasonal sampling (mean rodent abundances were estimated as the average number of captures per 100 traps per 24 h for a given seasonal sampling period), and a mean prevalence of F. tularensis and Bartonella spp. for each seasonal sampling (hereafter, Bartonella spp. refers to all species of Bartonella). Seasonal sampling-specific pathogen prevalence was calculated as the number of voles positive for a particular pathogen, over the total number of voles analysed. Individual-level covariates included vole sex; F. tularensis PCR result (0/1); Bartonella spp. PCR result (0/1); overall flea prevalence (0/1) and flea burden (number per host); species-specific flea prevalence and flea burden (i.e. C. apertus, N. fasciatus and L. taschenbergi separately); tick prevalence and tick burden. Burdens of ectoparasites were estimated as the number of fleas, or ticks, collected per individual vole.
Density dependence: host–pathogen interactions
The probability of a vole being infected (categorical variable: ‘0’ vs ‘1’, as dependent variable) at time t was tested according to vole abundance (at time t), previous vole abundance (4 months before, times t−4) and mouse abundance (wood mouse and Algerian mouse abundance at time t). As host abundance changed seasonally and by sex, the categorical variables season (spring/March, summer/July and winter/November) and sex (male and female) were also included in the initial models. Correlation between vole and mouse abundances at times t and t−4 was tested. In order to address collinearity issues and improve model fitting to the data, vole abundances were log-transformed when included as explanatory variables [ρ between Log (vole abundance t] and Log (vole abundance t−4) = 0.28; ρ between Log (vole abundance t) and mouse abundance t = 0.46; ρ between Log (vole abundance t−4) and mouse abundance t = −0.35). We built a series of GLMs with a binomial error including these different explanatory variables.
Flea–pathogen interactions
We considered flea prevalence (whether or not a vole had fleas) and vole sex as explanatory variables. These models were also fitted for each Bartonella species in turn to examine species-specific relationships. We further tested which flea species better explained the prevalence of Bartonella spp., as well as that of each Bartonella species separately.
Pathogen–pathogen interactions
We used Bartonella spp. prevalence as dependent variable and F. tularensis prevalence, vole abundance at time t and sex, and the two-way interaction between F. tularensis prevalence and vole abundance as explanatory variables. We similarly tested for associations between F. tularensis and each Bartonella species separately.
Results
Pathogens prevalence in common vole
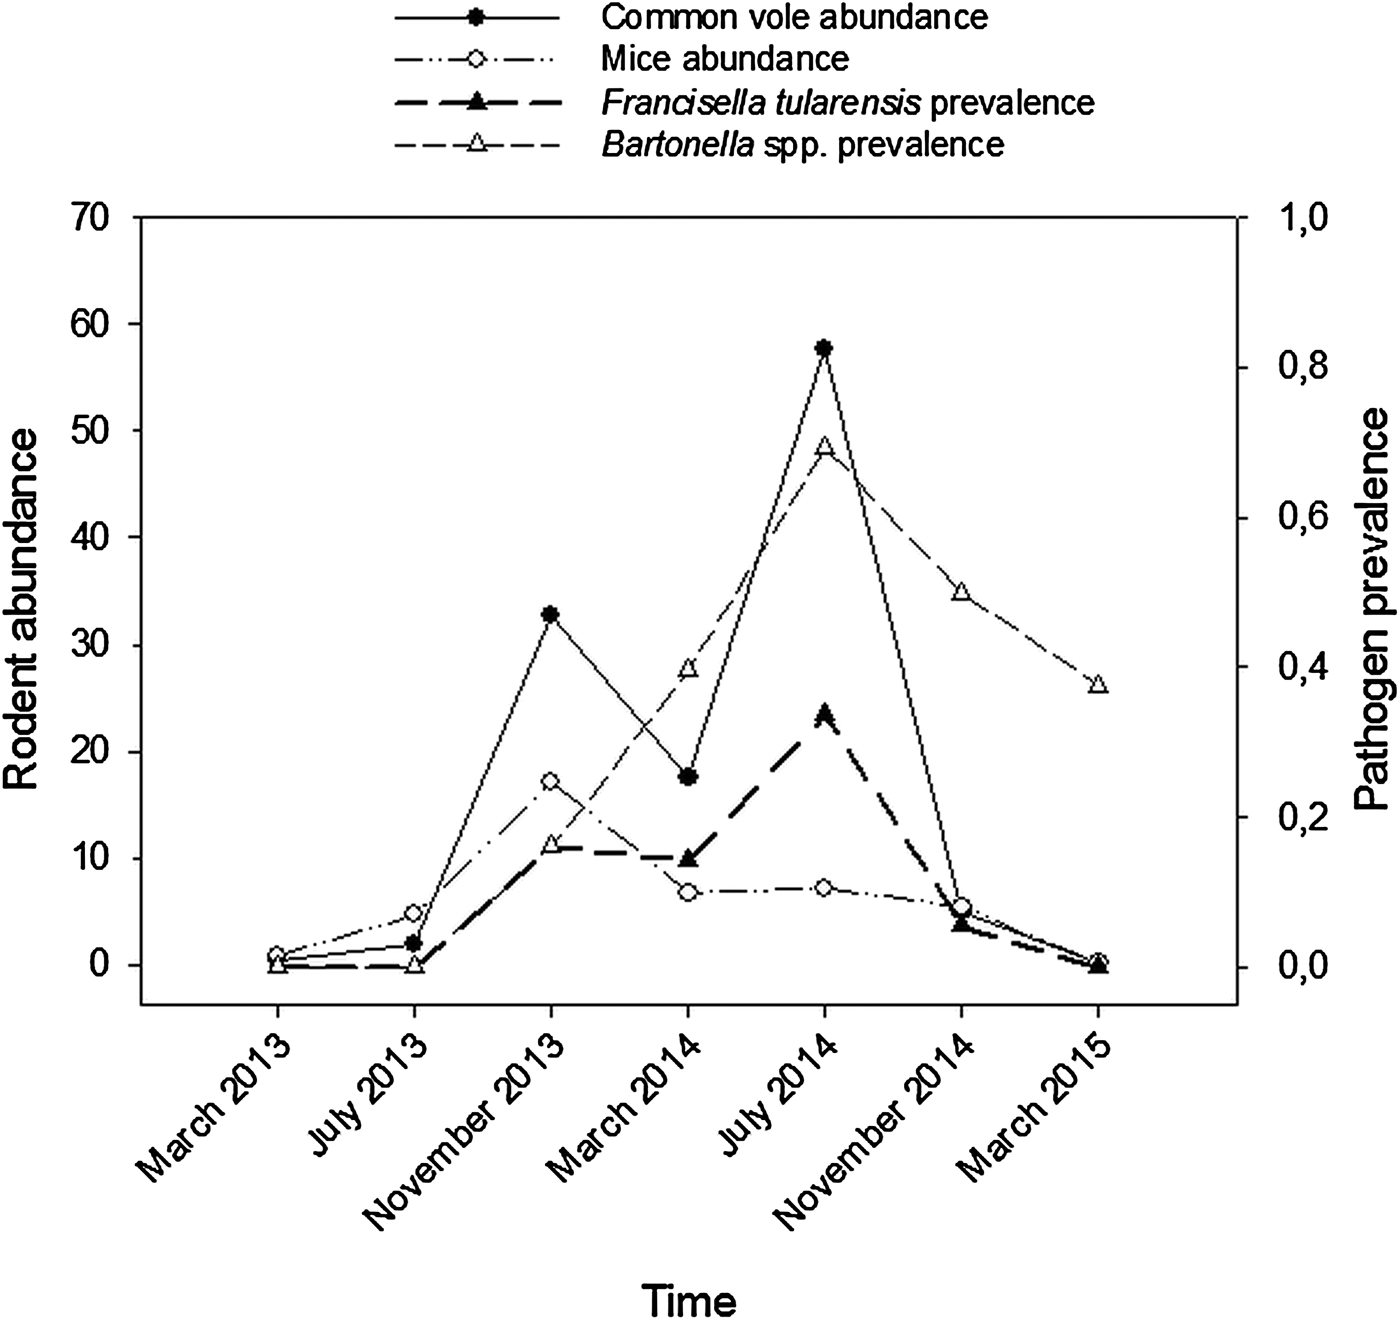
Among the six pathogens screened, only F. tularensis and Bartonella spp. were detected using PCRs. Bartonella spp. prevalence averaged 47% (112/240), with marked differences between seasonal samplings: prevalence was maximum during the summer peak in vole density (July 2014), when 69% (70/101) of voles were infected (Fig. 1). For F. tularensis, we also confirmed that 20% (49/240) of voles were infected on average, and that in July 2014, prevalence peaked at 34% (34/101; Figure 1).

Fig. 1. Temporal changes in rodent abundance and in pathogen prevalence in common vole during the course of the study (March 2013 to March 2015). Common vole abundance (captures/100 traps/24 h) = black solid line and black circles; mouse abundance (wood mouse and Algerian mouse; captures/100 traps/24 h) = black dashed line and white circles; F. tularensis prevalence = thick black dashed line and black triangles; Bartonella spp. prevalence = black dashed line and white triangles.
Bartonella species infecting voles
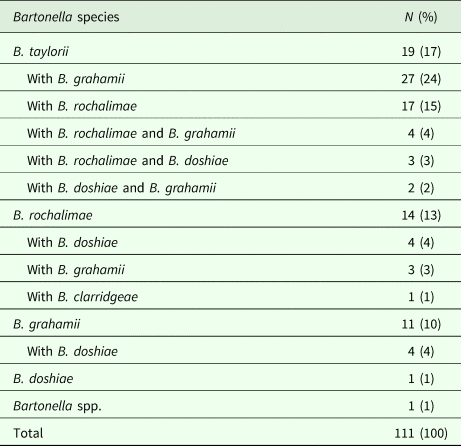
Five Bartonella species were identified among infected voles (Table 1): B. taylorii, B. grahamii, B. rochalimae, B. doshiae and B. clarridgeiae. The most frequent species was B. taylorii, which was detected in 65% (72/111) of the Bartonella-positive voles. Mixed infections with different Bartonella species were detected in 59% (65/111) of the positive voles (Table 1). Moreover, a mix of three different Bartonella species was found in 8% (9/111) of the positive voles. One of the samples reacted with the 16S rRNA probe, but not with any of the other 36 Bartonella species-specific ITS probes (Table 1). Attempts to sequence the ITS amplicon were unsuccessful and the sample was classified as belonging to an unknown Bartonella species.
Table 1. Species-specific occurrence of Bartonella species in infected common voles (n = 111) according to infection type: single Bartonella species infection, or mixed-Bartonella species infection

Density dependence: host–pathogen interactions
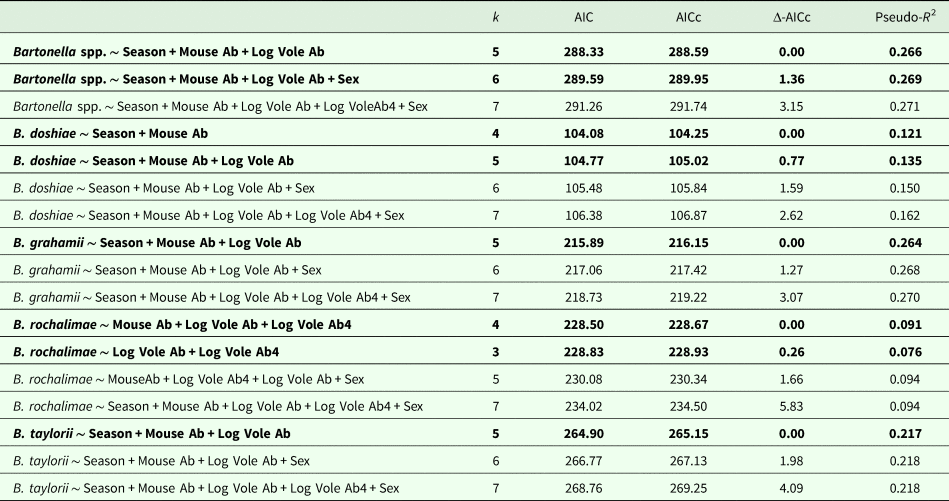
The models that best explained variation in Bartonella ssp. prevalence in voles included vole abundance (direct, positive density dependence), mouse abundance (direct, negative density dependence) and season (see model selection in Table 2 and Fig. 2). Both mouse abundance and vole abundance were statistically significant: vole abundance influenced the prevalence positively [slope ± standard error (s.e.): 3.45 ± 0.80], but mouse abundance influenced the prevalence negatively (−0.39 ± 0.09; Fig. 2). In addition, pathogen prevalence in voles was relatively higher in winter than in summer or spring (Fig. 2).

Fig. 2. Bartonella spp. prevalence in common vole populations according to current common vole abundance (at time t), current mouse abundance (wood mouse abundance and Algerian mouse abundance, at time t) and season. The graphs show model outputs (Table 2), with grey shades denoting 95% confidence intervals of the predicted curves.
Table 2. Results of the Generalized Linear Models (GLMs) describing how host density, sex and season influenced Bartonella spp. prevalence in common voles

The best models (lowest AICs) are highlighted in bold. Vole abundances were log-transformed. Vole Ab: contemporary vole abundance (at time t); Vole Ab4: previous vole abundance (4 months before, time t−4); Mouse Ab: contemporary mouse abundance (wood mouse and Algerian mouse, at time t); Sex: female vs male common vole; Season: spring (from March to July), summer (from July to November) and winter (from November to March).
Two models explained B. doshiae prevalence in voles equally well, and included season and mouse abundance, or these variables plus vole abundance (Δ-AICc < 2; Table 2). Prevalence decreased with increasing mouse abundance (slope ± s.e.: −0.19 ± 0.09), was higher in winter (estimate ± s.e.: 3.12 ± 1.18) and summer (2.02 ± 1.10) than in spring (−3.35 ± 1.09) and increased with vole abundance.
For B. rochalimae, two models also explained equally well prevalence variation in voles (Δ-AICc < 2; Table 2). One model included contemporary and previous vole densities, while the other model also included mouse abundance. However, mouse density was marginally significant, and the omission of this variable improved the significance of vole densities (Table 2). Bartonella rochalimae prevalence increased with current vole density (slope ± s.e. = 0.88 ± 0.48) and with vole density 4 months before (slope ± s.e. = 1.27 ± 0.55). This was the only species of Bartonella that showed a positive delayed-density dependence and its prevalence did not differ between seasons.
Bartonella grahamii and B. taylorii prevalence varied like Bartonella spp. prevalence. In both species, prevalence in voles increased with vole density (slope ± s.e.: 3.20 ± 1.26, for B. grahamii; and 3.61 ± 1.11, for B. taylorii) and decreased with mouse density (−0.40 ± 0.16, for B. grahamii; and −0.50 ± 0.15, for B. taylorii) (Table 2). Bartonella grahamii prevalence was higher in winter (estimate ± s.e.: 1.88 ± 0.88) than in summer (0.53 ± 0.77) and lowest in spring (−3.72 ± 1.09). Bartonella taylorii prevalence in voles was lower in spring (estimate ± s.e. = −2.27 ± 0.79) than in winter (1.54 ± 0.69) and there was a null effect in summer (coefficient not significant).
Flea–pathogen interaction
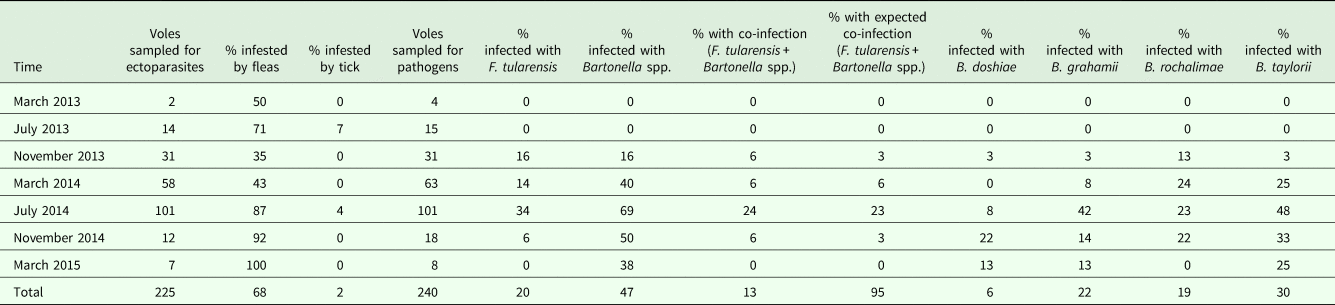
Almost all (94%; 225/240) the voles that were screened during this study arrived alive to the laboratory. Among them, 56% (125/225) were females and 44% (100/225) were males. A total of 153 (68%) voles were infested with fleas, with 643 fleas collected from 70 male voles and 83 female voles. By contrast, only five (2%) voles were infested with ticks, considering both larvae and nymphs (29 ticks collected from four females and one male). The community of fleas was dominated by C. apertus (62%), followed by N. fasciatus (37%), and with L. taschenbergi (1%) occurring in a minor proportion. Details about flea and tick prevalences on voles at each sampling period are shown in Table 3.
Table 3. Prevalence of fleas, ticks, F. tularensis, Bartonella spp. and co-infections (with both F. tularensis and Bartonella spp.) in common voles at each sampling time

Note that sample sizes differ for ectoparasite and pathogen prevalence because only those common voles that did not die in traps were considered for ectoparasite prevalence.
Bartonella spp. prevalence was positively correlated with flea prevalence (estimate ± s.e. = 0.60 ± 0.29). Bartonella spp. prevalence was 1.4-fold higher in voles carrying fleas than in voles without fleas. Considering species-specific prevalence, B. doshiae and B. rochalimae prevalences were not related to flea prevalence, while B. grahamii and with B. taylorii prevalences were 3.5- and 1.8-fold higher when voles had fleas as compared with voles without fleas, respectively (B. grahamii: estimate ± s.e. = 1.49 ± 0.46; B. taylorii: 0.79 ± 0.34).
At flea species level, Bartonella spp. prevalence was 1.4-fold higher when voles had N. fasciatus, but did not differ according to the prevalence of other flea species. This positive association between Bartonella prevalence and N. fasciatus was found in B. grahamii (estimate ± s.e. = 0.75 ± 0.33) and in B. taylorii, but marginally significant (estimate ± s.e. = 0.51 ± 0.29; P = 0.07). There was a positive association between B. doshiae prevalence and C. apertus, but marginally significant (estimate ± s.e. = 1.14 ± 0.64, P = 0.07).
Pathogen–pathogen interaction
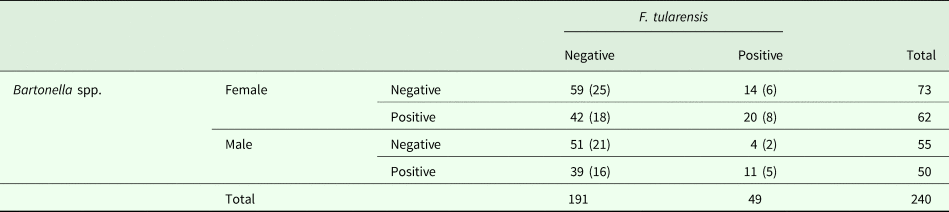
The presence of both F. tularensis and Bartonella spp. was detected in 13% (31/240) of the screened voles (Table 3). Coinfection rate (F. tularensis and Bartonella spp) reached a maximum of 24% (24/101 voles) in July 2014 when voles reached their maximum density (Table 4). Overall, the probability of a vole being infected by both pathogens was not different from that predicted from the prevalence of each pathogen at a given sampling time (Table 3). Coinfection rate was 15% (20/135) in female voles and 10% (11/105) in male voles (Table 4). We observed that the probability of being infected with both pathogens was not different from the predicted prevalence of each pathogen in voles (χ 21 = 6.81, P < 0.05; Table 3). Evidences for association were found for B. grahamii with F. tularensis (χ 21 = 8.24, P < 0.05), B. taylorii with F. tularensis (χ 21 = 7.94, P < 0.05), B. grahamii with B. taylorii (χ 21 = 34.24, P < 0.05), B. doshiae with B. rochalimae (χ 21 = 9.12, P < 0.05) and B. rochalimae with B. taylorii (χ 21 = 15.40, P < 0.05). When vole abundance and sex were considered in the model, the probability of infection with Bartonella spp. did not depend on F. tularensis prevalence, but only depended on vole density (slope ± s.e. = 0.03 ± 0.01). This positive association with vole density was found for B. grahamii (slope ± s.e. = 0.05 ± 0.01) and B. taylorii (0.03 ± 0.01).
Table 4. Occurrences of co-infections with both F. tularensis and Bartonella spp. in studied common voles (n = 240)

‘Positive’ = voles with the pathogen(s); ‘Negative’ = voles without the pathogen(s). Percentages are indicated in parentheses.
Discussion
Prevalence of F. tularensis and Bartonella spp. has been studied in small mammals other than common voles from Mediterranean areas (Márquez et al., Reference Márquez, Rodríguez-Liébana, Pachón-Ibáñez, Docobo-Pérez, Hidalgo-Fontiveros, Bernabeu-Wittel, Muniain and Pachón2008; Gil et al., Reference Gil, García-Esteban, Barandika, Peig, Toledo, Escudero, Jado, Rodríguez-Vargas, García-Amil, Lobo, Roales, Rodríguez-Moreno, Olmeda, García-Pérez and Anda2010; Cevidanes et al., Reference Cevidanes, Altet, Chirife, Proboste and Millán2017; Rodríguez-Pastor et al., Reference Rodríguez-Pastor, Escudero, Vidal, Mougeot, Arroyo, Lambin, Vila-Coro, Rodríguez-Moreno, Anda and Luque-Larena2017), although the relationship between the dynamics of hosts, pathogens and vectors, as well as the interactions between pathogens, has not been studied previously. Our study showed a significant association between host and pathogen dynamics, and that the probability of infection with Bartonella spp. increased with flea prevalence, which is consistent with Bartonella spp. being a flea-borne pathogen. We also provided evidence that the occurrence of one zoonotic pathogen (Bartonella spp.) was not dependent on the occurrence of the other (F. tularensis) in vole populations. Our study was cross-sectional and relatively limited in terms of duration (2 years), so, in order to better tease apart the relative importance of density dependence and seasonality, a longer term investigation of host–pathogen dynamics should follow-up, complemented by longitudinal studies that follow infection dynamics at individual level over time. Despite these limitations, we were able to provide novel insights that we discuss below.
Bartonella infection in voles
Bartonella spp. was the most prevalent bacteria in voles, infecting almost half (47%) of all the voles analysed, while just a fifth (20%) of all the voles were infected with F. tularensis. This Bartonella spp. prevalence falls within the range (between 11 and 72%) of those previously reported in rodents from other European countries (Gutiérrez et al., Reference Gutiérrez, Krasnov, Morick, Gottlieb, Khokhlova and Harrus2015). Bartonella taylorii, B. rochalimae and B. grahamii were the most prevalent pathogens in voles, and there was a high percentage of mixed infections (59%), with dual infections among B. taylorii and B. grahamii being most frequent. This relatively high percentage may be reflecting a host specificity of these species. However, to assert this, it will be necessary to screen the prevalence of the species of Bartonella in other rodents that cohabit with voles.
Density dependence of Bartonella prevalence in voles
An effect of host density on Bartonella spp. prevalence has been demonstrated in several rodent species. For instance, in a study of a Mediterranean peri-urban environment without voles, Bartonella spp. occurrence was positively correlated with wood mouse abundance, the most abundant small mammal of the community, but not with Algerian mouse abundance, despite prevalence being higher in autumn than in spring for both rodent species (Cevidanes et al., Reference Cevidanes, Altet, Chirife, Proboste and Millán2017). In that case, density dependence was tested considering a pool of various species of Bartonella, so the density-dependent pattern may have been masked by the most prevalent species of Bartonella. In another study in a moist Atlantic climate using long-term data from field voles, which also experience abundance outbreaks and are infested by fleas, Telfer et al. (Reference Telfer, Begon, Bennett, Bown, Burthe, Lambin, Telford and Birtles2007a) found that different species of Bartonella exhibited contrasting dynamics in two alternative hosts: field voles and wood mice. The probability of infection with B. doshiae and B. taylorii increased with field vole density, while B. doshiae and B. grahamii increased with wood mouse density. In another study with different rodent hosts (bank voles, Myodes glareolus and wood mice), B. taylorii and B. doshiae were more prevalent in wood mouse, while B. birtlesii was more prevalent in bank vole (Telfer et al., Reference Telfer, Clough, Birtles, Bennett, Carslake, Helyar and Begon2007b). This suggests that the distribution and abundance of each Bartonella species do not follow common patterns and that their response to host density depends on the most abundant, preferred host. These findings highlight that each species of Bartonella has its distribution pattern and abundance, host specificity, seasonality and response to host density. Therefore, studying the relationship between pathogen and host dynamics requires considering each species of Bartonella separately (Telfer et al., Reference Telfer, Clough, Birtles, Bennett, Carslake, Helyar and Begon2007b). In agreement with previous findings by Telfer et al. (Reference Telfer, Begon, Bennett, Bown, Burthe, Lambin, Telford and Birtles2007a, Reference Telfer, Clough, Birtles, Bennett, Carslake, Helyar and Begonb), we provided evidence for a density-dependence response that differed among Bartonella species and rodent hosts: i.e. B. taylorii and B. grahamii responded to both vole and mouse densities, while B. doshiae responded to mouse density (direct response), and B. rochalimae to vole density (direct and delayed responses). The positive direct density dependence to vole density suggests that the pathogen spreads quickly between individuals, and that voles may have low resistance to pathogen infection. Moreover, the negative relationship with mouse density suggests that voles may influence infection prevalence in other coexisting rodent species.
Seasonal variations of Bartonella prevalence in voles
Factors such as seasonality can also determine variation of pathogen prevalence in reservoir hosts. Bartonella spp. prevalence in small mammals follows a seasonal pattern, although results differ among studies: Bartonella spp. prevalence can peak in summer (Paziewska et al., Reference Paziewska, Harris, Zwolińska, Bajer and Siński2012) or in autumn (Cevidanes et al., Reference Cevidanes, Altet, Chirife, Proboste and Millán2017). However, these seasonal patterns are based on a pool of Bartonella spp., not on the prevalence at species level (but see Telfer et al., Reference Telfer, Clough, Birtles, Bennett, Carslake, Helyar and Begon2007b). Overall, we found that Bartonella spp. prevalence in voles was highest during winter (Fig. 2) when taking into account host densities. Altogether, more fleas were collected in spring and summer than during winter. An increase in the infection probability with Bartonella spp. in winter could be the result of an increase in the occurrence of infected alternative hosts, increasing the infection probability in voles. However, we need to know the Bartonella spp. prevalence of the alternative rodent hosts (mice) as well as prevalence in the main vector (fleas) in order to better understand these interactions. At the species level, the infection probability with B. grahamii, B. taylorii and B. doshiae in voles followed a marked seasonal variation, i.e. increased in winter and lowest in spring. Bartonella rochalimae was the only species whose prevalence did not vary seasonally, but was also the one with the lowest prevalence in voles. A seasonal pattern for B. grahamii has been also found in other vole species, but not for B. taylorii and B. doshiae (Telfer et al., Reference Telfer, Begon, Bennett, Bown, Burthe, Lambin, Telford and Birtles2007a). Such seasonal differences may be due to the dynamics and phenology of the fleas that transmit Bartonella spp.
Ectoparasite vectors and Bartonella prevalence in voles
Pathogen prevalence also varies with vector dynamics. Bartonella spp. prevalence has been previously shown to be higher in mice carrying greater flea burdens (Cevidanes et al., Reference Cevidanes, Altet, Chirife, Proboste and Millán2017). In our studied common vole population, B. taylorii and B. grahamii were the most prevalent species and the infection probability increased when voles were infested by fleas, independently of the flea burden. This positive relationship between flea and pathogen was found between N. fasciatus and both species of Bartonella, providing evidence for vector specificity: these bacteria were likely transmitted by N. fasciatus. Indeed, both B. taylorii and B. grahamii have been previously detected in N. fasciatus collected from rodents (Silaghi et al., Reference Silaghi, Pfeffer, Kiefer, Kiefer and Obiegala2016). However, we need to confirm the role of fleas in the transmission process, because when host density and flea prevalence were simultaneously considered, variation in pathogen infection was explained by host dynamics rather than flea prevalence. A lack of effect of flea prevalence on Bartonella dynamics has been previously shown in voles (Telfer et al., Reference Telfer, Begon, Bennett, Bown, Burthe, Lambin, Telford and Birtles2007a). Therefore, our findings should be considered with caution because we do not know which proportion of fleas becomes infected, what species of Bartonella occur in fleas, and whether there are other vectors or modes of transmission. Some species of Bartonella are transmitted by ticks, and others can be transmitted vertically between mother and offspring (Kosoy et al., Reference Kosoy, Regnery, Kosaya, Jones, Marston and Childs1998; Chang et al., Reference Chang, Chomel, Kasten, Romano and Tietze2001). A relatively weaker role of fleas in modulating Bartonella prevalence over time could also be explained by a delayed-density dependence response of flea burden to common vole density as we observed in our study system (a lag of 8 months; unpublished data), but more work is needed to test this hypothesis.
Coinfections with Bartonella and F. tularensis
Coinfection with more than one pathogen seems to be common in wildlife. We found coinfection between Bartonella spp., a flea-borne bacterium, and F. tularensis, a facultative flea-borne bacterium. In the absence of tick-borne infection, the pairwise combination was limited, and the pattern of infection was consistent with concurrent exposure rather than variation in susceptibility. Around 13% of all the common voles screened here were simultaneously infected with F. tularensis and Bartonella spp., and this percentage of coinfection reached 24% during the population peak in July 2014 (see Table 3). The high percentage of individuals infected with two pathogens suggested that there could be some type of interaction modulated by the characteristics of the host and the environment. Coinfections by both bacteria may occur non-randomly, and thus, the infection with F. tularensis may increase the probability of infection with Bartonella spp. or vice-versa. According to Rossow et al. (Reference Rossow, Forbes, Tarkka, Kinnunen, Hemmilä, Huitu, Nikkari, Henttonen, Kipar and Vapalahti2014), field voles and bank voles experimentally and naturally infected with F. tularensis ssp. holarctica readily developed lethal tularemia with similar severity and lesions, which suggests that there is not a chronic or latent infection in voles. On the other hand, experimentation has showed that common voles are less susceptible to be infected with a wild strain of F. tularensis ssp. holarctica than either BALB/c mice (M. domesticus) or yellow-necked mouse (A. flavicollis) (Bandouchova et al., Reference Bandouchova, Sedlackova, Pohanka, Novotny, Hubalek, Treml, Vitula and Pikula2009). Thus, these experimental studies suggest that F. tularensis can be potentially fatal to common voles. Bartonella spp. provokes lasting chronic infection in woodland rodents and can be detected in rodent's blood for several weeks (Birtles et al., 2001). Thus, F. tularensis is expected to cause an acute and lethal infection in common voles, and Bartonella spp. a more chronic but non-lethal infection (Harms and Dehio, Reference Harms and Dehio2012). However, we do not know the average duration of infection by both bacteria in common voles. Voles could be initially infected with Bartonella spp. and later with F. tularenis, killing the animal. However, the initial association among the two bacteria disappeared when we considered host density. The lack of correlation between both pathogens reflected the similarity of percentages of coinfection to those expected by multiplying the percentage of infected individuals by each pathogen independently (see Table 3), so we have no clear evidence of pathogen interaction. This preliminary result about coinfection should be confirmed by experimental studies focusing on interactions between Francisella and Bartonella, and some measures of infection duration in common voles.
Other pathogens
The lack of detection of Rikettsia spp., A. phagocytophilum, Borrelia spp. and C. burnetii in the studied voles could be due to the climatic conditions (seasonally semi-arid Mediterranean climate) and the habitat type (agricultural landscape) of the study area, which may be related to the absence of other more suitable vectors, such as ticks (that infested around 2% of sampled voles). In contrast to our study, and in a region with an Atlantic climate (mild temperature and significant precipitations) in areas surrounding farms, forested and recreational areas, Barandika et al. (Reference Barandika, Hurtado, García-Esteban, Gil, Escudero, Barral, Jado, Juste, Anda and García-Pérez2007) were able to study the prevalence and diversity of Borrelia spp., A. phagocytophilum, C. burnetii and the spotted fever group rickettsiae infecting several species of small mammals: the wood mouse, the yellow-necked field mouse (A. flavicollis), the bank vole, the crowned shrew (Sorex coronatus), the white-toothed shrew (Crocidura russula), the house mouse (M. domesticus) and the European mole (Talpa europaea). They found that infection rates with Borrelia, Anaplasma and Coxiella differed between small mammal species, although like in our study, Ricketssia spp. was not detected. In this other study, however, all the small mammals were heavily infested by ticks.
All the results shown in our study came from one 80 km2 area, so caution should be exercised before generalizing to other common vole populations. Notwithstanding, we found that voles were infected with four species of Bartonella, which had different dynamics according to host density (vole and mice), season and flea infestation. Moreover, voles were infected with Bartonella spp. and F. tularensis, but we did not find a clear pattern of association among pathogens. Future studies could focus on identifying other suitable reservoirs as well as the effect that these pathogens may have on individual voles and how the infective process happens.
Supplementary material
The supplementary material for this article can be found at https://doi.org/10.1017/S0031182018001543
Acknowledgements
We thank José Luis Guzman for helping with fieldwork and Fabio Flechoso for helping with ectoparasite counts and flea identification.
Financial support
R.R.P. was supported by a Ph.D.-studentship from the University of Valladolid (co-funded by Banco Santander, RR 30/04/2014). This work was supported by ECOCYCLES (Partner 5 –EUI2008-03658), ECOVOLE (CGL2012-35348), ECOTULA (CGL2015-66962-C2-1-R) and RESERTULA (CLG2015-66962-C2-2-R) projects funded by Ministerio de Economía y Competitividad, Government of Spain.
Competing interests
None.
Ethical standards
Treatment of animals in this study followed a protocol approved by our institution ethics committee (CEEBA, Universidad de Valladolid; authorization code: 4801646).