


Introduction
Quality of life (QOL) for older adults is affected by a combination of many parameters, from physical and physiological factors to environmental effects, including decreased muscle mass, muscle strength (Rizzoli et al., Reference Rizzoli, Reginster, Arnal, Bautmans, Beaudart, Bischoff-Ferrari, Biver, Boonen, Brandi, Chines, Cooper, Epstein, Fielding, Goodpaster, Kanis, Kaufman, Laslop, Malafarina, Manas, Mitlak, Oreffo, Petermans, Reid, Rolland, Sayer, Tsouderos, Visser and Bruyere2013) and lower bone mineral density (Harvey et al., Reference Harvey, Oden, Orwoll, Lapidus, Kwok, Karlsson, Rosengren, Ribom, Cooper, Cawthon, Kanis, Ohlsson, Mellstrom, Johansson and McCloskey2018), often resulting in frailty. These factors can severely affect flexibility (Rizzoli et al., Reference Rizzoli, Reginster, Arnal, Bautmans, Beaudart, Bischoff-Ferrari, Biver, Boonen, Brandi, Chines, Cooper, Epstein, Fielding, Goodpaster, Kanis, Kaufman, Laslop, Malafarina, Manas, Mitlak, Oreffo, Petermans, Reid, Rolland, Sayer, Tsouderos, Visser and Bruyere2013; Emilio et al., Reference Emilio, Hita-Contreras, Jimenez-Lara, Latorre-Roman and Martinez-Amat2014), balance (Chang et al., Reference Chang, Chi, Yang and Chou2010; Rizzoli et al., Reference Rizzoli, Reginster, Arnal, Bautmans, Beaudart, Bischoff-Ferrari, Biver, Boonen, Brandi, Chines, Cooper, Epstein, Fielding, Goodpaster, Kanis, Kaufman, Laslop, Malafarina, Manas, Mitlak, Oreffo, Petermans, Reid, Rolland, Sayer, Tsouderos, Visser and Bruyere2013) and increase the risk of falls in older adults (Emilio et al., Reference Emilio, Hita-Contreras, Jimenez-Lara, Latorre-Roman and Martinez-Amat2014). Increased nerve damage from lack of movement, measured by nerve conduction studies (NCS), has also been shown to increase the risk of falls (Bergen et al., Reference Bergen, Stevens and Burns2016), resulting in reduced QOL in older adults (Stenhagen et al., Reference Stenhagen, Ekstrom, Nordell and Elmstahl2014; Thiem et al., Reference Thiem, Klaassen-Mielke, Trampisch, Moschny, Pientka and Hinrichs2014). Additionally, increased blood pressure (BP) (Sung et al., Reference Sung, Woo, Kim, Lim and Chung2014), poor cardiovascular health (Gidlow et al., Reference Gidlow, Cochrane, Davey, Beloe, Chambers, Kumar, Mawby and Iqbal2014), and factors contributing to metabolic syndrome (Perez-Tasigchana et al., Reference Perez-Tasigchana, Leon-Munoz, Lopez-Garcia, Gutierrez-Fisac, Laclaustra, Rodriguez-Artalejo and Guallar-Castillon2017), low quality sleep (Petrovsky et al., Reference Petrovsky, McPhillips, Li, Brody, Caffee and Hodgson2018) and diabetes negatively impact QOL in older adults (Rodriguez-Almagro et al., Reference Rodriguez-Almagro, Garcia-Manzanares, Lucendo and Hernandez-Martinez2018). Perhaps most importantly, a decline in memory with ageing is associated with poor QOL (Woods et al., Reference Woods, Weinborn, Li, Hodgson, Ng and Bucks2015; Stites et al., Reference Stites, Harkins, Rubright and Karlawish2018). Environmental factors highlighted in the literature associated with reduced QOL include poor diet (van Doorn-van Atten et al., Reference van Doorn-van Atten, Haveman-Nies, van Bakel, Ferry, Franco, de Groot and de Vries2018) and lack of social life (Shiovitz-Ezra et al., Reference Shiovitz-Ezra, Leitsch, Graber and Karraker2009).
While independent studies have documented improved muscle mass and strength in response to various treatments (e.g. diet, exercise, therapy, etc.) (Ball et al., Reference Ball, Gammon, Kelly, Cheng, Chertoff, Kaume, Abreu and Brotto2013; Crowe and Ball, Reference Crowe and Ball2015), fewer studies have measured the effect of incremental resistance training (RT) on these factors while simultaneously assessing QOL in older adults. Haraldstad et al. (Reference Haraldstad, Rohde, Stea, Lohne-Seiler, Hetlelid, Paulsen and Berntsen2017) and Kekalainen et al. (Reference Kekalainen, Kokko, Sipila and Walker2018) have demonstrated improvements in QOL with 12 weeks and nine months of training, respectively, in studies conducted in traditional laboratory settings which are not always generalisable to real-world settings. It is unknown whether improvements can occur in programmes of shorter duration and whether QOL improvements will occur in a setting more typical of community programmes. Therefore, the aims of this study were to: (a) measure the effect of a community-based (real-world) incremental RT programme on QOL in older adults; (b) measure changes in physical factors like body composition, muscle strength, flexibility and balance, and, further, measure changes observed in physiological factors like nerve damage, BP and heart rate, plasma glucose, insulin, and blood lipids; and (c) compare changes in physical and physiological factors with changes in QOL in older adults after eight weeks of RT.
Method
Study design
The study was approved by the University of Missouri's Health Science Institutional Review Board (#2003712) and registered at ClinicalTrials.gov (Clinical Trial Registration number NCT02677363). The details of the study design (Figure 1) included three visits to the university gym during which participants were recruited (visit 1) and measurements were performed before (visit 2) and after completion of eight weeks of incremental RT training (visit 3).

Figure 1. Study design for the eight-week resistance training programme.
Notes: PAR-Q: physical activity readiness questionnaire. QOL: quality of life. DEXA: dual X-ray absorptiometry. NCS: nerve conduction studies. SpO2: blood oxygen saturation. HR: heart rate. BP: blood pressure.
Recruitment
Study participants were recruited from the Stay Strong, Stay Healthy (SSSH) strength training programme designed for older adults by professionals at the University of Missouri-Extension (Ball et al., Reference Ball, Gammon, Kelly, Cheng, Chertoff, Kaume, Abreu and Brotto2013; Crowe and Ball, Reference Crowe and Ball2015). The SSSH programme is conducted in more than 50 counties in Missouri and is currently being expanded into five other states. Participants in the present study were recruited from Missouri. Eligibility requirements included participants who were already registered for the SSSH programme and had completed the required physical activity readiness questionnaire (PAR-Q) (Public Health Agency of Canada and the Canadian Society for Exercise Physiology, 2002). Participants who reported ‘yes’ for one or more questions on physical limitations on the PAR-Q were required to obtain a physician authorisation before starting the study. Informed consent was obtained from all eligible participants during the first visit. A total of 215 participants were screened over 18 months to recruit the 20 participants in the present study. Additionally, a separate group of 25 participants was screened over eight months to recruit ten participants for NCS using the same recruitment criteria (see Table S1 in the online supplementary material).
Exercise training
All participants were required to complete 16 sessions over eight weeks of incremental RT and measurements were done before and after the community-based programme (visit 3; Figure 1). As shown in Table S2 in the online supplementary material, participants began with one set of five repetitions, and progressed to two sets of ten repetitions, on each of eight different exercises targeting the lower body (wide leg squat, standing leg curl, knee extension, side hip raise and toe stand) and the upper body (bicep curl, overhead press and seated row). Each session lasted approximately one hour and was completed twice weekly for eight consecutive weeks (Ball et al., Reference Ball, Gammon, Kelly, Cheng, Chertoff, Kaume, Abreu and Brotto2013). According to the SSSH protocol, the weights used for hand weights and leg weights were recorded and adjusted weekly based on the assessment of a trained and certified fitness specialist.
Measurements
Anthropometrics and physical fitness
Height, body weight and vital signs were measured during each visit. At baseline and follow-up, body composition was measured by dual X-ray absorptiometry (DEXA, Hologic A version 13.5.2, Marlborough, MA). Fitness (physical healthy/strength) measurements were performed by using the following protocols: 30-second chair stand, chair sit-and-reach left and right, back scratch left and right, eight-feet up-and-go and timed 25-feet walk test. Protocols for these tests have been published previously (Ball et al., Reference Ball, Gammon, Kelly, Cheng, Chertoff, Kaume, Abreu and Brotto2013; Crowe and Ball, Reference Crowe and Ball2015). Additionally, the Mini-Berg test was administered to measure balance (Ball et al., Reference Ball, Gammon, Kelly, Cheng, Chertoff, Kaume, Abreu and Brotto2013; Crowe and Ball, Reference Crowe and Ball2015). The Mini-Berg test required the participants to perform activities: (a) sitting to standing, (b) standing unsupported with eyes closed, (c) reaching forward with outstretched arms while standing, (d) picking up an object from the floor from a standing position, (e) turning to look behind themselves over their left and right shoulders while standing, (f) standing unsupported with one foot in front, and (f) standing on one leg. Each activity was scored from zero to four using an activity-specific grade score, with a maximum total score of 28.
Strength test
Handgrip strength was measured in a seated position using a hydraulic hand dynamometer (BASELINE®, White Plains, NY). The data reported are an average of three measurements with at least a 10-second rest between measurements and by alternating dominant and non-dominant hands which allowed a 20-second rest between all three measurements for each arm.
Cardiovascular measurements
Oxygen saturation in the blood (SpO2, coefficient of variation (CV) 2%) and pulse rate (CV 2%) were measured using a Food and Drug Administration-approved digital pulse oximeter (MeasuPro Fingertip Oximeter OX200, ASIN: B017C0AB2C, UPC: 700358199851, MeasuPro Inc., Chestnut Ridge, NY) every minute for five minutes while the participant was walking at their own pace. Peripheral heart rate and BP were measured using an automatic BP monitor (Omron HEM-712CN2, Omron Healthcare Inc., Bannockburn, IL) after the participant rested for 15 minutes in a seated position. The data represent an average of three measurements taken one minute apart.
Blood tests
Participants fasted for at least 10–12 hours before the blood draw. Total cholesterol, high-density lipoprotein cholesterol, low-density lipoprotein (LDL) cholesterol, triglycerides, haemoglobin A1C (HbA1c), insulin, aldolase activity and creatine kinase were assessed by a clinical laboratory improvement amendments (CLIA)-standardised laboratory (Boyce and Bynum Pathology Laboratory, Columbia, MO). Insulin and lipids were measured via an auto-analyser (Roche Cobas 8000 System, Indianapolis, IN; CV 0.6–0.9% for lipids and 3.5% for insulin) using an electrochemiluminescent immunoassay. Assay kits were used to measure the concentrations of plasma glucose (Wako #439-90901; CV 6.6%), Apolipoprotein B100 (ApoB100) (Mabtech Inc. #3715-1HP-2, Cincinnati, OH) and non-esterified fatty acids (NEFA, Wako #991-121 34891, CV 6.9%). HbA1c was measured via a TOSOH Automated Glycohemoglobin Analyzer (HLC-723G8, South San Francisco, CA; CV 1.6%) using high-performance liquid chromatography. Aldolase was measured by LabCorp (© 2017 Laboratory Corporation of America® Holdings and Lexi-Comp Inc.) on the Olympus AU680 (the low control is 19.9% and the upper control is 3.3%) using the kinetic method (340 nm at 37°C), and creatine kinase-isozymes were measured on the Roche Cobas 502 and the Sebia Hydrasys (CV 5–7%) by AURP Lab (© 2017 ARUP Laboratories) using the quantitative enzymatic/electrophoresis method.
Surveys
Changes in memory were assessed by the Self-Administered Gerocognitive Examination (SAGE) Form-1 (Scharre et al., Reference Scharre, Chang, Murden, Lamb, Beversdorf, Kataki, Nagaraja and Bornstein2010) and the Montreal Cognitive Assessment test (MoCA©) (Nasreddine et al., Reference Nasreddine, Phillips, Bedirian, Charbonneau, Whitehead, Collin, Cummings and Chertkow2005). Dietary behaviour was measured by the MEDFICTS food questionnaire which assesses meats, eggs, dairy, frying foods, and baked goods (e.g., bagels, buns, rolls, biscuits and loaf breads), convenience foods, table fats and snacks (Mochari et al., Reference Mochari, Gao and Mosca2008). Sleep quality was measured using the Pittsburg Sleep Quality Index (PSQI) questionnaire (Buysse et al., Reference Buysse, Reynolds III, Monk, Berman and Kupfer1989) and QOL was measured using a survey developed by the University of Missouri-Extension specialists, used previously (Ball et al., Reference Ball, Gammon, Kelly, Cheng, Chertoff, Kaume, Abreu and Brotto2013).
Statistics and calculations
All statistical analyses were performed using SPSS® (version 24, 2016). For leg weights and hand weights a multivariate regression analysis was performed, while for all other variables a paired sample t-test was performed to compare pre- and post-analyses. Post-hoc analysis was performed using Bonferroni pairwise comparisons if significance was found. Calculations related to body composition, homeostatic model assessment for insulin resistance (HOMA-IR) and adipose tissue insulin resistance (Adipo-IR) are reported in the Methods section in the online supplementary material. For the participants who completed only the NCS studies, anthropometric measurements were obtained and are reported separately in Table S1 in the online supplementary material.
Post-study power calculations
Based on the results obtained from this study. A difference in QOL scores was 5.1 units and the standard deviation (SD) was 4 units. With a 90 per cent power, the number of participants required to obtain a statistical significance in the QOL was N = 13. Future studies investigating QOL can be conducted in the sample size presented in this study. With regard to NCS studies, a difference of 2 m/s was observed for nerve conduction velocity (NCV) and the SD was 4 m/s. With a power of 90 per cent, to obtain a statistically significant difference, at least N = 84 was required and at least N = 63 was required with a power of 80 per cent. Therefore, future studies measuring NCS in older adults should consider a larger sample size.
Missing and excluded data
One participant did not complete the post-fitness tests. Two participants’ blood samples were not collected because of scheduling difficulties. Early on in the study, one participant's SAGE Form-1 information was excluded because she had reading difficulties. Therefore, the alternative MoCA test was utilised for this participant (Nasreddine et al., Reference Nasreddine, Phillips, Bedirian, Charbonneau, Whitehead, Collin, Cummings and Chertkow2005). For completeness, thereafter, the final 14 subjects completed both the SAGE and MoCA. One participant was on a continuous positive airway pressure (CPAP) device for sleeping and, therefore, their PSQI scores were not included in the data.
Results
As shown in Figure 2, the QOL survey indicated an improvement in overall scores by 7.8 per cent. When correlation analyses were performed, after completion of the programme absolute changes in aldolase, an indicator of muscle mass preservation, were significantly associated with absolute changes in memory scores (obtained via SAGE test, r = −0.604, p = 0.012; Figure 3A). Interestingly, higher QOL scores were associated with lower HbA1c levels (r = −0.481, p = 0.097; Figure 3B). Improvements in QOL were significantly and negatively associated with the decrease in total percentage fat mass (r = 0.702, p = 0.003; Figure 3C) and were positively associated with the increase in total percentage muscle mass (r = 0.714, p = 0.002; Figure 3D). Interestingly, improvements in the sleep quality score were positively associated with increases in muscle strength (r = −0.573, p = 0.013 for dominant arm, r = −0.480, p = 0.044 for non-dominant arm, data not shown) and the percentage change in the Mini-Berg test scores, a measure of physical function also associated with percentage change in muscle strength (r = 0.397, p = 0.092 for dominant arm, data not shown; r = 0.460, p = 0.048 for non-dominant arm, Figure 3E). Furthermore, the percentage change in the score obtained on the Mini-Berg fitness test was also significantly and positively associated with the change in QOL scores (r = 0.627, p = 0.009; Figure 3F). The results indicate that those participants who most improved their physical function reported greater QOL.
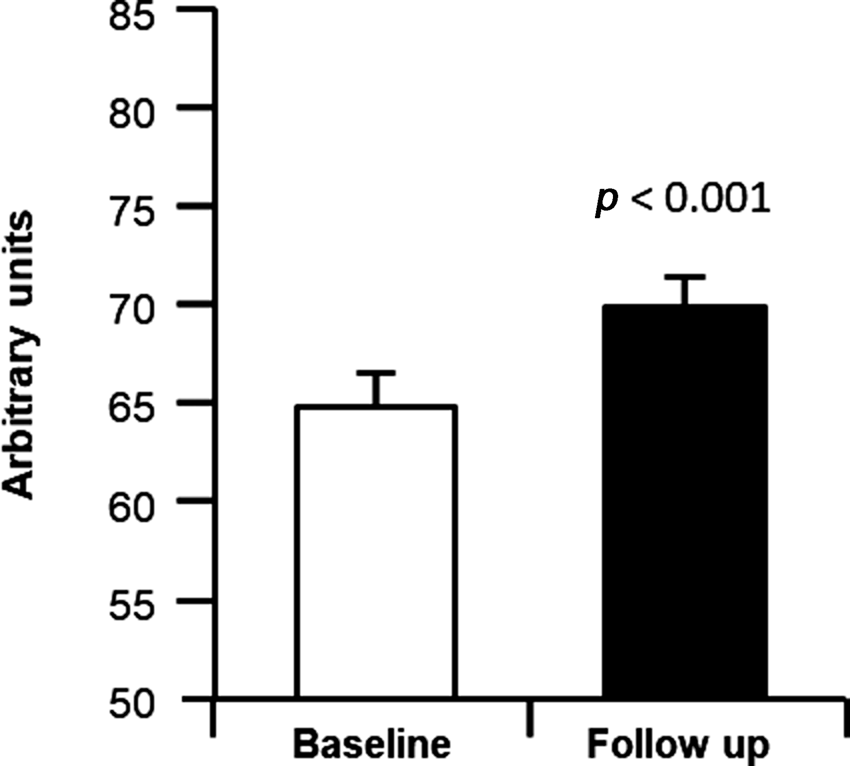
Figure 2. A survey score for quality of life pre- and post-incremental resistance training.
Notes: A score is generated based on responses to the survey. The highest score is 85 and represents the best quality of life. Student's t-test was performed to test the difference between baseline and follow-up of the study: quality of life was significantly improved (p < 0.001).
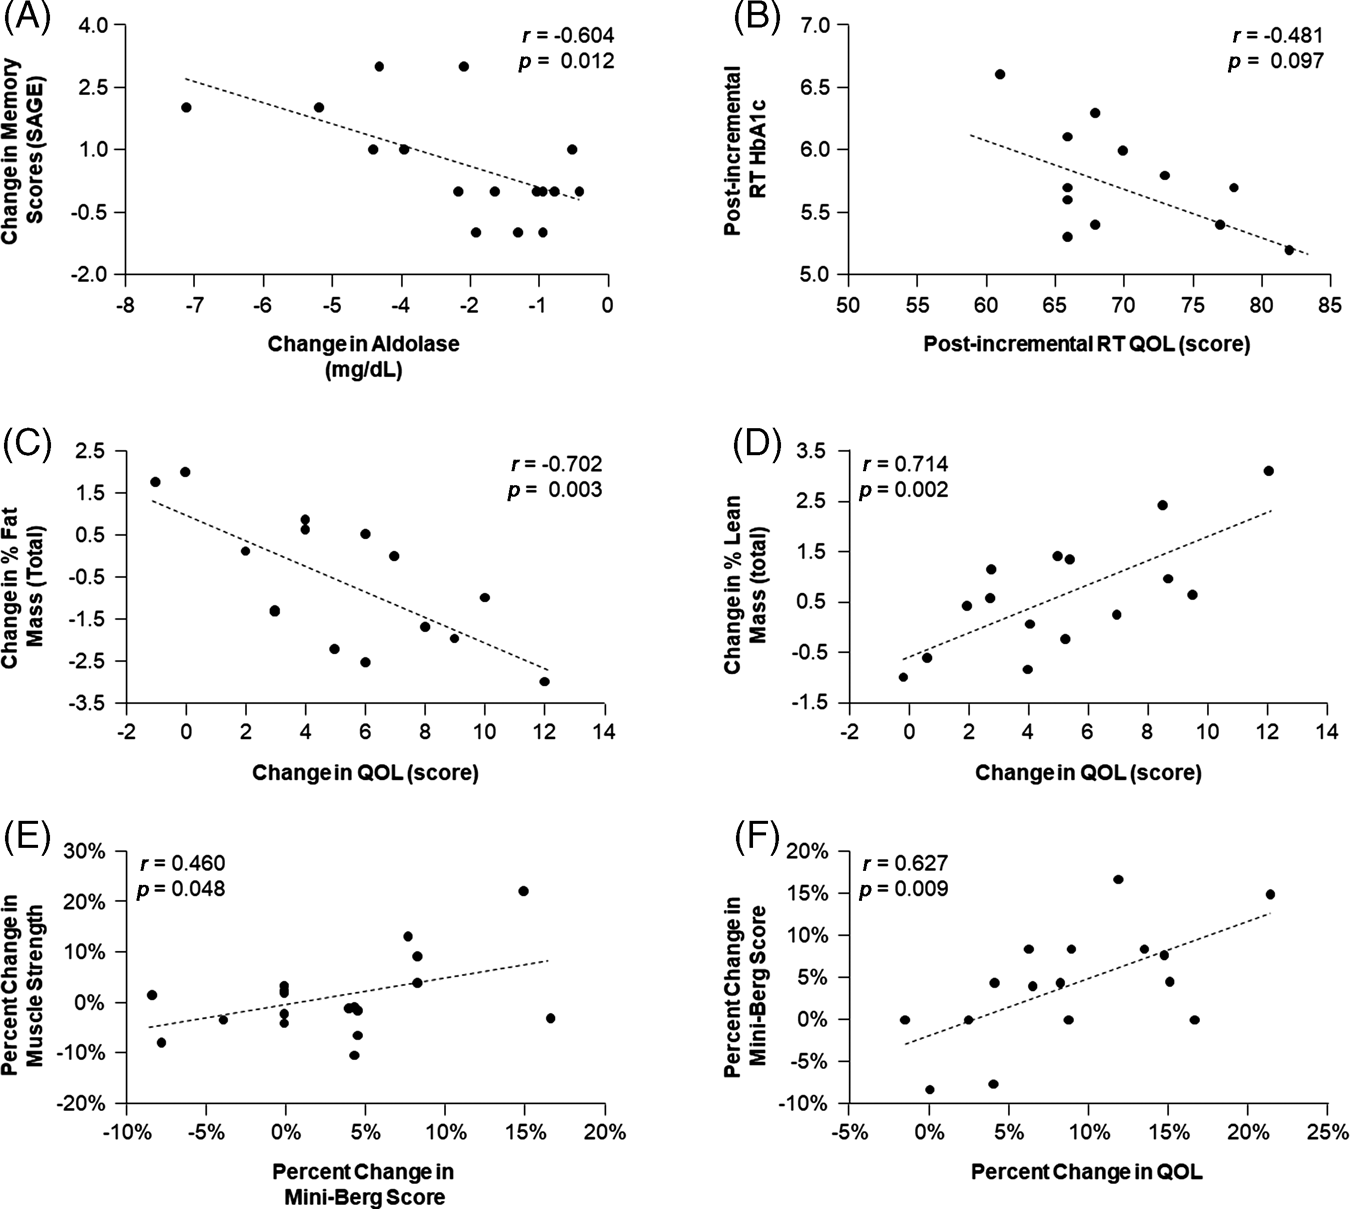
Figure 3. Relationship between memory, aldolase, quality of life (QOL), lean mass, fat mass, muscle strength, physical function and haemoglobin A1C (HbA1C).
Notes: RT: resistance training. SAGE: Self-Administered Gerocognitive Examination.
Anthropometrics, body composition and physical fitness
The participants’ baseline characteristics and follow-up data are reported in Table 1. Although weight loss was not the primary goal of this study, body weight and Body Mass Index both reduced significantly by 1.2 per cent (p = 0.001 and p = 0.002, respectively). Total body fat and trunk fat were significantly decreased (3.2 and 5.2%, respectively) and total lean mass was significantly increased by 1.6 per cent. Total bone mineral density was maintained. As shown in Table 2, consistent with past results (Ball et al., Reference Ball, Gammon, Kelly, Cheng, Chertoff, Kaume, Abreu and Brotto2013, Crowe and Ball Reference Crowe and Ball2015), all measurements of flexibility and balance were significantly improved except for the ‘eight-feet up-and-go’ measure which tended to improve (p = 0.10). The improvements in measures of flexibility (chair stand, sit reach and back scratch) was greater than 5.6 per cent (p < 0.018 for all), while the balance measures (25-feet walk test and Mini-Berg test) improved greater than 3.2 per cent (p < 0.04).
Table 1. Participants’ characteristics and body composition
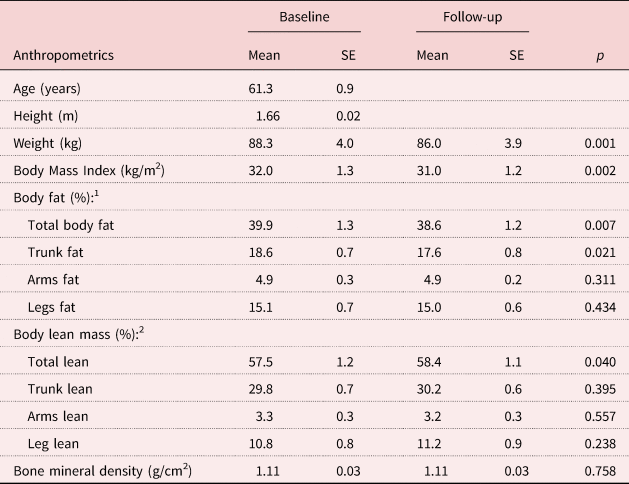
Notes: N = 20. 1. Percentage calculations for body fat: total fat % = [total fat mass (kg)/total body weight (kg)]; trunk fat % = [trunk fat mass (kg)/total body weight (kg)]; arms fat % = [(left arm fat mass (kg) + right arm fat mass (kg))/total body weight (kg)]; legs fat % = [(left leg fat mass (kg) + right leg fat mass (kg))/total body weight (kg)]. 2. Calculations shown in Note 1 were utilised to calculate total lean mass % and regional lean mass %. SE: standard error.
Table 2. Baseline and follow-up measurements for fitness, cardiovascular outcomes, blood tests, memory, food and sleep
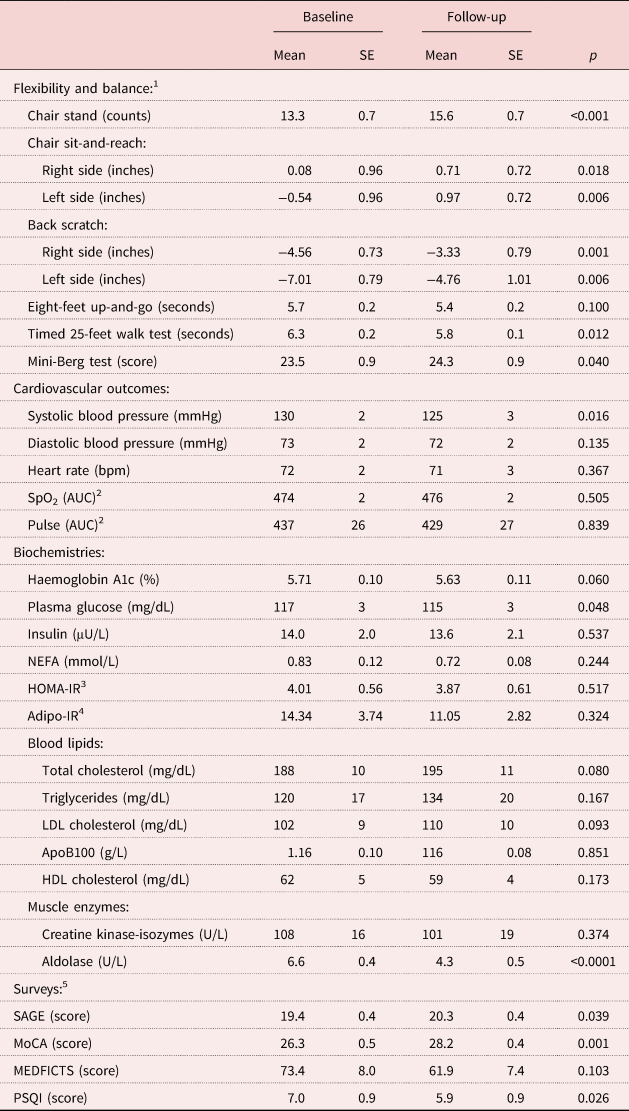
Notes: 1. For the ‘eight-feet up and go test’ and the ‘timed 25-feet walk test’ lower scores indicate better physical function. 2. The area under the curve (AUC) is calculated by measuring the blood oxygen saturation percentage (SpO2) or pulse every minute while the participant is walking for five minutes. The first value was recorded at rest before the subject started walking. 3. Homeostatic model assessment for insulin resistance (HOMA-IR) was calculated using the formula: HOMA-IR = [(glucose in mg/dL × insulin in μU/mL)/405]. 4. Adipose tissue insulin resistance (Adipo-IR) was calculated by using the formula: Adipo-IR = [non-esterified fatty acids (NEFA) in mmoles/L × insulin in μU/L]. 5. Self-Administered Gerocognitive Examination (SAGE): maximum score = 22, normal score = 17–22. Montreal Cognitive Assessment test (MoCA): maximum score = 30, normal score = 26–30. Meats, eggs, dairy, frying foods, in baked goods, convenience foods, table fats and snacks (MEDFICTS): maximum score = 140, need some dietary changes = >70, healthy-heart diet = 40–70, therapeutic lifestyle changes diet = <40. Pittsburg Sleep Quality Index (PSQI): maximum score = 21, good sleep quality = ⩽5, poor sleep quality = >5. For the MEDFICTS and the PSQI, a lower score on the survey is considered to be a good diet and better sleep quality, respectively. LDL: low-density lipoprotein. ApoB100: apolipoprotein B100. HDL: high-density lipoprotein.
For the ten participants who underwent NCS studies, no changes were observed for body weight, heart rate and BP. Median nerve conduction velocity and peroneal nerve conduction velocity also did not change (see Table S1 in the online supplementary material).
Strength test
Handgrip strength tended to improve for the dominant hand by 2.1 per cent (p = 0.06, data not shown). As shown in Figure 4, the amount of hand weights and leg weights used were significantly increased within the first two weeks of the programme and remained significantly higher throughout, nearly doubling by the end of the study.
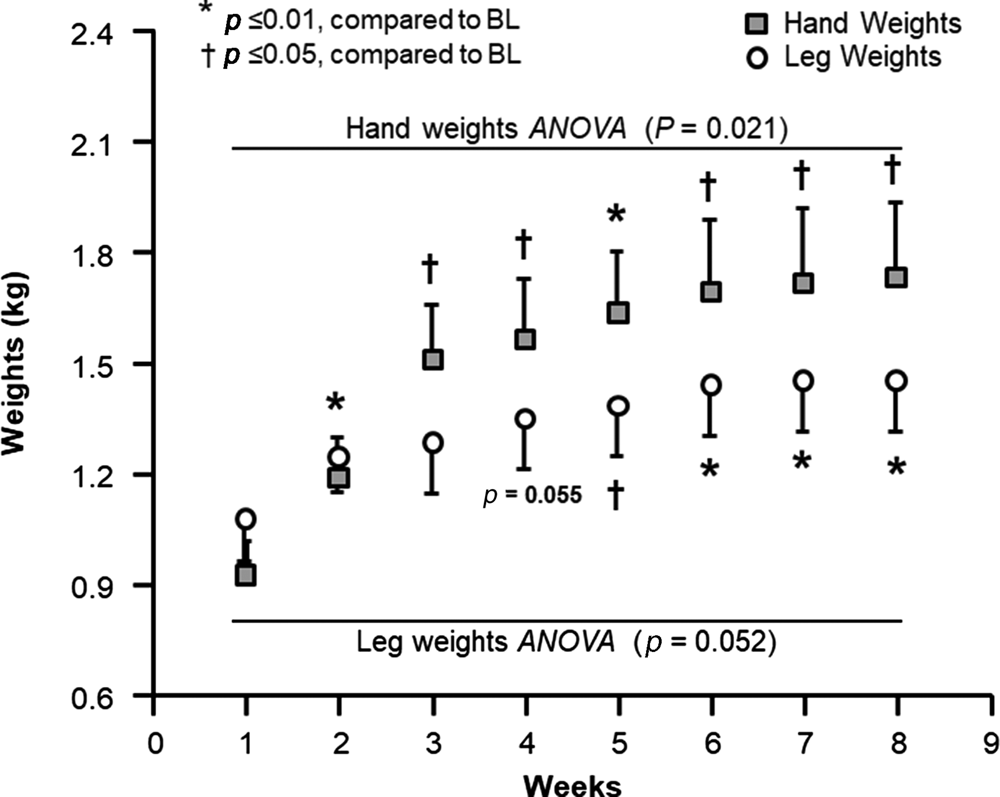
Figure 4. Progression on hand weights and leg weights used during the programme.
Notes: Recorded hand/leg weights were used each week. A multivariate regression analysis was conducted on hand weights and leg weights separately to test the effect of training over time on weight used. There was a significant difference for the hand weights and trend for leg weights over time, therefore, a post-hoc analysis was performed using Bonferroni pairwise comparison. BL: baseline. ANOVA: analysis of variance.
Cardiovascular outcomes
As shown in Table 2, systolic BP (SBP) was reduced significantly by 3.7 per cent with incremental RT (p = 0.016), while diastolic BP (DBP) tended to be lower (2.0%, p = 0.135) and HR did not change (p = 0.367). For SpO2 and pulse, the changes detected during the five-minute walking test were not different between baseline and follow-up.
Biochemistries
As shown in Table 2, HbA1c tended to decrease after completion of the programme compared to baseline (1.3%, p = 0.06). Plasma glucose was significantly reduced by 1.9% (p = 0.048) but no significant changes were observed for fasting insulin, NEFA, HOMA-IR and Adipo-IR, and the total cholesterol and LDL cholesterol tended to increase. Concentrations of triglycerides, high-density lipoprotein cholesterol, ApoB100 and creatine kinase did not change. The muscle enzyme, aldolase, was significantly reduced by 35.6 per cent (p < 0.0001), indicating the prevention of muscle loss (Brancaccio et al., Reference Brancaccio, Lippi and Maffulli2010).
Surveys
Memory scores significantly improved by the end of the programme (Table 2; SAGE, 4.7%, p = 0.039; MoCA, 7.4%, p = 0.001). For the MEDFICTS food intake questionnaire, although not significant, scores shifted from an unhealthy diet range to a healthy-heart diet range of scores (improved by 15.6%, p = 0.103). The quality of sleep was significantly improved by 15.2% (p = 0.026).
Discussion
The main purpose of this study was to measure the effect of the incremental RT programme on QOL in older adults in community settings. Although past studies have investigated the effect of RT on aspects of QOL in older adults (Yang et al., Reference Yang, Ho, Chen and Chien2012; Hsieh et al., Reference Hsieh, Tseng, Tseng and Yang2018; Kekalainen et al., Reference Kekalainen, Kokko, Sipila and Walker2018), the community-based nature of the programme makes these data unique in the literature. Participants improved physical function as evidenced by an increase in muscle mass (1.6%), muscle strength (2.2%), flexibility and balance (3.2–464.2%). The significant decrease in aldolase levels (35.6%) observed is consistent with the increase in muscle mass. Other factors including plasma glucose (1.9%) and SBP (3.7%) improved, while HbA1c tended to improve (1.3%, p = 0.06). These results from a community-based programme extend past observations from laboratory-based controlled trials and demonstrate that significant QOL improvements can be achieved in community settings in older adults (Haraldstad et al., Reference Haraldstad, Rohde, Stea, Lohne-Seiler, Hetlelid, Paulsen and Berntsen2017; Kekalainen et al., Reference Kekalainen, Kokko, Sipila and Walker2018; Syed-Abdul, Reference Syed-Abdul2021).
Anthropometrics, physical function and strength
One surprising finding was the significant reduction in body weight that occurred in these subjects even though weight loss was not a key goal of the programme. The majority of weight loss was predominantly due to a reduction in fat mass (primarily trunk fat mass; Table 1) and, notably, muscle mass was preserved. This finding is wholly in line with the results from previous laboratory-controlled, RT studies (Geirsdottir et al., Reference Geirsdottir, Arnarson, Briem, Ramel, Jonsson and Thorsdottir2012; Zdzieblik et al., Reference Zdzieblik, Oesser, Baumstark, Gollhofer and Konig2015). Previous research has also reported improvements in physical function, i.e. flexibility and balance, and muscle strength, after 12 weeks of RT in older adults (Geirsdottir et al., Reference Geirsdottir, Arnarson, Briem, Ramel, Jonsson and Thorsdottir2012; Zdzieblik et al., Reference Zdzieblik, Oesser, Baumstark, Gollhofer and Konig2015). A study conducted by Lee and Park (Reference Lee and Park2013) also reported improvement in balance by 177.8 per cent after strength training in older adults. A much larger effect (464.2%) was observed in the present study probably because in the study conducted by Lee and Park (Reference Lee and Park2013), participants only performed leg extension and lower curl exercises, whereas in the present study participants performed both upper and lower body exercises. Interestingly, in the current study, participants achieved similar benefits over a shorter duration in a programme delivered by extension specialists.
Nerve conduction studies
No significant changes in medial and peroneal nerve conduction being observed was inconsistent with previous studies conducted in young adults (Sale et al. Reference Sale, McComas, MacDougall and Upton1982; Aagaard et al., Reference Aagaard, Simonsen, Andersen, Magnusson and Dyhre-Poulsen2002). The past studies also assessed the effects of strength training on neural adaptations over periods of 18 and 14 weeks compared to the shorter eight-week duration of the present trial. The study conducted by Sale et al. (Reference Sale, McComas, MacDougall and Upton1982) required weight-lifting, with increasing weights until the participants were exhausted, and the study conducted by Aagaard et al. (Reference Aagaard, Simonsen, Andersen, Magnusson and Dyhre-Poulsen2002) required heavy weight-lifting during the training in individuals with a mean age of 25.3 (SD = 4.7) years. Although participants in the present study were required to increase weights during the programme, high-intensity exercises like ‘heavy weight-lifting’ or ‘exercise till exhaustion’ were not part of the programme. Together these data suggest that improvement of NCS in older adults may require training of greater than eight weeks in duration and higher intensity RT.
Cardiovascular outcomes
RT has been shown to modify coronary risk factors when tested in a formal randomised research study (Pollock et al., Reference Pollock, Franklin, Balady, Chaitman, Fleg, Fletcher, Limacher, Pina, Stein, Williams and Bazzarre2000) and we sought to determine the effects of the programme on cardiovascular health in older adults. The lack of change in resting heart rate is consistent with previous research, which could have been due to either the short duration or the nature of the exercise (i.e. non-aerobic) (Fernandez-Lezaun et al., Reference Fernandez-Lezaun, Schumann, Makinen, Kyrolainen and Walker2017). The programme did improve SBP in older adults, similar to previous observation (Pollock et al., Reference Pollock, Franklin, Balady, Chaitman, Fleg, Fletcher, Limacher, Pina, Stein, Williams and Bazzarre2000).
Blood biochemistries
The study conducted by Geirsdottir et al. (Reference Geirsdottir, Arnarson, Briem, Ramel, Jonsson and Thorsdottir2012) investigated the impact of RT on 237 men and women greater than 70 years of age and found improvements in serum glucose levels in healthy and pre-diabetic groups, which is consistent with the present study in which plasma glucose was reduced by 1.9 per cent (Table 2). HbA1c tended to be reduced (p = 0.06) and after treatment this change predicted improved QOL scores (Figure 3B). With regard to blood lipids, non-significant increases in total cholesterol and LDL cholesterol were observed after eight weeks – a finding consistent with a previous intervention that induced weight loss (Andersen et al. Reference Andersen, Wadden, Bartlett, Vogt and Weinstock1995; Normandin et al., Reference Normandin, Chmelo, Lyles, Marsh and Nicklas2017). This phenomenon is hypothesised to be due to cholesterol efflux from adipose tissue (Phinney et al., Reference Phinney, Tang, Waggoner, Tezanos-Pinto and Davis1991). Lastly, a significant decrease in plasma aldolase enzyme is consistent with the preservation of lean mass in the current study. These data provide evidence that a community-based incremental RT programme improves muscle metabolism to maintain lean mass in older adults.
Surveys
Both of the surveys utilised to measure memory function, SAGE and MoCA, revealed improvements after the completion of the programme. A study conducted by Liu-Ambrose et al. (Reference Liu-Ambrose, Nagamatsu, Graf, Beattie, Ashe and Handy2010) in elderly women demonstrated enhanced memory function after one year of RT. In the current study, similar improvements were observed after only eight weeks. Interestingly, to our knowledge for the first time, absolute changes in memory scores (obtained via the SAGE test) were significantly associated with absolute changes in aldolase (r = −0.604, p = 0.01; Figure 3A), suggesting a link between muscle health and memory function in older adults. In relation to dietary changes, the MEDFICTS questionnaire suggested participants made changes to their diets even when no dietary advice was given. The shift of food scores into a ‘healthy-heart diet’ range (Table 2) suggests that a community-based programme targeted at incremental RT may motivate individuals towarsd better dietary patterns.
With regard to sleep, the PSQI questionnaire showed an improvement in sleep quality, which is consistent with previous research in older adults as presented in the review by Yang et al. (Reference Yang, Ho, Chen and Chien2012). In this review, the duration of previous studies has been at least 10 weeks and these trials were conducted in a controlled setting, i.e. randomised controlled trials. Results from the present study further add to the previous literature in that exercise performed in a community-based setting can improve sleep quality in as little as eight weeks of training in older adults. Interestingly, improvements in the sleep quality score were significantly associated with improvements in muscle strength in both arms (r = −0.573, p = 0.01 for dominant arm, r = −0.480, p = 0.04 for non-dominant arm, data not shown).
Finally, the direct and significant relationships between muscle mass and QOL and improvements in QOL and physical fitness (Mini-Berg score) are notable outcomes of this study and underscore the potential of a community-based programme to improve QOL. The SSSH validated functional tests can be used by other programmes to expand their measurements. Further, it would be important to determine whether the increase in muscle mass and function is related to improvements in QOL in other established community programmes for older adults.
Conclusion
In summary, an eight-week, community-based RT programme significantly improved QOL in older adults in as little as eight weeks. No changes observed in the lipid profile and NCS studies are likely due to the duration of the study and need further investigation.
Supplementary material
The supplementary material for this article can be found at https://doi.org/10.1017/S0144686X20001786
Acknowledgments
The authors would like to thank all the participants and the research staff of this study, Ying Liu and Nhan Le.
Author contributions
MMSA designed the study protocol, conducted the study, collected data, analysed data and wrote the manuscript. CLM conducted nerve conduction studies and wrote the manuscript. EJP co-mentored the study and edited the manuscript. SDB contributed to the study design, co-mentored the study and edited the manuscript. All authors approved the final version.
Financial support
This work was supported by the University of Missouri-Extension, Columbia, Missouri, USA; and the Department of Nutrition and Exercise Physiology, University of Missouri, Columbia, Missouri, USA.
Conflict of interest
The authors declare no conflicts of interest.
Ethical standards
The study was approved by the University of Missouri's Health Science Institutional Review Board (#2003712) and registered at ClinicalTrials.gov (Clinical Trial Registration number NCT02677363). All the procedures were followed according to the Declaration of Helsinki. The results of the study are presented clearly, honestly, and without fabrication, falsification or inappropriate data manipulation.


