INTRODUCTION
Phylogeography targets the principles and processes determining the geographical distribution of genetic lineages at the intraspecific or congeneric levels, which is useful for understanding processes such as population subdivision, speciation and ecological adaptation to past climatic changes (Avise, Reference Avise2000). Historical process associated with climatic oscillations in the Pleistocene ice ages is one of the most important factors in determining the current distribution of marine organisms (Avise, Reference Avise2000). The Western Pacific continental margin accounts for more than 75% of the marginal basins in the modern global sea (Tamaki and Honza, Reference Tamaki and Honza1991). During late Pleistocene glacial cycles, the sea-level-induced environmental alterations were amplified in the marginal seas of Western Pacific, leading to drastic changes in areas and configurations of these seas (Wang, Reference Wang1999), which renders the Northwestern Pacific Ocean an ideal system for understanding the role of sea-level fluctuations during the Pleistocene era in shaping phylogeographic patterns of marine organisms. Numerous studies conducted in this area have concentrated on widely distributed free-living organisms such as fishes (Han et al. Reference Han, Yanagimoto, Zhang and Gao2012), mollusks (Niu et al. Reference Niu, Chen, Wang, Lin and Li2010), crustaceans (Wang et al. Reference Wang, Li and Li2008) and mammals (Chen et al. Reference Chen, Caballero, Zhou and Yang2010). Parasites, as a result of their peculiar life cycle and their close physical associations with their hosts, were often considered to have higher evolutionary potential than that of free-living organisms (Huyse et al. Reference Huyse, Poulin and Théron2005), and are expected to have unique phylogeographical patterns (Plaisance et al. Reference Plaisance, Rousset, Morand and Littlewood2007). Monogeneans, which mainly parasitize fishes (Zhang et al. Reference Zhang, Yang and Liu2001), were considered the ideal subjects for investigation of the dynamics and mechanism of coevolution between parasites and their hosts due to their direct life cycle (no need of intermediate hosts) and high degree of host specificity (Pariselle et al. Reference Pariselle, Boeger, Snoeks, Bilong-Bilong, Morand and Vanhove2011). However, reports of studies on the phylogeography of monogeneans are still very limited (Li et al. Reference Li, Shi, Brown and Yang2011; Shi et al. Reference Shi, Li, Yan, Wang, Yang, Lun, Brown and Yang2014).
There have been comparative studies on phylogeographies of monogeneans, either different species of monogeneans on different species of hosts (Plaisance et al. Reference Plaisance, Rousset, Morand and Littlewood2007) or the same species of monogeneans on different species of hosts (Glennon et al. Reference Glennon, Perkins, Chisholm and Whittington2008). To date, no study on phylogeographies of different species of monogeneans on the same species of hosts has been reported.
During our investigation of fish monogeneans along the coast of China, we found that two species of monogeneans, Pseudokuhnia minor and Kuhnia scombri, on the host, Scomber japonicus, were widely distributed. We therefore carried out research to compare the phylogeographies of these two species of monogeneans on the same species of host along the coast of China. Based on the sequences of mitochondrial cytochrome c oxidase subunit 1 (COI) gene of both parasites from ten localities along the coast of China, we aimed to: (1) test the genetic diversity and demographic history of these two species of monogeneans; (2) compare the phylogeographic patterns and genetic structure of these two sympatric monogeneans on the same host species; and (3) propose scenarios of population expansion and recolonization of these two parasites.
MATERIALS AND METHODS
Sample collection
A total of 264 specimens of P. minor and 224 specimens of K. scombri on the host of S. japonicus were collected from 10 localities along the coast of China from August 2011 to November 2013. Sample locations are as follows: Huludao (HLD, 40°50′N, 121°05′E), Dandong (DD, 39°45′N, 124°08′E), Qingdao (QD, 36°04′N, 120°20′E) and Rudong (RD, 32°20′N, 121°11′E) in the Yellow Sea (YS); Taizhou (TZ, 28°68′N, 121°43′E) and Xiamen (XM, 24°28′N, 118°06′E) in the East China Sea (ECS); Huizhou (HZ, 23°05′N, 114°24′E), Zhanjiang (ZJ, 21°27′N, 110°35′E), Beihai (BH, 21°20′N, 108°47′E) and Sanya (SY, 18°25′N, 109°50′E; Hainan Island) in the South China Sea (SCS). Detailed geographic locations and sample size are given in Fig. 1 and Table 1. Fish samples were purchased from fishermen and morphologically identified to the species in the temporary field laboratory. Parasites were isolated from the gills and identified at the species level by microscopy based on morphological characteristics (Sproston, Reference Sproston1945; Rohde and Watson, Reference Rohde and Watson1985). The identified specimens of parasites, P. minor and K. scombri, were preserved in 95% ethanol for subsequent DNA extraction and analysis.

Fig. 1. Map showing sample localities for Pseudokuhnia minor and Kuhnia scombri. Shaded areas indicate continental shelves that would have been exposed during periods of low sea level. HLD, Huludao; DD, Dandong; QD, Qingdao; RD, Rudong; TZ, Taizhou; XM, Xiamen; HZ, Huizhou; ZJ, Zhanjiang; BH, Beihai; SY, Sanya. This figure was modified after Liu et al. (Reference Liu, Gao, Yokogawa and Zhang2006).
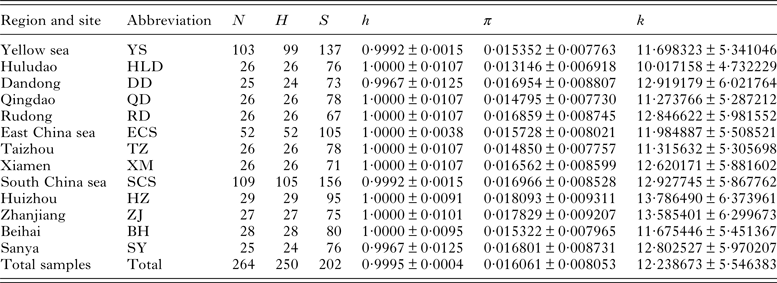
Table 1. Sampling localities, grouped regions and descriptive statistics of genetic diversity of Pseudokuhnia minor
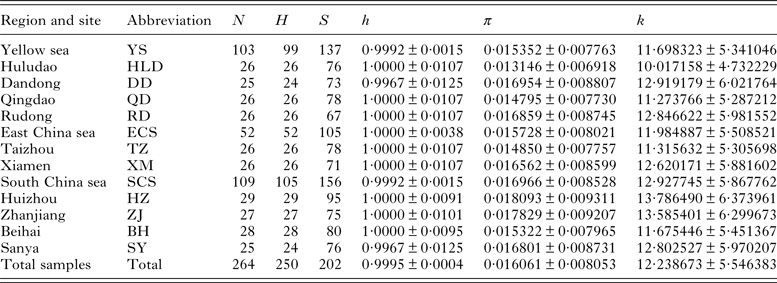
N, sample size; H, number of haplotypes; S, number of segregating sites; h, haplotype diversity (±s.d.); π, nucleotide diversity (±s.d.); k, mean pairwise difference (±s.d.).
DNA extraction, PCR amplification and sequencing
Specimens of each parasite were individually removed from ethanol and placed in Tris EDTA (TE) buffer (100 mm Tris–HCl, 10 mm EDTA) for 30 min, then transferred into deionized water for 10 min to wash away excessive TE buffer. Finally, each individual was put into a 0·2 mL tube containing 19 µL of lysis buffer (Tiangen Biotech, China) with 1 µg µL−1 proteinase K (Tiangen Biotech, China) and incubated at 56 °C for 40 min with shaking, then 94 °C for 10 min to inactivate proteinase K. With the lysate as template, the partial mitochondrial COI was amplified using nested PCR reaction due to the low content of genomic DNA extracted from such a small individual worm. Primers used were as follows: COI_Mono_5: 5′-TAATWGGTGGKTTTGGTAA-3′ (forward) and COI_Mono_3: 5′-TAATGCATMGGAAAAAAACA-3′ (reverse) for the primary PCR amplifications; COI_ Mono_5 (forward) and COI_Mono_int3: 5′-ACATAATGAAARTGAGC-3′ (reverse) for the nested PCR amplifications (W: A/T; K: G/T; M: A/C; R: A/G), just the same as those used by Plaisance et al. (Reference Plaisance, Rousset, Morand and Littlewood2007). Each PCR reaction was performed in a volume of 50 µL containing 5 µL of 10 × reaction buffer, 5 µL of MgCl2 (25 mm), 1 µL of dNTPs (10 mm), 10 pM of each primer, 2·5 units of Ex Taq DNA polymerase (TaKaRa, Dalian, China), 0·25 µL of lysate for the primary amplifications, and 0·25 µL of original product for the nested amplifications. Both the primary and nested PCR amplification were carried out in a Biometra thermal cycler under the following conditions: 5 min initial denaturation at 94 °C, and 35 cycles of 30 s at 94 °C for denaturation, 30 s at 44 °C for annealing, 80 s at 72 °C for extension, and a final extension at 72 °C for 8 min. The final PCR products were purified using the UNIQ-10 Spi Column PCR Product Purification Kit (Sangon, China) and subjected to automated DNA sequencing (BGI, China) with the same primers used for nested amplification.
Data analyses
All analyses were carried out separately for P. minor and K. scombri. Each DNA sequence was edited and aligned by MEGA 6.0 (Tamura et al. Reference Tamura, Stecher, Peterson, Filipski and Kumar2013) and further verified by naked eyes, then translated into amino acid sequences using a flatworm mitochondrial code to insure that no nuclear pseudogenes were amplified.
Molecular diversity indices such as number of haplotypes (H), polymorphic sites (S), transitions, transversions and indels were calculated using Arlequin 3.5 (Excoffier and Lishcer, Reference Excoffier and Lishcer2010). The same software was used to evaluate parameters of haplotype diversity (h; Nei, Reference Nei1987), nucleotide diversity (π; Nei, Reference Nei1987) and the average number of pairwise nucleotide differences (k; Tajima, Reference Tajima1983). Pairwise and overall distances among haplotype sequences were calculated in MEGA 6.0 (Tamura et al. Reference Tamura, Stecher, Peterson, Filipski and Kumar2013).
Modeltest 3.7 (Posada and Crandall, Reference Posada and Crandall1998) was used to determine the best substitution model for both parasite species based on the Hierarchical Likelihood Ratio Tests. Consequently, the Tamura and Nei evolutionary model (Tamura and Nei, Reference Tamura and Nei1993) with the gamma shape parameter (G = 0·6798 for P. minor and G = 1·1714 for K. scombri) was selected for both species and applied to the subsequent analyses of phylogenetic relationship and molecular variances [analysis of molecular variances (AMOVA)].
Both neighbour-joining (NJ) (Saitou and Nei, Reference Saitou and Nei1987) and Bayesian inference (BI) methods were adopted to reconstruct the phylogenetic tree, by MEGA 6.0 with 1000 bootstrap replicates and MrBayes version 3.2.1 (Ronquist et al. Reference Ronquist, Teslenko, van der, Ayres, Darling, Höhna, Larget, Liu, Suchard and Huelsenbeck2012) respectively, with Mazocraeoides gonialosae (Monogenea, Mazocraeidae) as an outgroup. For well supported clades, the divergence time was estimated from net divergence by the formula t = d A/2μ (Nei and Li, Reference Nei and Li1979), in which μ is the mutation rate of the specific gene, and d A was obtained by MEGA using Tamura and Nei model with gamma shape parameter given by Modeltest. In addition, genealogical relationships were examined by constructing haplotype networks in Network 4.6.1.1 (http://www.fluxus-engineering.com) using the median-joining network (MJN) approach (Bandelt et al. Reference Bandelt, Forster and Röhl1999) with Maximum Parsimony (MP) Calculation (Polzin and Daneshmand, Reference Polzin and Daneshmand2003).
Using Arlequin 3.5 (Excoffier and Lishcer, Reference Excoffier and Lishcer2010), the AMOVA was performed to characterize population structure by F-statistics at three subdivided geographical hierarchical levels: the proportions of variations among regions (F CT′), among populations within region (F SC′) and within populations (F ST′). The three regions as divided represent three marginal seas of China, i.e. the Yellow Sea, the ECS and the SCS. The significance of the covariance components associated with the different levels of genetic structure was determined by a permutation test of 5000 times. Genetic differentiation of paired local populations was evaluated by pairwise fixation index (F ST), which includes information of both mitochondrial haplotype frequency and genetic distances. For each pairwise comparison, the significance of the F ST was tested by 10 000 permutations. To test whether the observed distribution of frequencies coincides with the expectation under panmixia (Raymond and Rousset, Reference Raymond and Rousset1995), the exact test was performed for the differentiation of haplotypes among different local populations to test the null hypothesis of population panmixia. Probabilities were estimated by permutation analyses using 10 000 randomly permuted r (populations) × k (different haplotypes) contingency tables of haplotype frequencies.
The historical demographic patterns of P. minor and K. scombri populations were examined by two different approaches. First, the frequency distribution of pairwise differences among all haplotypes (mismatch distribution) was tested under the sudden expansion model of Rogers (Rogers and Harpending, Reference Rogers and Harpending1992; Rogers, Reference Rogers1995). The mismatch distribution is usually multimodal in samples drawn from populations at demographic equilibrium, but it is usually unimodal in populations which have undergone recent population expansions in demography and range (Rogers and Harpending, Reference Rogers and Harpending1992). Past demographic parameter τ (time since expansion expressed in units of mutational time) was estimated (Rogers and Harpending, Reference Rogers and Harpending1992). Deviations from the estimated demographic model were evaluated by the tests of Harpending's raggedness index (Harpending, Reference Harpending1994) and the sum of squared differences (SSD) with a parametric bootstrapping approach using 10 000 replicates. Given that mismatch distributions were generally very conservative (Ramos-Onsins and Rozas, Reference Ramos-Onsins and Rozas2002), both Tajima's D (1989) and Fu's F S (1997) tests were adopted to test the neutrality. Tajima's D test compares two estimators of the mutation parameter θ, Watterson's estimator θs and Tajima's estimator θπ; significance of the D value is associated with population expansion, bottlenecks and selection (Tajima, Reference Tajima1989). In Fu's F S test, the number of haplotypes observed is contrasted with that expected in a random sample under the assumption of an infinite-sites model without recombination (Fu, Reference Fu1997). F S is sensitive to demographic expansion, which generally leads to a significant negative value of F S. Both mismatch analysis and neutrality tests were performed in Arlequin 3.5.
The values of τ generated by mismatch distribution analysis were utilized to estimate the time back to the expansion by the equation τ = 2ut (Rogers and Harpending, Reference Rogers and Harpending1992), in which u is the mutation rate of sequence in one generation and calculated by the equation u = 2 µk, where μ is the mutation rate per nucleotide and k is the number of nucleotides included in analyses. Finally, the approximate time of expansion in years was obtained by multiplication of t and the generation times of P. minor and K. Scombri, respectively. Neither the generation times nor the mutation rate of the COI gene of these two parasites have been determined; so a generation time of 1 year and the mutation rate of 10% per million years used for M. gonialosae, a mazocraeid (Li et al. Reference Li, Shi, Brown and Yang2011), were used as reference values for the two mazocraeids examined in the present study.
RESULTS
Genetic diversity
Partial sequences of COI gene were obtained from 264 individuals of P. minor and 224 individuals of K. scombri on the host, S. japonicus, sampled in 10 localities along the coast of China (Table 1). All haplotype sequences were deposited in GenBank under accession number KU379830 – KU380079 (P. minor) and KU380080 – KU380243 (K. scombri).
For the 264 partial sequences of 762 bp of P. minor, a total of 202 polymorphic sites including 138 parsimony informative ones were detected, including 191 transitions, 45 transversions and no indels. Sequence divergence (Tamura and Nei distance) among haplotypes ranged from 0·1 to 4·8%, with an average of 1·6%. The average base composition was as follows: A = 26·16%, T = 38·17%, C = 15·83%, G = 19·84%, characterized by A+T rich. Among 250 haplotypes defined, with the exception of 10 which are shared by two to four individuals, all others are unique. The haplotype diversities (h) were high for all local populations, with the value of 1·000 for 8 of 10 localities and an overall value of 0·9995. However, the nucleotide diversities (π) were generally low, ranging from 0·013146 to 0·018093 and an overall value of 0·016061 (Table 1).
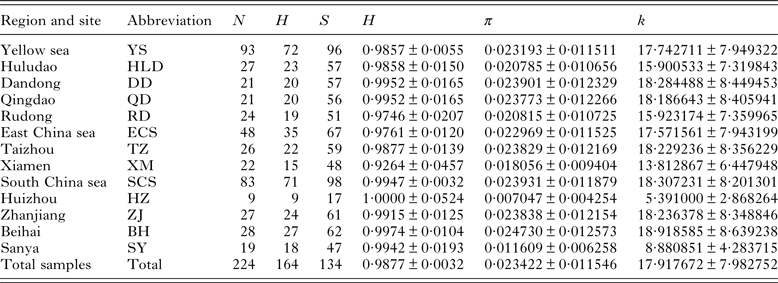
The fragment length of COI gene obtained from K. scombri was 765 nucleotides, including 134 polymorphic sites (of which 84 were parsimony informative) with 191 transitions, 27 transversions and no indels. Sequence comparisons revealed 164 haplotypes in 224 individuals, most of which are unique, but with 17 that are shared among different local populations. Sequence divergence (Tamura and Nei distance) among haplotypes ranged from 0·1 to 5·6%, with an average of 2·4%. The nucleotide composition of the fragment was also characterized as A + T-rich (A: 24·87%, T: 38·67%). The overall diversities of haplotype and nucleotide were 0·9877 and 0·023422 respectively, indicating a high level of haplotype diversity and low nucleotide diversity (Table 2).
Table 2. Sampling localities, grouped regions and descriptive statistics of genetic diversity of Kuhnia scombri
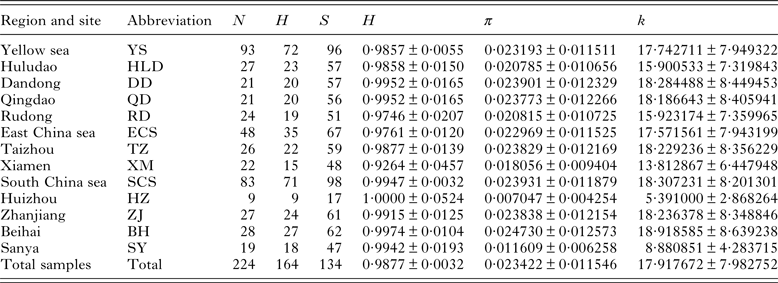
N, sample size; H, number of haplotypes; S, number of segregating sites; h, haplotype diversity (±s.d.); π, nucleotide diversity (±s.d.); k, mean pairwise difference (±s.d.).
Phylogenetic analysis
Based on the sequences of the partial COI gene of P. minor, the NJ tree reconstructed using Tamura and Nei model with the gamma distribution 0·6798 was composed of two clades with high bootstrap support values (Fig. 2). Haplotypes from all 10 sample localities along the coast of China were irregularly scattered in these two clades. Except for a few differences in some small branches, the topology of the BI tree was very similar to that of the NJ tree presented here, and the posterior probabilities of the BI tree were also provided for the main clades of NJ tree (Fig. 2). Likewise, the network analysis also revealed two clusters with star-like patterns, and the haplotypes in the two clusters correspond to those in the two clades presented in the NJ tree (Fig. 3). Net average genetic distance (Tamura and Nei with gamma correction) between the two clades was 2·1%. Utilizing the mutation rate of 10% per million years (Li et al. Reference Li, Shi, Brown and Yang2011), it can be estimated that the separation occurred approximately 105 000 years ago, during the late Pleistocene era.

Fig. 2. Neighbor-joining tree for cytochrome c oxidase subunit 1 (COI) gene haplotypes of Pseudokuhnia minor. Bootstrap supports of >80% are shown at nodes. Bayesian posterior probabilities (1000 replications) are provided for main clades in a bold font.

Fig. 3. Median-joining network for COI haplotypes of Pseudokuhnia minor. The sizes of the circles are proportional to haplotype frequency and the colours represent the population (HLD, Huludao; DD, Dandong; QD, Qingdao; RD, Rudong; TZ, Taizhou; XM, Xiamen; HZ, Huizhou; ZJ, Zhanjiang; BH, Beihai; SY, Sanya) to which they belong; small hollow circles represent missing haplotypes.
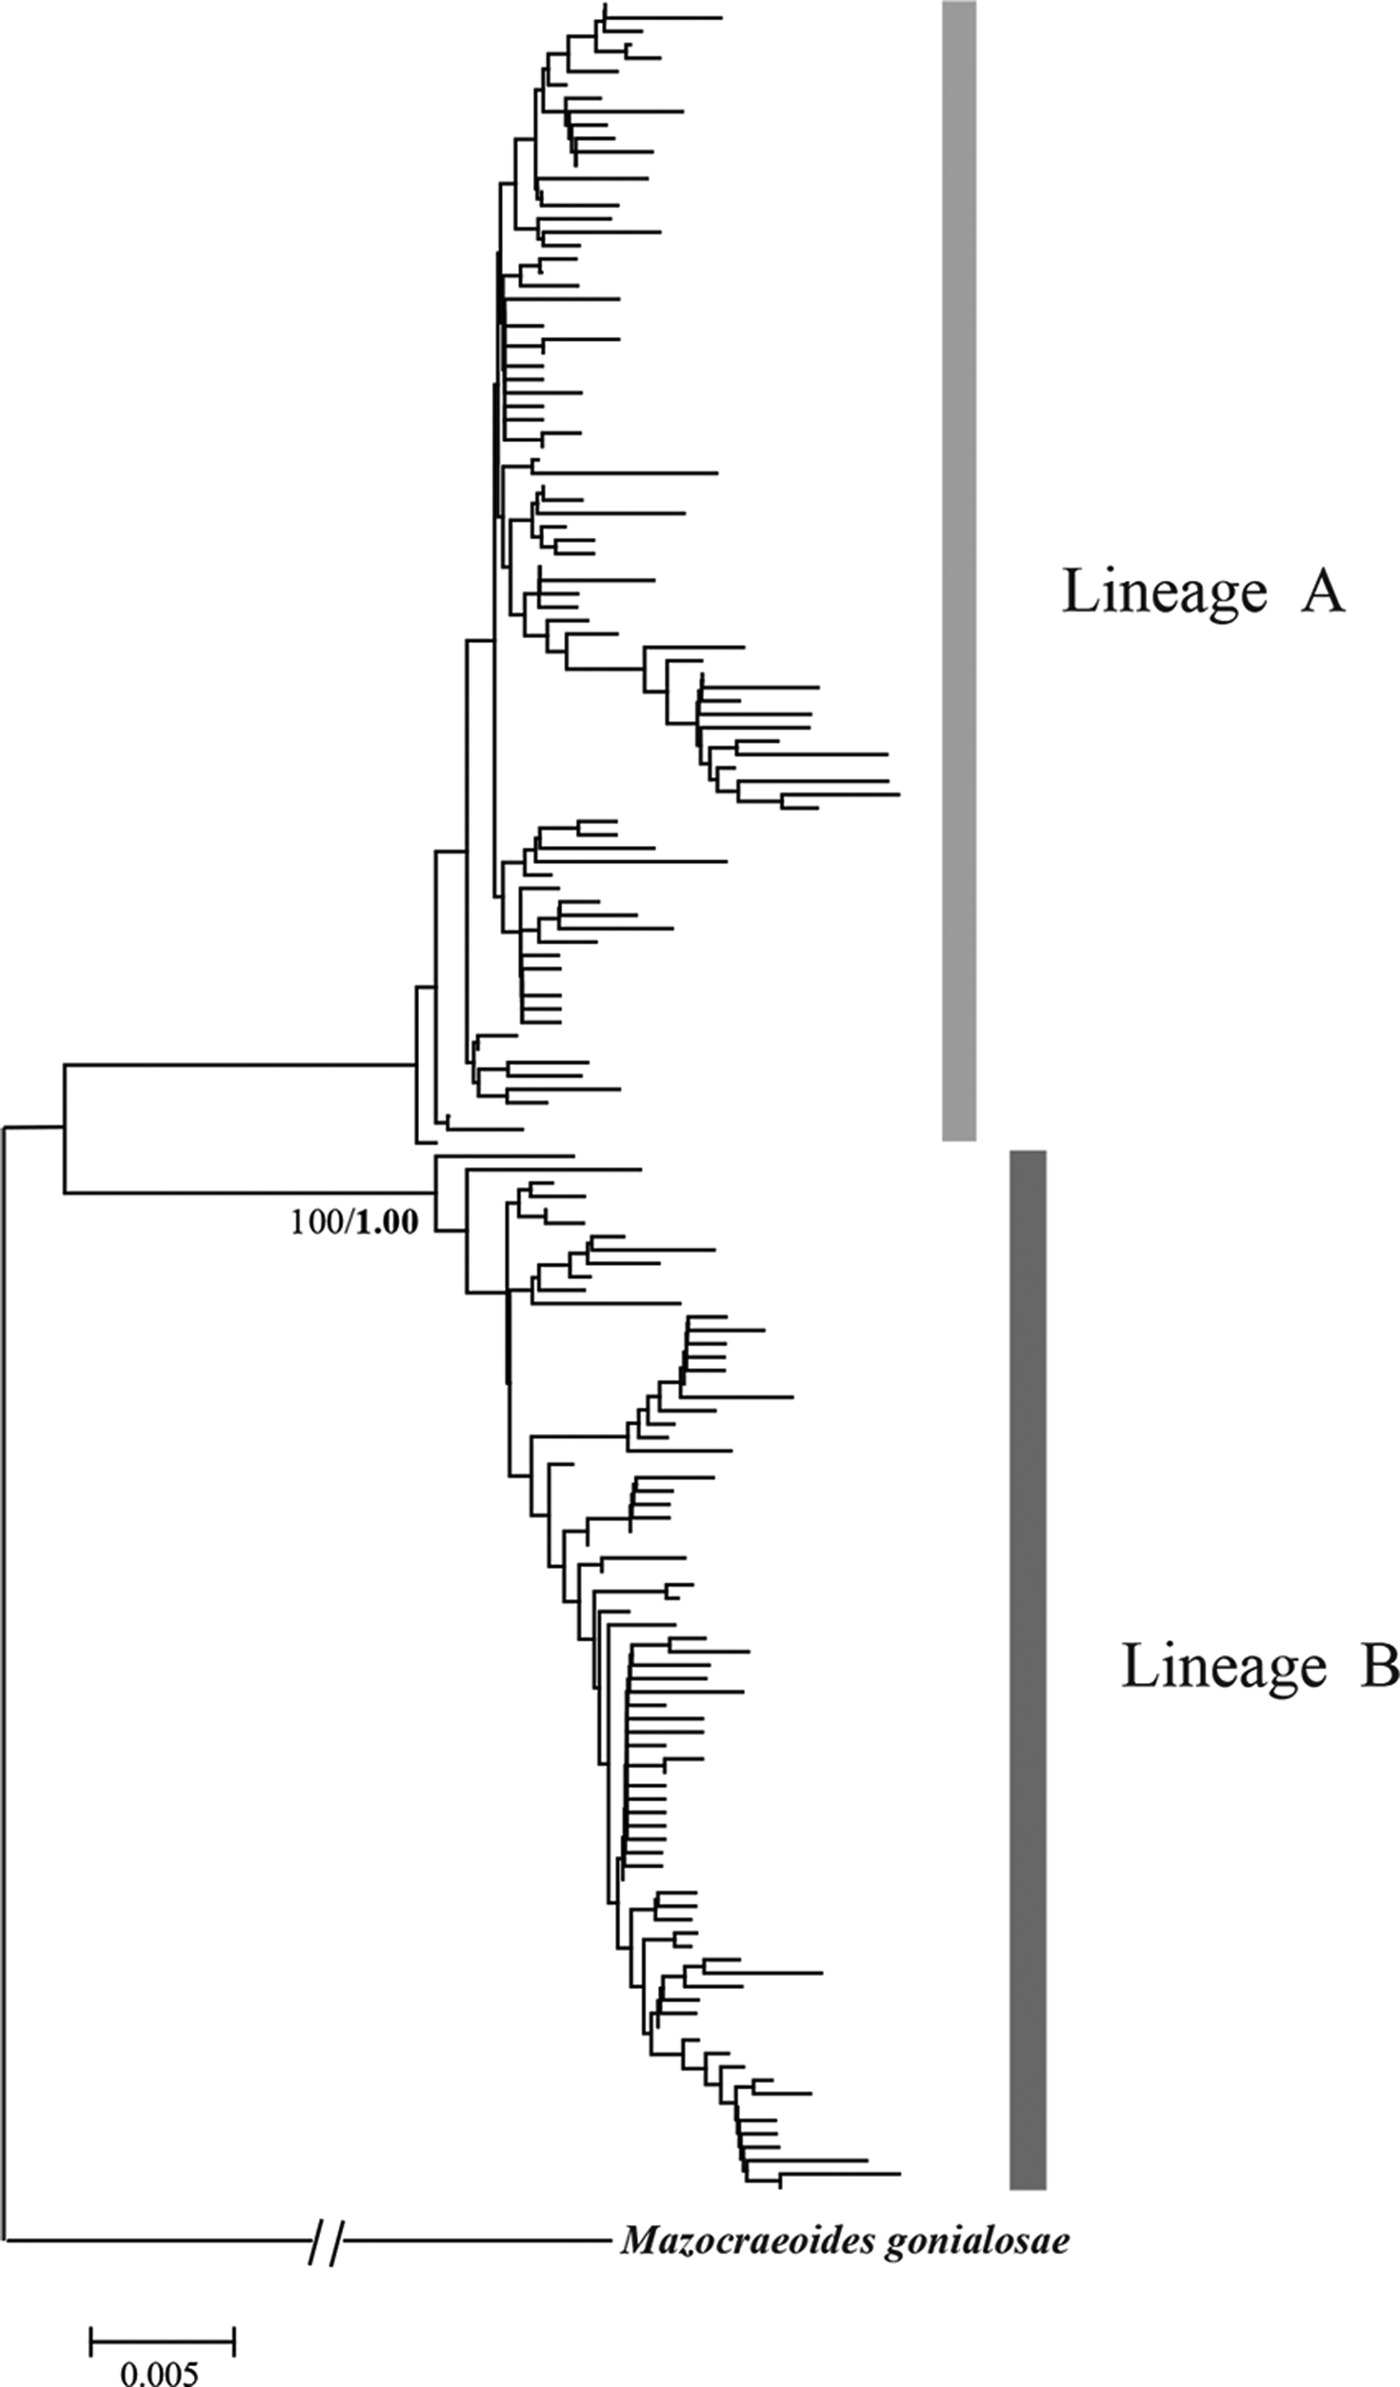
Similarly, phylogenetic analyses of K. scombri revealed two distinct lineages, which were reflected on the NJ tree, the BI tree and also the haplotype network (Figs 4 and 5). Both lineages include individuals from all sampling locations along the coast of China, i.e. they do not appear to have geographic structure. In the network analysis, each cluster exhibited a star-like pattern with large numbers of unique haplotypes surrounding some dominant haplotypes such as H13, H14 and H18, which is the signature of populations with a history of expansion (Avise, Reference Avise2004). Based on the net average genetic distance between the two lineages (3·3%), their divergence is estimated to date back to approximately 165 000 years ago (in the middle Pleistocene).
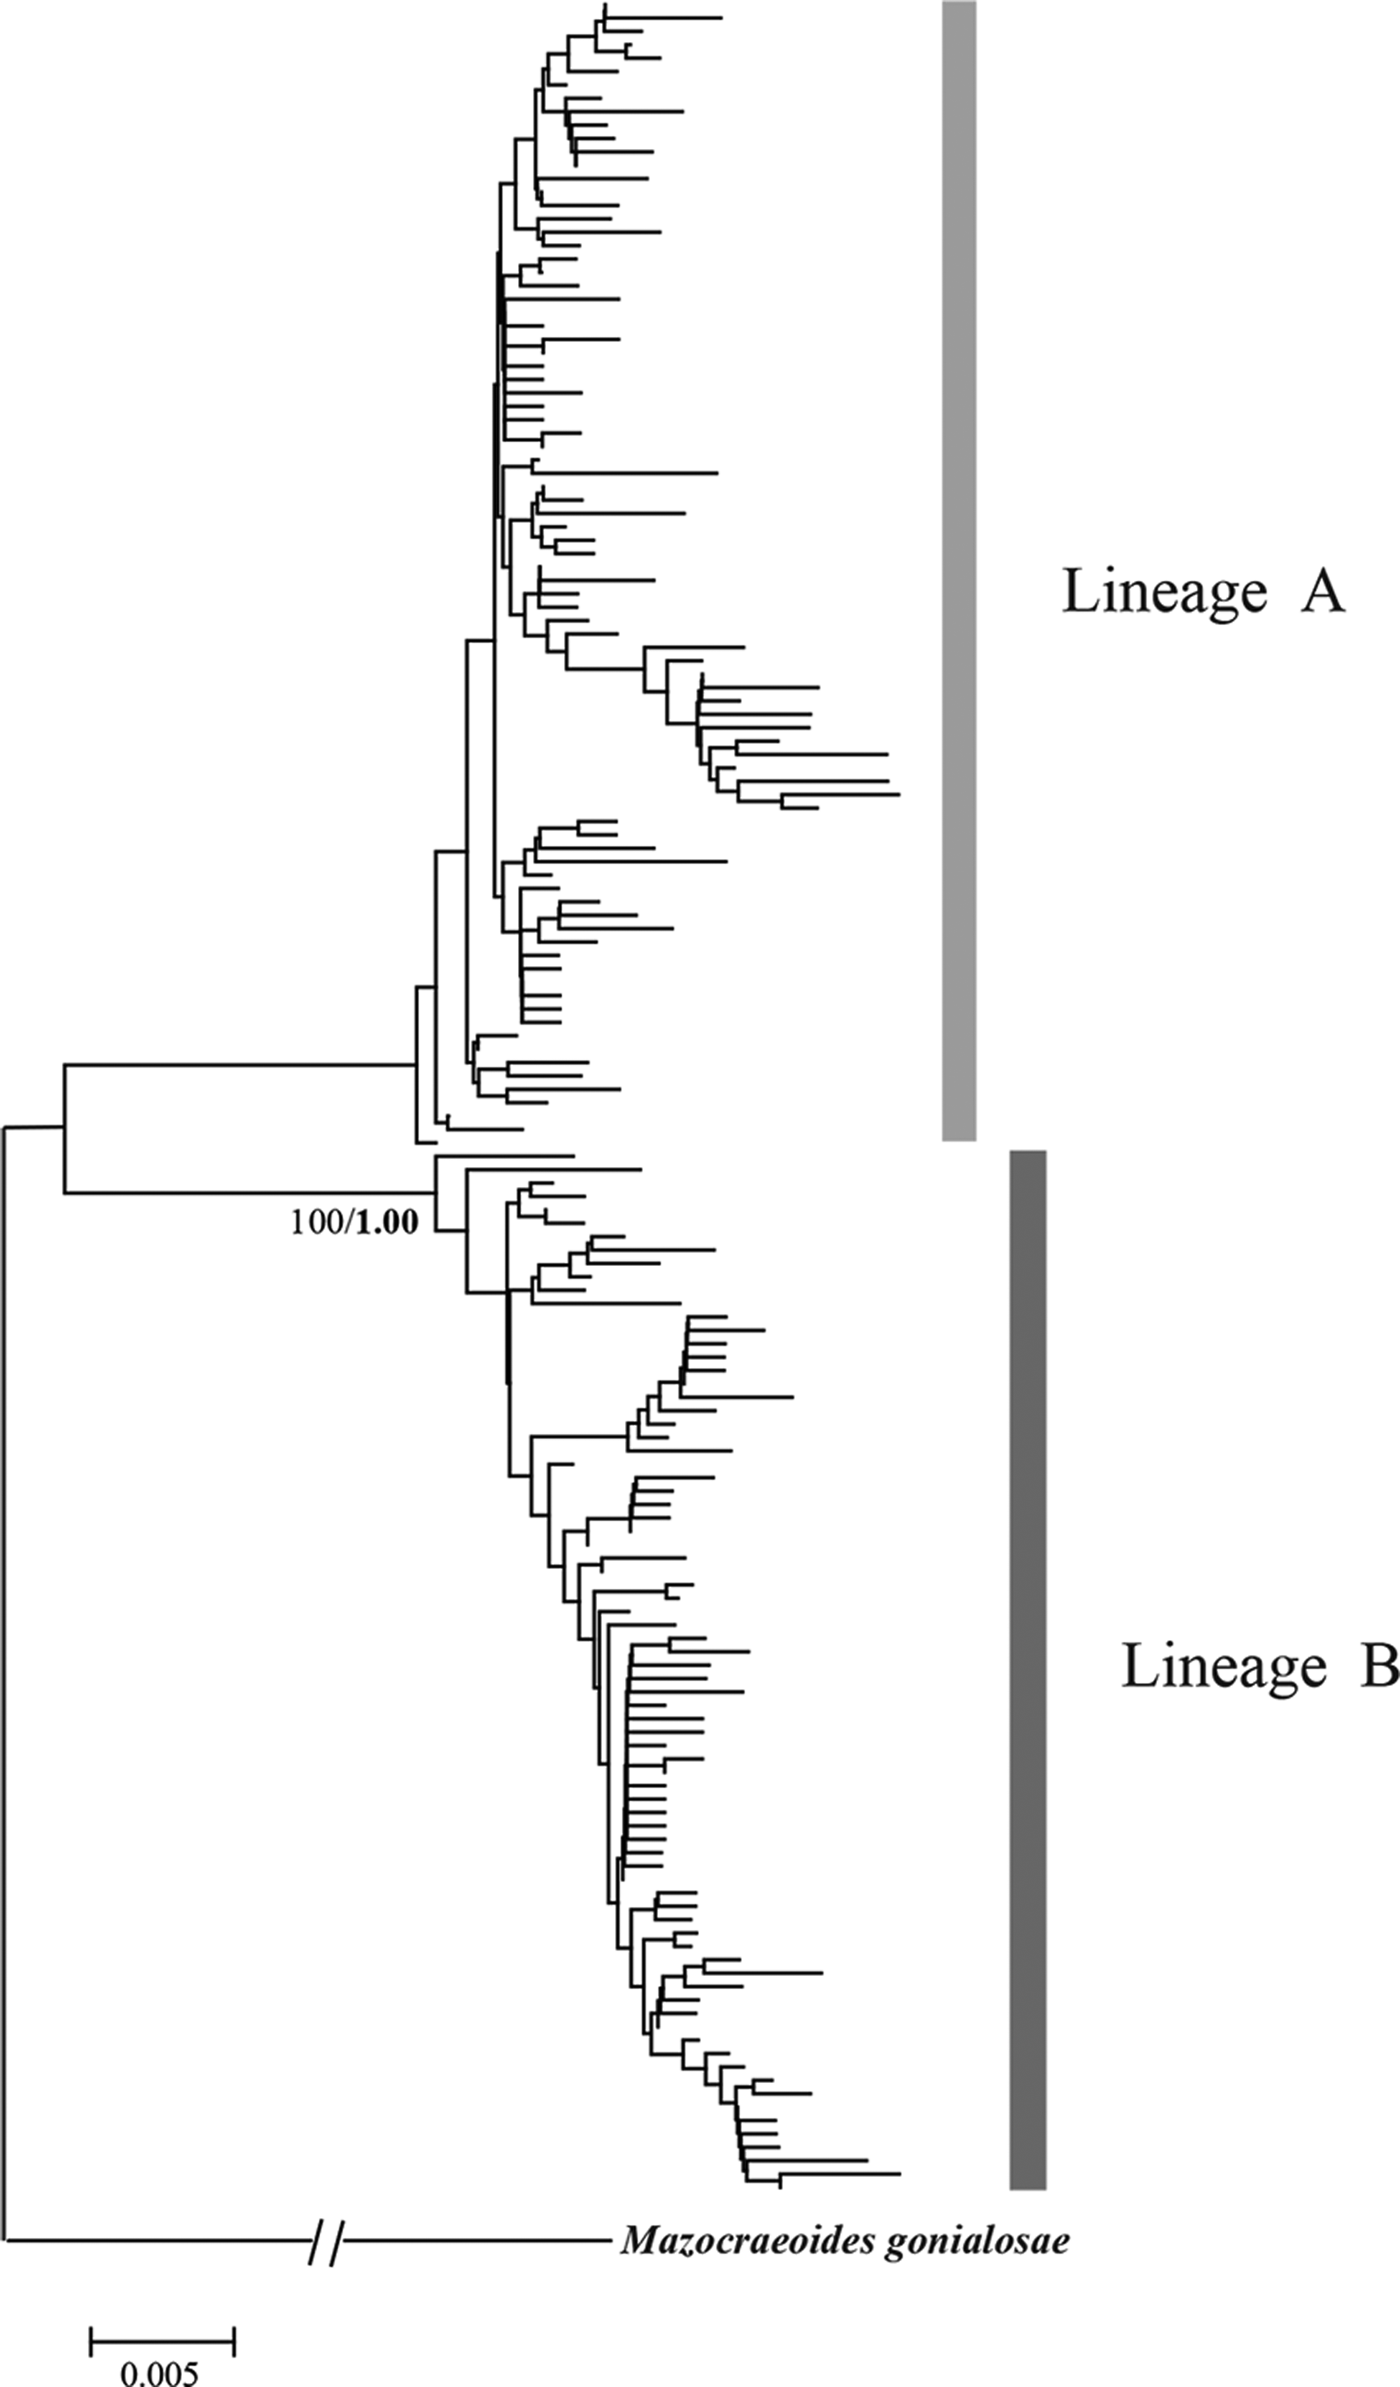
Fig. 4. NJ tree for COI haplotypes of Kuhnia scombri. Bootstrap supports of >80% are shown at nodes. Bayesian posterior probabilities (1000 replications) are provided for main clades in a bold font.

Fig. 5. MJN for COI haplotypes of Kuhnia scombri. The sizes of the circles are proportional to haplotype frequency and the colours represent the population (HLD, Huludao; DD, Dandong; QD, Qingdao; RD, Rudong; TZ, Taizhou; XM, Xiamen; HZ, Huizhou; ZJ, Zhanjiang; BH, Beihai; SY, Sanya) to which they belong; small hollow circles represent missing haplotypes.
Population structure
The pairwise F ST values (Table 3) did not significantly differ (P > 0·05) among populations of P. minor along the coast of China, which implied non-significant genetic structure existed in the range investigated. This result was further supported by hierarchical AMOVA tests which suggested that the genetic variation within populations accounted for 100·59%, while those among the three marginal seas and among populations in each of these marginal seas were all negative (Table 4). Furthermore, the exact test of population differentiation (non-differentiation exact P values) also showed non-significant differences among the 10 populations (Table 3).
Table 3. Pairwise F ST (below diagonal) and P values for exact test of population differentiation (above diagonal) among populations of Pseudokuhnia minor

HLD, Huludao; DD, Dandong; QD, Qingdao; RD, Rudong; TZ, Taizhou; XM, Xiamen; HZ, Huizhou; ZJ, Zhanjiang; BH, Beihai; SY, Sanya.
Table 4. Pairwise F ST (below diagonal) and P values for exact test of population differentiation (above diagonal) among populations of Kuhnia scombri

HLD, Huludao; DD, Dandong; QD, Qingdao; RD, Rudong; TZ, Taizhou; XM, Xiamen; HZ, Huizhou; ZJ, Zhanjiang; BH, Beihai; SY, Sanya.
* P < 0·05.
** P < 0·01.
As for K. scombri, significant F ST values were detected between SY and all other sample sites, between HZ and the other six localities, and the six comparisons within YS and ECS (Table 5), which suggests that the population of K. scombri has undergone genetic differentiation along the coast of China. AMOVA revealed significant genetic differences at two hierarchical levels: 14·78% (P = 0·00) among populations within the three marginal seas and 89·93% (P = 0·00) within populations (Table 4). The exact test of population differentiation did not detect significant differences among the 10 populations except in the comparisons of XM–RD, XM–TZ, XM–SY and SY–RD (Table 5).
Table 5. Summary of hierarchical analysis of molecular variances for Pseudokuhnia minor and Kuhnia scombri

Historical demography
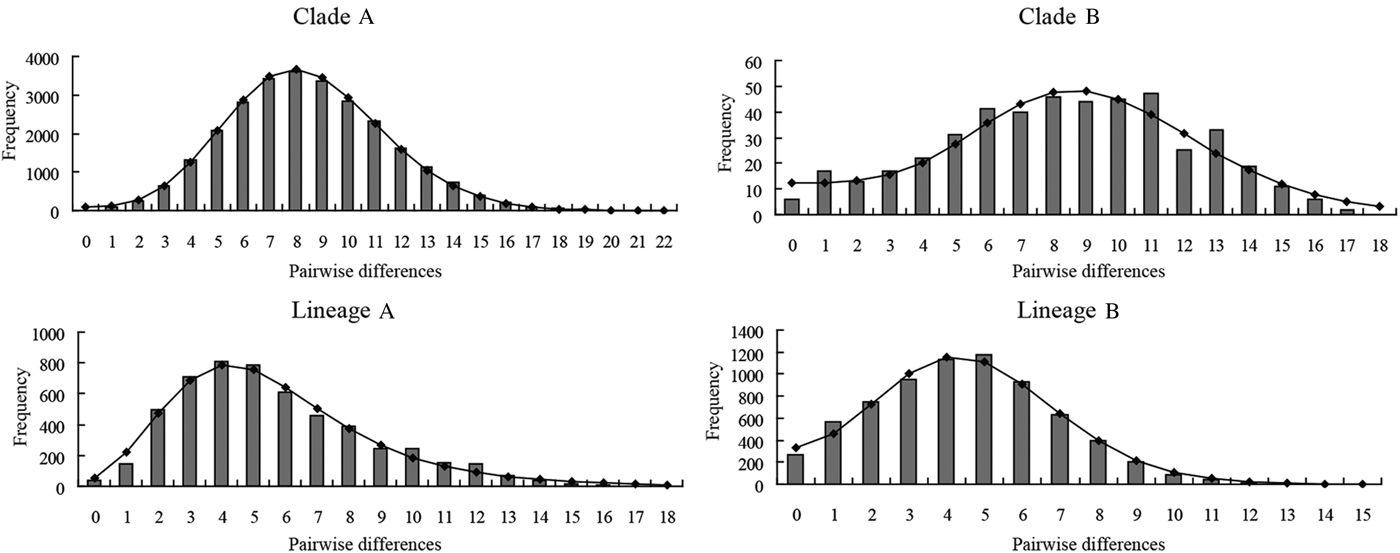
The mismatch distributions for clades A and B of P. minor were clearly unimodal (Fig. 6), closely matching the expected distributions under the sudden expansion model. Moreover, the goodness of fit test showed that no mismatch distributions for these two clades deviated significantly (P > 0·05) from predicted values under the sudden expansion model of Rogers and Harpending (Reference Rogers and Harpending1992) (Table 6). The results of the two neutrality tests are consistent with the mismatch analyses. The Fs values of the two clades were negative and highly significant (P < 0·01). Tajima's D values were negative and significant for clade A (P = 0·0001), and nearly significant for clade B (P = 0·0567) (Table 6). Collectively, this body of evidence suggests that P. minor along the coast of China experienced population expansion in the past. Based on the observed values of the age expansion parameters (τ), 8·49 for clade A and 8·31 for clade B (Table 6), and the mutation rate of 10% per million years mentioned above, it is estimated that the past population expansion started approximately 28 000 and 27 000 years ago for these two clades, respectively.
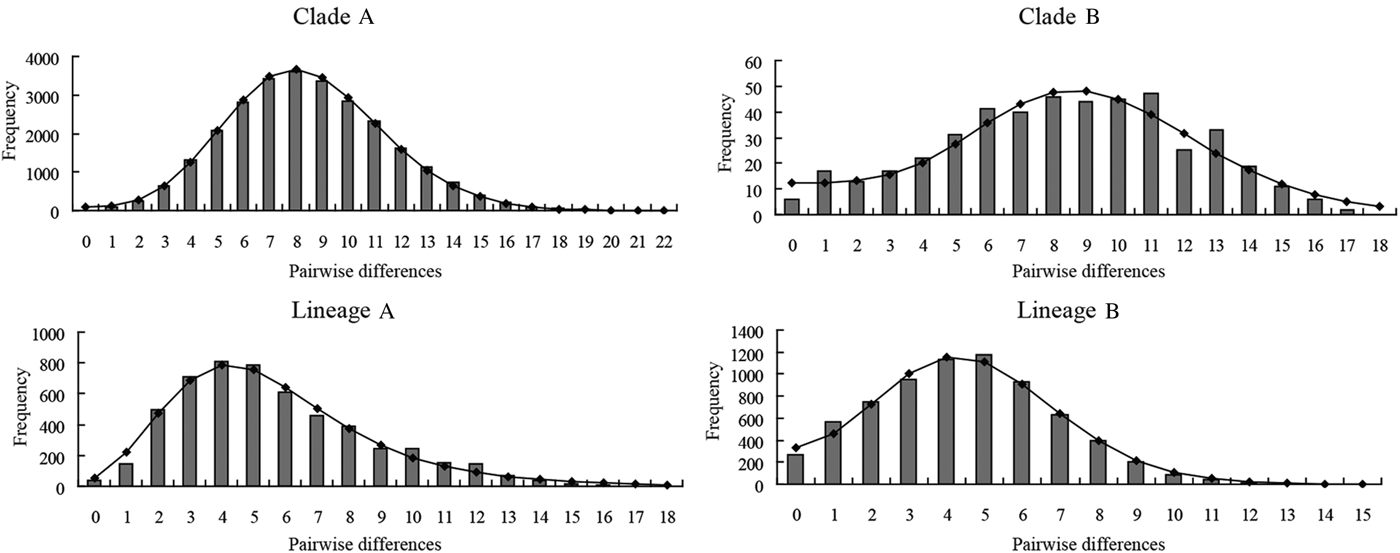
Fig. 6. Mismatch distribution of COI haplotypes for the two clades (Clades A and B) of Pseudokuhnia minor and two lineages (lineages A and B) of Kuhnia scombri. The observed pairwise differences are shown as bars and the expected values under the sudden expansion model are solid lines.
Table 6. Tajima's D, Fu's F S statistics, corresponding P values and mismatch distribution parameter estimates for each clade of Pseudokuhnia minor and Kuhnia scombri based on cytochrome c oxidase I sequence data

Both lineage A and lineage B of K. scombri showed a unimodal mismatch distribution, the model for populations having experienced sudden past expansion (Fig. 6). The P SSD and raggedness tests could not reject the expansion hypothesis. Consistently, Fu's Fs and Tajima's D tests for both lineage A and B were negative and highly significant (P < 0·01) (Table 6), also providing evidence of population expansion. Likewise, it was estimated that the population expansion of the two lineages of K. scombri occurred about 11 000 and 16 000 years ago respectively, based on the τ values of lineages A and B.
DISCUSSION
Historical demography and genetic diversity
The large glacial–interglacial cycles induced by climate oscillations in the late Quaternary period (the past one million years) are considered to have caused a series of oceanographical alterations of sea levels, current patterns and many coastal habitats (Bond et al. Reference Bond, Showers, Cheseby, Lotti, Almasi, DeMenocal, Priore, Cullen, Hajdas and Bonani1997). During the Last Glacial Maximum (LGM) of the Pleistocene Period, sea levels were estimated to be approximately 120–140 m lower than their current level (Lambeck et al. Reference Lambeck, Esat and Potter2002). In that period, the entire Bohai Gulf and the YS were exposed (Fig. 1), the ECS was reduced into an elongated trough (Wang and Sun, Reference Wang and Sun1994), and the SCS became a semi-enclosed gulf connected with the Pacific Ocean mainly through the Bashi Strait (Wang, Reference Wang1999). These changes may have contributed to the demographic decline, distribution isolation, and even extinction of many coastal marine organisms. For the two species of monogeneans, P. minor and K. scombri, on the host, S. japonicus, along the coast of China, both the mismatch distribution analysis and the neutrality tests suggested a history that included population expansion. This conclusion was also supported by the P SSD and raggedness tests, and the star-like median networks that they revealed. In spite of different estimations of expansion time for species P. minor and K. scombri (28 000–27 000 and 16 000–11 000 years ago, respectively), both fell in the late Pleistocene era (126 000–10 000 years ago). These two host-specific parasites, P. minor and K. scombri, might have also suffered population decline and isolation due to the decline of their host population during the LGM. Afterwards, with the glacial retreat and the sea level rise, the populations of these two species of monogeneans increased in both quantity and distribution with the dispersal of their hosts from different refuges. Previous studies on the phylogeography of monogeneans, M. gonialosae and Gotocotyla sawara along the coast of China also suggested the existence of historic population expansion in the Pleistocene era (Li et al. Reference Li, Shi, Brown and Yang2011; Shi et al. Reference Shi, Li, Yan, Wang, Yang, Lun, Brown and Yang2014).
Both P. minor and K. scombri showed high haplotype diversities and low levels of nucleotide diversity, indicating the existence of population expansion in the history, possibly caused by bottle-neck or founder events (Grant and Bowen, Reference Grant and Bowen1998). In general, haplotype diversity close to 1 is no longer considered to be an informative measure of polymorphism, and is not useful in the discrimination of different populations (Li, Reference Li1997). On account of high haplotype diversities of both species (close to 1), nucleotide diversity was used to compare their genetic diversities. The much lower nucleotide diversity of P. minor population than that of K. scombri could be attributed to either a lower rate of evolution or younger age of P. minor, both of which would result in the accumulation of less diversity (Glennon et al. Reference Glennon, Perkins, Chisholm and Whittington2008).
Phylogeographic congruence
For both species of parasites, phylogenetic analyses constructed a tree composed of two clades of no geographic association along the coast of China, which is characteristic of reblending populations following previous isolation. The divergence of the two clades of both P. minor and K. scombri occurred during the Pleistocene era. As mentioned above, the populations of both species might have been isolated in different glacial refuges with the decline of sea level during the glacial period, with a subsequent remixing with the rise of sea level during the postglacial period. Similarly, the population of the host of these two parasites, S. japonicus in the coast of China, was also deduced to have experienced population isolation and remixing during the Pleistocene era based on the topological structure of two lineages on the NJ tree (Yan et al. Reference Yan, Catanese, Brown, Wang, Yang and Yang2015). This coherence between host and parasites revealed in our study agrees with the statement that parasites with a high degree of host specificity are expected to have consistent genealogy with their host (Beebee and Rowe, Reference Beebee and Rowe2008). It is therefore infer that the phylogeographic patterns of monogeneans are highly influenced by their respective hosts.
Comparative genetic structure
Marine organisms generally show low levels of genetic differentiation and high levels of gene flow across wide geographic regions due to the high dispersal potential of planktonic eggs, larvae and adults, and the absence of physical barriers between ocean basins or adjacent continental margins (Hewitt, Reference Hewitt2000). In the present study, P. minor conforms to this pattern, suggesting that this population is in a state of a panmixia, with a high rate of gene exchange among different local populations along the coast of China. For parasitic organisms, population genetic structure is determined not only by the dispersal abilities of parasites themselves, but is also profoundly influenced by the biological characteristics of their hosts (Miura et al. Reference Miura, Torchin, Kuris, Hechinger and Chiba2006). As for the host in the present study, chub mackerel (S. japonicus) is a pelagic, migratory and large-shoal-forming species (Lockwood, Reference Lockwood1988), which is widespread in the warm and temperate transition coastal areas and the adjacent seas of the Atlantic, Pacific and northwest Indian oceans (Collette and Nauen, Reference Collette and Nauen1983). Since monogenean parasites cannot parasitize the pelagic eggs and larvae of fish (Cribb et al. Reference Cribb, Pichelin, Dufour, Bray, Chauvet, Faliex, Galzin, Lo, Lo-Yat, Morand, Rigby and Sasal2000), their primary dispersal mechanism is by way of adult fish. Thus, the seasonal long distance migration of adult S. japonicus might also facilitate the gene flow of its parasites. The passive drift of eggs and larvae of parasites with sea currents may also promote the mixing of parasites among the YS, ECS and SCS although the monogenean larvae, oncomiracidia, can normally swim and survive for a very limited time before they attach to a suitable host (Gannicott and Tinsley, Reference Gannicott and Tinsley1998). In addition, historical geological processes have had profound impacts on the population structure of marine organisms (Glennon et al. Reference Glennon, Perkins, Chisholm and Whittington2008). The insufficient time to attain migration-drift equilibrium after a recent range expansion might be associated with the high genetic similarity within the region studied (Slatkin, Reference Slatkin1993). Similar explanations have also been proposed in the studies of monogeneans, M. gonialosae and G. sawara along the coast of China (Li et al. Reference Li, Shi, Brown and Yang2011; Shi et al. Reference Shi, Li, Yan, Wang, Yang, Lun, Brown and Yang2014).
Different from P. minor, K. scombri on the same host and sampled in the same locations as P. minor showed genetic differentiation, which was supported by both the AMOVA test and analyses of pairwise F ST values. Sympatric marine organisms with different population genetic structures were also revealed in fishes S. scombrus and S. japonicus in the Mediterranean Sea (Zardoya et al. Reference Zardoya, Castilho, Grande, Favre-Krey, Caetano, Marcato, Krey and Patarnello2004), Lateolabrax japonicus and Lateolabrax maculatus in the Northwestern Pacific Ocean (Liu et al. Reference Liu, Gao, Yokogawa and Zhang2006), and in monogeneans Haliotrema aurigae and Euryhaliotrematoides grandis in the South Pacific Ocean (Plaisance et al. Reference Plaisance, Rousset, Morand and Littlewood2007). Observed differences were ascribed to their specific evolutionary and biological features, such as life histories and dispersal strategies (Plaisance et al. Reference Plaisance, Rousset, Morand and Littlewood2007). In this study, the speculation that P. minor has lower evolution rate or that K. scombri being an older species could help to account for their different population genetic structures. Although the biology of K. scombri has not yet been studied due to the difficulties in culturing captive hosts, a more abundant population of P. minor than that of K. scombri (unpublished data) was observed, which may imply that the population of the former has had fewer opportunities to accumulate genetic structure locally. In addition, genetic divergence and even speciation could be resulted from host switches in the evolutionary history of parasites. There exists an alternative host of these two monogeneans, Scomber australasicus, along the coast of China. However, the distributional overlap of these two species of hosts would have largely abated the role of host switch to the genetic structure of these two parasites.
We acknowledge that the main conclusions of the present study rely on information from a single mitochondrial gene. Further studies on the biology of these two monogeneans and population genetic structure in a larger geographical range with more mitochondrial and/or nuclear markers are needed for an improved understanding of the geographical pattern of these parasites.
ACKNOWLEDGEMENTS
We would like to thank Shi Sufen, Lu Limin and Zhang Shuai for their help in sample collection, and He Zhangping for his assistance during the experiment.
FINANCIAL SUPPORT
This work was supported financially by the National Natural Science Foundation of China for the research project about the phylogeography of marine monogeneans and the coevolution with their hosts (No. 31072215). All authors except for C.L. Brown benefitted from this support.


