


Most political scientists are concerned about the quality of the measures they use, yet few scholars rigorously evaluate a chosen measure’s quality prior to incorporating it in substantive research (Herrera and Kapur Reference Herrera and Kapur2007). This tendency stems not from a lack of tools: the social sciences are replete with methods for evaluating measure validity and reliability (see, e.g., Shadish, Cook, and Campbell, Reference Shadish, Cook and Campbell2002 or Seawright and Collier, Reference Seawright and Collier2014). The challenge is twofold. First, there is no accepted, comprehensive, practical approach for assessing a measure’s quality. Second, there is no broadly adopted strategy for scholars to incorporate information from such assessments in substantive research or to amend their research designs accordingly.
We argue that it is critical to assess the quality of measures in advance of using them, both to diagnose a chosen measure’s strengths and limitations and to implement strategies to mitigate quality concerns. Forty years ago, Zeller and Carmines (Reference Zeller and Carmines1980) elucidated a strategy for measurement in the social sciences that prioritized evaluating measure validity and reliability in terms of theoretical construct validity and patterns of internal and external association between indicators. They argued that “…the auxiliary theory specifying the relationship between concepts and indicators is equally important to social research as the substantive theory linking concepts to one another (Carmines and Zeller Reference Carmines and Zeller1979, p. 11).” This article builds on this tradition, but emphasizes the need for these two types of theories—measurement and substantive models—to speak to one another, and for analysts to rigorously apply both sorts of models in tandem to inform the substantive conclusions that they draw from research using measures of social concepts.
The data quality assessmentFootnote 1 literature is extensive,Footnote 2 but it lacks practical applicability in several key ways. First, as we elaborate in more detail below, many works provide guidance for developing a measure, rather than guidance for assessing and effectively using a measure someone else developed. In other words, the literature is primarily geared toward data producers, even though many researchers are primarily data consumers.Footnote 3 Second, much of the literature implicitly or explicitly employs satisfying standards, asking: What does a researcher have to do to show a measure is “valid enough” or “reliable enough?” This all-or-nothing approach is more useful to producers than to consumers, who often must rely on existing imperfect measures to answer their substantive questions. Third, works typically focus on one assessment tool (or a select few), rather than synthesizing the tools to provide a comprehensive and easily implemented assessment process. Fourth, many prior works on data quality assessment also have a narrow focus on validity, overlooking or giving little attention to reliability. Finally, few researchers take what they learn in assessing a measure and incorporate it when conducting analysis associated with substantive research. Instead, the assessment serves only to “rubber stamp” the measure.
To address these five gaps in existing literature, this paper synthesizes a set of complementary, flexible, practical, and methodologically diverse techniques for assessing data quality.Footnote 4 Rather than recommending the use of one technique over another, we advocate a comprehensive approach to assessment. In our proposed approach, we first assess content validity, which we define as the alignment between the higher-level theoretical concept under study, the measure being assessed that is designed to capture that concept, and any alternative available measures. Second, we assess the validity and reliability of the data generation process, including evaluating the bias and error introduced in the dataset management structure, data sources, respondent coding procedures, aggregation models, and case coverage, as well as analyzing the predictors of inter-respondent disagreement and intra-respondent biases.Footnote 5 Third, we assess convergent validity, or the alignment between the measure being considered, alternative available measures, and qualitative case studies. Throughout the assessment, we employ a variety of qualitative and quantitative tools.
While much of what we recommend synthesizes existing tools, we also innovate in developing three new assessment strategies. First, we delineate a road map for evaluating the validity and reliability of the data generation process as a signal of resulting data quality. Second, we analyze how respondent and case characteristics affect inter-respondentFootnote 6 disagreement and intra-respondent biases. Third, we build on existing convergent validity assessments to combine regression analysis and qualitative “blind” case studies to identify the determinants of measure divergence and the set of affected cases. Throughout the article, we highlight how researchers can use these assessment tools to evaluate how appropriate a measure is for a particular research question or a particular set of cases, to identify potential limitations in substantive conclusion, and to adapt substantive conclusions to measurement concerns.
We demonstrate our proposed quality assessment approach by applying it to the Varieties of Democracy Project (V-Dem) corruption measures. Corruption is a particularly difficult concept to measure, so assessing the quality of corruption measures is critical. In line with one of the gaps in existing literature highlighted above, we focus our assessment on points useful for consumers of the V-Dem corruption measures, not for the V-Dem producers: we assume attributes of the V-Dem enterprise such as managerial structure, respondent recruitment, and aggregation procedures are fixed, and we simply assess these attributes to understand their implications for those using the V-Dem corruption measures in substantive research. To address another of the gaps highlighted above, our assessment of the V-Dem corruption measures is comparative. As corruption is challenging to measure, we assume no corruption measure is of perfect quality. We aim to unearth areas of relative strength and weakness to, in turn, determine the set of research questions, cases, and areas of corruption that best align with the measures’ strengths.
Our assessment reveals both strengths and limitations of the V-Dem corruption measures. The V-Dem corruption measures are relatively high-quality in capturing exchange-based material corruption among government officials, corruption in non-Western countries, corruption in contexts with relatively high levels of corruption and more expansive freedom of expression, and historical corruption (i.e., in years prior to the starting year for other corruption measures). In cases where V-Dem employed a greater proportion of women respondents, or respondents with doctoral degrees, the V-Dem corruption measures diverge from other corruption measures. We encourage considering these areas of relative strength (and corresponding areas of weakness) when evaluating whether the V-Dem corruption measures can be employed to answer a particular research question for a given set of cases in substantive research. Further, we propose the data quality assessment approach we present can be applied to evaluate the quality of existing measures more generally.
1 A Departure from and a Refinement of Previous Work
Some of the most valuable work on data quality assessment, including Adcock and Collier (Reference Adcock and Collier2001); Seawright and Collier (Reference Seawright and Collier2014); Hayes and Krippendorff (Reference Hayes and Krippendorff2007), and Zeller and Carmines (Reference Zeller and Carmines1980), provides advice, primarily or exclusively, for data producers—those who develop datasets. They refer to their readers as individuals producing data (e.g., “help scholars develop measures”; Adcock and Collier Reference Adcock and Collier2001, p. 534). Yet, with a proliferation of publicly available cross-national datasets and global indices, social scientists are in dire need of advice for data consumers—those who use these publicly available datasets produced by others in substantive research. Consumers must conduct active quality assessments of the measures that they use precisely because no producer can adequately anticipate a wide array of consumer needs. Our guide focuses on that task.
The literature also generally overlooks practical, step-by-step guidance. Some of the most informative works, such as Seawright and Collier (Reference Seawright and Collier2014), make us attentive to data quality assessment debates, inform us of different tools, and illustrate them. However, they are not practical data quality assessment road maps, but rather a theoretical presentation of assessment concepts. The classic work of Carmines and Zeller (Reference Carmines and Zeller1979) and Zeller and Carmines (Reference Zeller and Carmines1980) serves as a model for our approach here. We update and extend this body of work to synthesize tools—several provided by other scholars as well as several we develop—into a practical assessment process, apply the process to a particular case, and demonstrate how this holistic approach reveals insights useful in conducting substantive research with a chosen measure.
Further, offering a comprehensive approach is a helpful complement to publications that examine only a single tool (see, e.g., Bollen Reference Bollen1980; Campbell and Fiske Reference Campbell and Fiske1959; Thomas Reference Thomas2010, and Sartori (Reference Sartori1970)). Our approach underscores the value of combining different data quality assessment tools, including harnessing the advantages of both qualitative and quantitative approaches. We do not claim that our catalog of tools is exhaustive, but rather that it can serve as a relatively flexible foundation for assessing the quality of a measure.
In addition, many prior works on data quality assessment provide narrower guidance because they focus exclusively on validity, generally defined as the alignment between a measure and the underlying concept. For example, some of the most oft-cited articles on measurement in political science do not even mention reliability (Adcock and Collier Reference Adcock and Collier2001; Collier, LaPorte, and Seawright Reference Collier, LaPorte and Seawright2012; Seawright and Collier Reference Seawright and Collier2014). Similarly, in Chapter 7 of his canonical book, Social Science Methodology, John Gerring acknowledges that validity and reliability are the “two overall goals” in “pursuing the task of measurement,” but subsequently only discusses how to assess reliability for half of a page, concluding that inter-respondent reliability tests should be performed whenever multiple respondents are used to generate each data point (Gerring Reference Gerring2012, p. 158–159). Reliability is, of course, central to data quality assessment, as a large literature emphasizes (Reise, Widaman, and Pugh Reference Reise, Widaman and Pugh1993; Hayes and Krippendorff Reference Hayes and Krippendorff2007). The approach we lay out in this article illustrates how jointly assessing validity and reliability (referred to collectively as “quality”) leads to concrete findings that can be incorporated in substantive research. Here, we push readers to return to the balanced assessment of validity and reliability emphasized by Zeller and Carmines (Reference Zeller and Carmines1980).
Finally, even the most insightful works on measurement do not take the critical post-assessment step of discussing how the assessment’s findings can be incorporated into substantive research. Measures are typically torn down without advice about how to use imperfect measures: much of the literature implies that a less-than-perfect measure is not worth using (Mudde and Schedler Reference Mudde and Schedler2010). There is very little attention to mitigating, or at least acknowledging, limitations.Footnote 7 In many ways our work is in the spirit of, and an update to, the 40-year-old book by Zeller and Carmines (Reference Zeller and Carmines1980), yet even that classic does not illustrate how the assessment’s findings can affect substantive research. Likewise, Herrera and Kapur (Reference Herrera and Kapur2007) approach data collection “as an operation performed by data actors in a supply chain,” delineating these actors, their incentives, and their capabilities (p. 366). They urge scholars to focus on validity, coverage, and accuracy, offering several examples of measures that have failed on these dimensions. They stop short, however, of explaining the implications of measures’ strengths and limitations for substantive research. We provide suggestions on how to do so.
In addition to the data quality assessment literature, our work is also informed by the large literature on the quality of democracy measures, particularly its emphases on aligning measures with higher-level conceptualization; considering differences in coverage, sources, and scales across measures; and transparency in coding and aggregation procedures (Bollen Reference Bollen1980; Bollen Reference Bollen1990; Munck and Verkuilen Reference Munck and Verkuilen2002; Bowman, Lehoucq, and Mahoney Reference Bowman, Lehoucq and Mahoney2005; Pemstein, Meserve, and Melton Reference Pemstein, Meserve and Melton2010; Coppedge et al. Reference Coppedge2011; Fariss Reference Fariss2014). To develop tools for assessing both the data generation process and convergent validity, we draw heavily on the work of Steenbergen and Marks (Reference Steenbergen and Marks2007), Dahlström, Lapuente, and Teorell (Reference Dahlström, Lapuente, Teorell, Holmberg and Rothstein2012), and Martinez i Coma and van (Reference Martinez i Coma and van Ham2015), who represent literature on party positions, public administration, and election integrity, respectively. Finally, we extensively borrow insights from the literature on corruption measurement, both because we apply our approach to the V-Dem corruption measures and because the literature on measuring corruption raises general issues about data quality assessment more generally (Knack Reference Knack2007; Treisman Reference Treisman2007; Hawken and Munck Reference Hawken, Munck, Rajivan and Gampat2009b,Hawken and Munck Reference Hawken and Munck2009a; Galtung Reference Galtung, Galtung and Sampford2006).
2 A Practical Approach to Assessing Data Quality
We propose a practical approach for assessing a measure’s quality that involves three components: a content validity assessment; a data generation process assessment; and a convergent validity assessment (see Table 1). Collectively, these considerations illuminate the degree to which the measure is valid and reliable.Footnote 8 Validity is the absence of systematic measurement error. Reliability is the absence of unsystematic (or random) measurement error.Footnote 9 Reliability should not be overlooked when assessing the quality of a measure; while it is not useful on its own, neither is a well-conceptualized but unreliable measure.
Table 1 Data quality assessment approach.
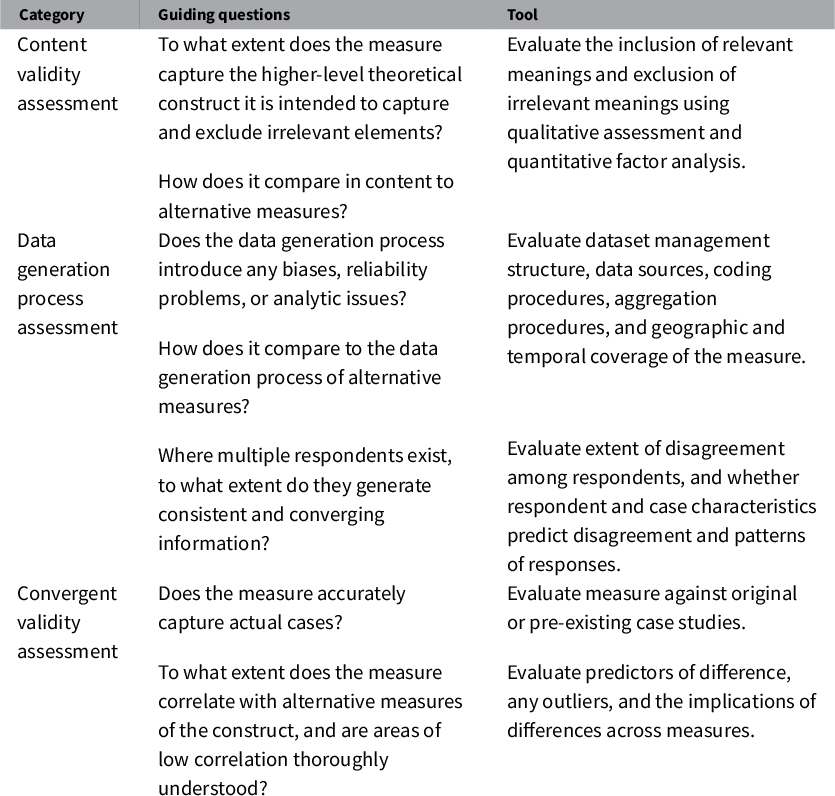
First, one should examine the extent to which the measure captures the higher level theoretical concept. Content validity assessment, where the analyst maps indicators to theoretical concepts (Carmines and Zeller Reference Carmines and Zeller1979; Zeller and Carmines Reference Zeller and Carmines1980; Bollen Reference Bollen1989; Adcock and Collier Reference Adcock and Collier2001; Seawright and Collier Reference Seawright and Collier2014) is the primary way to approach this question.Footnote 10 In addition to assessing the measure against a theoretical construct, we suggest assessing the content validity of the measure relative to other available measures of that construct. It is important to note that a measure’s content validity is specific to a particular theoretical concept, so research projects that use different theoretical concepts will likely find different measures are strongest in terms of content validity.
Second, it is important to assess the validity and reliability of the data generation process. An unbiased and reliable data generation process results in unbiased and reliable measures. The appeal of including this component in a data quality assessment approach is that it compels a focus on something that can be evaluated (i.e., the nature of a process) rather than something that cannot (i.e., a measure’s alignment with the truth). For example, though we cannot prove that a respondent selected the “true” answer when answering a question about Argentina’s level of civil society freedoms in 1950, we can show that the process to recruit, engage, and synthesize data from that respondent was unbiased and reliable. In evaluating the data generation process, we recommend scrutinizing the dataset management structure, data sources, respondent coding procedures, aggregation models, and case coverage. Where multiple respondents are used, we encourage analyzing the predictors of inter-respondent disagreement and intra-respondent biases to evaluate the reliability of the data generation process and to expose potential determinants of systematic bias. In particular, considering the individual respondent and case characteristics that predict disagreement or response patterns allows researchers to identify threats to validity and reliability that are driven by the composition of respondent pools. As in the first component of our data quality assessment approach, researchers should consider their particular theory as they evaluate the data generation process of a measure, and should assess a measure’s strengths and limitations relative to other measures.
The third component in our approach is to assess convergent validity, or the alignment between the measure being considered, alternative available measures, and qualitative case studies.Footnote 11 We use two tools in our convergent validity assessment: comparing the measure to alternative comparable measures; and comparing the measure to actual cases. With regard to the former, it is important to acknowledge that the quality of other measures might not be certain. So, the task at hand is to evaluate the strength of correlations and any outliers in order to more completely understand the advantages and disadvantages of the measure of interest. A useful approach is to analyze the predictors of differences across measures, rather than only the aggregate correlation level. One can use original or pre-existing case studies for qualitative comparisons, to assess whether the measure “converges” with case history. However, it is critical that the researcher considering the case material is “blind” to the measures; she must effectively recode the cases independently, using only the case material. She can examine the alignment between the coded cases and the measure after completing this blind recoding.
3 V-Dem Corruption Measures
The V-Dem datasetFootnote 12 covers nearly all countries of the world from 1900 to 2012.Footnote 13 V-Dem provides six indicators of corruption based on six survey questions: two each for the executive and public sector on: (a) bribery and other corrupt exchanges and (b) theft and embezzlement. Then, there is a single indicator for corruption in the legislature and another for corruption in the judiciary. The exact language of each question appears in Table S1 of the Supplementary Appendix. The V-Dem Corruption Index aggregates these six indicators to produce an overall measure of corruption.Footnote 14
4 Applying the Data Quality Assessment Approach
To demonstrate our proposed assessment approach, we apply it to the V-Dem corruption measures. Our approach to data quality assessment involves both stand-alone and comparative evaluations. Therefore, throughout the paper, we provide head-to-head tests with alternative corruption measures that make the required information available (e.g., details about the data generation process). The two alternative corruption measures we consider most often are the Worldwide Governance Indicators’ Control of Corruption (WGI) and Transparency International’s Corruption Perceptions Index (CPI). For readers who are not familiar with alternative corruption measures, we provide Table 2 in the Appendix as a reference.
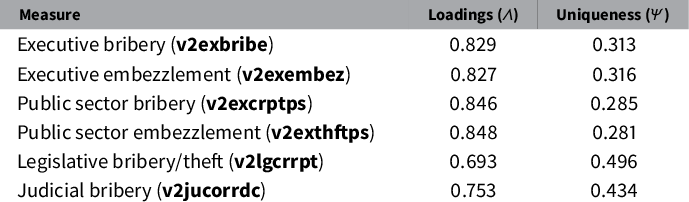
Table 2 Conceptual alignment across V-Dem corruption indicators (BFA Estimates).
4.1 Content Validity Assessment
As a first component in our data quality assessment approach, we propose evaluating the alignment between the higher-level theoretical concept under study and the measure being assessed that is designed to capture that concept—in other words, to determine the extent to which the measure captures all relevant meanings while excluding ones irrelevant to the “systematized” concept (Adcock and Collier Reference Adcock and Collier2001). We propose making this determination by using qualitative evaluations and quantitative factor analysis. In line with Seawright and Collier (Reference Seawright and Collier2014), the qualitative evaluations involve assessing the level of correspondence between the data that the measure will generate and the systematized concept.Footnote 15 Factor analysis is a statistical tool that examines how closely different indicators relate to the same underlying concept.Footnote 16 It is often used as a test of convergent validity; we propose that it also helps illuminate whether a set of measures forming an index represent relevant meanings and exclude irrelevant meanings.
Our theoretical construct of interest in assessing the V-Dem Corruption Index is the “use of public office for private gain,” a widely accepted academic definition of corruption (Rose-Ackerman Reference Rose-Ackerman1999; Treisman Reference Treisman2000). We find that the V-Dem Corruption Index includes most, but not all, relevant meanings, and excludes irrelevant meanings. The V-Dem Corruption Index captures a wide variety of participants in corruption, including both top officials and public sector employees. It also captures a large number of corrupt practices, including both grand and petty corruption. Each of the six V-Dem corruption measures refers to a particular public officeholder. And, they use specific language to indicate numerous, particular corrupt practices, such as “bribes” and “steal, embezzle, or misappropriate public funds or other state resources for personal or family use,” as well as more general language to include other forms of corrupt behavior. This language enables the survey questions to generate measures that cover a wide range of behaviors that fall under “the use of public office for private gain.” However, the V-Dem corruption indicators are weaker in capturing “revolving door” corruption, where public sector positions are used to secure private sector jobs and vice versa, as this form of corruption is included only in the question about legislator corruption, not in the questions about other government officials (i.e., the executive, bureaucracy, or judiciary).
The V-Dem measures also exclude meanings of corruption that are irrelevant to the systematized concept. By specifying government officeholders in the questions, the measures exclude cases where the corruption involves only those outside government. By specifying types of personal gain in the questions, the measures also exclude behaviors where there is no evidence of direct, immediate material gain. For example, vote buying is not captured in any of the V-Dem corruption measures.
Next, we use Bayesian factor analysisFootnote 17 to assess content validity—specifically whether the six V-Dem corruption measures reflect one underlying systematized concept (i.e., corruption). As shown in Table 2, all six indicators strongly load on a single dimension, although the fit for both legislative and judicial corruption is somewhat weaker. Despite the strong factor loadings produced by this exploratory analysis, it is not theoretically clear that we should assume that these indicators reflect only a single underlying factor. Out of the six V-Dem corruption indicators, the four executive and public sector indicators have separate questions on bribery and embezzlement, the judicial corruption indicator focuses on bribery, and the legislative corruption indicator asks about both bribery and embezzlement in one question.Footnote 18 That said, an unconstrained two-factor model explains less than 2% more variance in the manifest variables than the unidimensional model that we report here, providing observational justification for the one-factor assumption.Footnote 19 In sum, the factor analysis provides empirical support for the broad conclusions of the qualitative construct validity assessment: the indicators largely reflect a single underlying systematized concept.
This application of factor analysis illustrates that its value for evaluating data quality rests fundamentally on combining it with theory-driven content validity assessment, which generates expectations about factor structure that one can explore empirically. Here, we used exploratory factor analysis tools to examine a simple question: Do the indicators plausibly reflect a single coherent latent construct? The model allows us both to evaluate our expectations and to explore inconsistencies. Indeed, the weaker loadings for legislative and judicial corruption potentially inform subsequent analysis. One can use confirmatory factor analysis to examine the same question, as we demonstrate in the Appendix, and this approach may be especially useful when one has strong, or particularly nuanced, a priori assumptions about factor structure (see Harrington, Reference Harrington2008 for an accessible introduction to this massive literature). In general, factor analysis enables the researcher to explore the contours of the underlying latent structure of the data, which is a complement to—not substitute for—a theory-driven content validity assessment.
Finally, a measure’s content validity can also be assessed comparatively. In our application, assuming that the corruption researcher seeks a measure that captures “the use of public office for private gain,” we evaluate the content validity of the V-Dem corruption measures compared to alternative corruption measures. By their own descriptions, many of the alternative corruption measures include information about “public sector” or bureaucratic corruption, excluding executive, legislative, and judicial corruption. This includes CPI, the World Bank’s Business Environment and Enterprise Performance Survey (BEEPS), and nearly all the Barometers.Footnote 20 In contrast, some alternatives are not clear about which public offices are included in their measures. For example, Transparency International’s Global Corruption Barometer (GCB) combines data on the public sector with private “big interests,” and International Country Risk Guides’ Political Risk Services (ICRG) focuses on the “political system.” The World Values Survey (WVS) offers a more transparent and expansive conceptualization, including petty and grand corruption as well as the perversion of government institutions by private interests. In contrast, some alternative corruption measures capture a very narrow slice of “the use of public office for private gain.” For example, the International Crime Victims Survey asks only about exposure to bribery (Kennedy Reference Kennedy2014). Of course, if a narrower (or broader) conceptualization of corruption is held by the researcher, one of these alternative corruption measures may be appealing. However, given a corruption definition of “the use of public office for private gain,” the multi-form, multi-sectoral nature of the V-Dem corruption measures is useful because different countries are marred by corruption in different forms or sectors (Knack Reference Knack2007; Gingerich Reference Gingerich2013). Again, for substantive researchers, there is no objective “best” measure when it comes to content validity. The foremost consideration is the researcher’s theory and theoretical constructs, and each available measure will likely offer relative strengths and limitations.
4.2 Data Generation Process Assessment
The second component in our data quality assessment approach is an assessment of the validity and reliability of the data generation process. While these attributes of the data generation process have been discussed in other works, we synthesize these discussions and illustrate their implications for a quality assessment. The steps in this portion of the assessment include assessing the dataset management structure, data sources, coding procedures, aggregation procedures, and geographic and temporal coverage. Lack of transparency about the data generation process will make it difficult to assess these aspects for some measures, in which case the researcher may have to skip these steps of the assessment.Footnote 21 Data consumers should demand this information from producers when it exists and privacy concerns do not preclude its publication.
When measures draw upon the contributions of multiple respondents, we also recommend analyzing inter-respondent disagreement and intra-respondent biases to assess both the validity and reliability of the data generation process.Footnote 22 We illustrate this component of the assessment by evaluating the V-Dem data generation process and highlighting its strengths and limitations relative to alternative corruption data sources.
Dataset Management Structure
Often overlooked sources of bias are the leadership and funding for a dataset. This is documented by Hawken and Munck (Reference Hawken and Munck2009a), who find significant differences across corruption datasets, based on who is generating the data. In terms of data quality, leadership that is academic, rather than political or for-profit, and funding that is from diverse regions of the world, rather than from a single region or country, help to ensure that the organizational structure generates unbiased and reliable measures. In the case of V-Dem, it is an academic venture, led by scholars from universities in different countries with the V-Dem Institute at the University of Gothenburg, Sweden, as the organizational headquarters. Funding comes from research foundations and donor countries, mostly in Northern Europe, North America, and South America.
Data Sources
A key question to consider when evaluating potential bias and unreliability due to data sources is the number of data sources involved in generating the indicators and indices. As others have pointed out, datasets that aggregate information from different sources multiply biases and measurement errors by including those from each source in their composite measure, particularly if measurement errors across data sources are correlated (Herrera and Kapur Reference Herrera and Kapur2007; Treisman Reference Treisman2007; Hawken and Munck Reference Hawken and Munck2009a). V-Dem avoids this problem because it uses one data collection process to generate all corruption indicators and indices rather than synthesizing multiple data sources. In contrast, three of the most commonly used corruption measures—WGI, CPI, and ICRG—aggregate information from different sources.
V-Dem’s data generation process has the potential to generate a correlated errors problem of its own. In particular, because many of the same experts respond to the various corruption questions across the V-Dem surveys, there is the potential for rater error to correlate across indicators. Such correlated errors could undermine other aspects of our quality assessment, such as the factor analysis in our content validity analysis. This potential issue also implies that researchers should generally avoid predicting one V-Dem corruption indicator with another in applied work (Coppedge et al. Reference Coppedge2020).Footnote 23
Respondent Coding Procedures
When respondents generate data, it is important to examine: (1) the qualifications and potential biases of the respondents themselves and (2) the procedures for combining respondent answers into a single measure (Treisman Reference Treisman2007; Martinez i Coma and van Reference Martinez i Coma and van Ham2015). We consider both of these below for the case of the V-Dem corruption measures.
Before evaluating the first area of coding procedures regarding respondent qualifications and biases, we first consider the appropriateness of the respondent pool. Several scholars have argued that expert-coded measures of corruption are inferior to citizen-coded or “experience” measures (Treisman Reference Treisman2007; Hawken and Munck Reference Hawken and Munck2009a,Reference Hawken, Munck, Rajivan and Gampatb; Donchev and Ujhelyi Reference Donchev and Ujhelyi2014). Rather than privileging one type of respondent over another, we recommend considering which type of respondent is best from a content validity perspective. For example, if a researcher is defining corruption as “the use of public office for private gain,” citizen respondents present certain disadvantages. Citizen perceptions of corruption are fundamentally limited because they interact with only certain kinds of officials and observe certain kinds of corruption. Alternatively, the potential disadvantage of far-removed experts coding conditions in a country can be addressed by relying on experts who are residents or nationals of the countries—effectively serving as both expert coders and citizen respondents. If, instead, a researcher defines corruption narrowly to mean bribery, these disadvantages of citizen-coded measures of corruption transform into advantages. Once again, the choice of most appropriate respondent (and therefore most appropriate measure) should be based on the theory underpinning the research.
Given the definition of corruption employed elsewhere in this article—“the use of public office for private gain”—we assume an expert perspective is useful, and we move on to considering whether the particular experts within V-Dem are unbiased. The stringent selection criteria for experts within V-Dem could offset possible sources of bias. V-Dem experts have been recruited based on their academic or other credentials as field experts in the area for which they code and on their seriousness of purpose and impartiality (Coppedge et al. Reference Coppedge2017). Impartiality is not a criterion to take for granted in political science research. Martinez i Coma and van (Reference Martinez i Coma and van Ham2015) noted that variance in estimates of election integrity in the Perceptions of Electoral Integrity dataset was significantly higher when one of the respondents was a candidate in the election. Further, no one respondent’s background or biases can drive the estimates for a given country in the V-Dem dataset. At least five V-Dem experts code each question-country-year observation for a total of more than 3,000 experts involved to produce the dataset.Footnote 24
We now turn our attention to the second area of coding procedures regarding combining respondent ratings into a single measure. When measures are based on ratings from multiple respondents, we can evaluate the process for combining information across respondents and use this information to provide estimates of the reliability of the measure. Researchers can adjust their inferences accordingly for measurement error. In assessing this, we ask if the process accounts for both systematic biases in how respondents answer questions and non-systematic variation in respondent reliability. For example, if respondents provide ordinal ratings and they vary in how they map those ratings onto real cases—perhaps, for example, one respondent has a lower tolerance for corruption than another—then a process that models and adjusts for this issue will outperform a more naive process. This is known as a differential item functioning (DIF) and affects most survey-based data collection processes. Similarly, it might be justifiable to weight more highly the contributions of more reliable respondents. Most multirespondent measures are generated by taking the average of the responses and, if reliability estimates are provided, they are in the form of standard deviations. These simple estimation procedures implicitly assume that there are no systematic differences in the way respondents produce ratings, treating respondents as equally reliable. When these assumptions are wrong, such procedures will generate flawed point estimates and measures of reliability (Pemstein, Meserve, and Melton Reference Pemstein, Meserve and Melton2010; Lindstaedt, Proksch, and Slapin Reference Lindstaedt, Proksch and Slapin2016).
To combine respondent answers to generate country-year observations, V-Dem use statistical item response theory (IRT) techniques to model variation in respondent reliability while allowing for the possibility that respondents apply ordinal scales differently (Pemstein et al. Reference Pemstein2020). The model uses bridge respondents, who rate multiple countries for many years, to calibrate estimates across countries. The model also uses lateral coding, which involves coding many countries for only 1 year, a technique which facilitates calibration across respondents. Finally, the model employs anchoring vignettes to further improve the estimates of respondent-level parameters and thus the concepts being measured. Anchoring vignettes are descriptions of hypothetical cases that provide all the necessary information to answer a given question. Since there is no contextual information in the vignettes and all respondents evaluate the same set of vignettes, they provide information about how individual respondents understand the scale and how they systematically diverge from each other in their coding.
In general, this discussion provides some reassurance that the V-Dem respondents are relatively unbiased and there is a comprehensive approach to mitigate DIF across respondents. The more general insight here, however, is that no respondent is free of bias and no respondent pool is free of DIF. High-quality measures come from producers who attempt to minimize biases, including DIF, and provide transparent information about how they do so.
Aggregation Model
Many datasets, including V-Dem, offer low-level measures (indicators) that they combine into higher-level measures (indices). To assess the validity and reliability of the resulting higher-level measures, it is important to consider: (a) the choice of measures to aggregate and (b) the aggregation rules. There are no objective standards for selecting low-level measures for an index or developing aggregation rules. When a researcher evaluates these decisions as part of a measure quality assessment, the most important consideration is the researcher’s theory. Similar to the evaluation of content validity discussed above, a relatively high-quality index will be one with constituent indicators that capture all the dimensions of the theoretical construct, that is formed using aggregation rules that align with the researcher’s theory regarding how these indicators interact and weight relative to each other.
In the case of the V-Dem corruption measures, the V-Dem dataset includes six corruption indicators. The first four capture bribery in the executive (v2exbribe), in the legislature (v2lgcrrpt), in the judiciary (v2jucorrdc), and in the public sector (v2excrptps). The last two capture embezzlement in the executive (v2exembez) and in the public sector (v2exthftps). V-Dem aggregates these indicators into the V-Dem Corruption Index using a two-stage approach. In the first stage of aggregation, V-Dem fits a BayesianFootnote 25 factor analysis model to the two indicators capturing executive branch corruption (v2exbribe and v2exembez) and, separately, to the two indicators capturing public sector corruption (v2excrptps and v2exthftps). In the second stage, to construct the high-level V-Dem Corruption Index (v2x_corr), V-Dem averages the executive corruption index (v2x_execorr), the public sector corruption index (v2x_pubcorr), the indicator for legislative corruption (v2lgcrrpt), and the indicator for judicial corruption (v2jucorrdc). In other words, V-Dem weighs each of these four spheres of government equally in the resulting index.Footnote 26
From a comparative standpoint, both the WGI and CPI choose indicators for aggregation to minimize missingness (Hawken and Munck Reference Hawken and Munck2009a). V-Dem does not have such a constraint, as the level of missingness does not vary greatly from one indicator to another.
Coverage Across Countries and Time
It is important to consider potential biases introduced by limited geographic or temporal coverage of a measure. Particularly with sensitive topics, such as corruption, choosing cases can introduce selection bias. Thus, maximizing case coverage also improves measurement validity.
The V-Dem corruption measures perform well on the question of coverage. V-Dem covers nearly all countries, avoiding the bias in datasets of only a subset of countries (those easiest to code or those for which respondents are readily available).Footnote 27 By asking the same questions of each respondent for each country-year, V-Dem allows over-time and cross-country comparisons of corruption levels in the world back to 1900.
The quality of V-Dem corruption measures for analysis across space and time is one of their key strengths. Alternative measures of corruption are typically taken at the country level, where comparisons across countries often come at the expense of comparisons over time (Arndt and Oman Reference Arndt and Oman2006; Galtung Reference Galtung, Galtung and Sampford2006; Knack Reference Knack2007). For example, WGI is calculated such that the global average is the same every year; changes in the level of corruption within a country are not revealed unless the change is so great as to move it up or down in the comparative rankings (Lambsdorff Reference Lambsdorff2007). Kaufmann and Kraay (Reference Kaufmann and Kraay2002) estimate that half the variance in WGI over time is the product of changes in the sources and coding rules used, rather than actual changes in corruption levels. Treisman (Reference Treisman2007) notes that CPI’s aggregation procedures and data sources have changed over time, which may mean substantive results using CPI data are release-dependent.
Analyzing Respondent Disagreement and Biases
Conducting an analysis of respondent disagreement is another tool to assess the validity and reliability of the data generation process.Footnote 28 Unlike Steenbergen and Marks (Reference Steenbergen and Marks2007) and Martinez i Coma and van (Reference Martinez i Coma and van Ham2015), who primarily compare ratings across respondents as a test of validity, we argue that inter-respondent disagreement provides insight into both validity and reliability. Clearly, a measure is more reliable when inter-respondent disagreement is low. Inter-respondent disagreement can also be seen as a measure of validity if one is willing to assume that multiple respondents are unlikely to exhibit identical biases.Footnote 29 When respondent or country characteristics predict disagreement systematically, this suggests potential sources of bias in the data.
For the V-Dem corruption measures, We assess systematic determinants of respondent disagreement in a regression framework in Table 3, where the dependent variable is the standard deviation of measurement model-adjusted ratings among respondents for each country and year.Footnote 30 To ease interpretation of the results in Table 3, note that the mean of the standard deviation of model-adjusted ratings across respondents is 0.158 (the median is 0.148) and the standard deviation is 0.112. In interpreting the coefficient of –0.039 for freedom of expression, for example, it implies that a unit shift in freedom of expression - tantamount to a comparison between North Korea and Switzerland (the index being scaled to vary from 0 to 1)—on average implies a 0.039 decrease in respondent disagreement, which amounts to around a third of the variation.
Table 3 Predicting respondent disagreement.
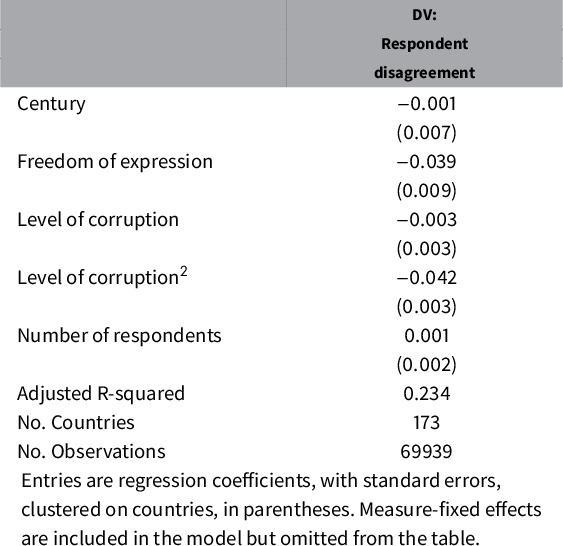
Controlling for the number of respondents, we find that respondent disagreement varies predictably.Footnote 31 For three of the six V-Dem corruption measures (Supplementary Appendix Table S6) and in the pooled model (Table 3), respondent disagreement is statistically significantly lower in countries with widespread freedom of expression, indicating that limited access to information influences respondents’ evaluations. The quadratic term for the level of corruption is negative and statistically significant, indicating that the greatest disagreement occurs in countries with the lowest levels of corruption. The time variable (Century) produces a more mixed pattern across the disaggregated corruption measures (Supplementary Appendix Table S6), and the coefficient for Century in the pooled model is statistically insignificant. This result qualifies the notion that the distant past is harder to code than the present. Overall, we conclude that respondent disagreement is not critically high and that it varies with the level of information and the level of corruption in a way that might be expected.
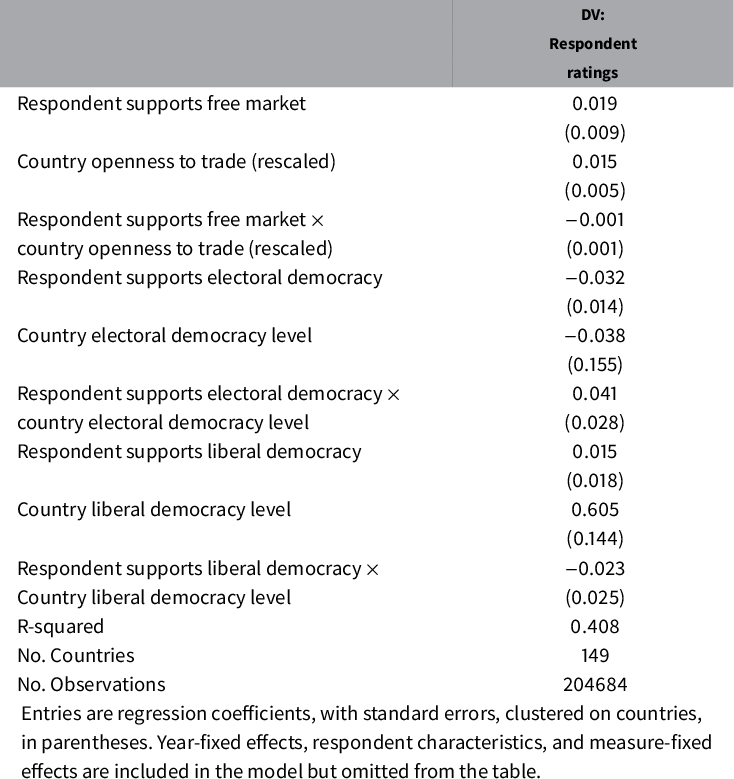
We next evaluate the quality of the V-Dem corruption measures by testing for a potential form of bias that Bollen and Paxton (Reference Bollen and Paxton2000) call “situational closeness,” or the idea that “judges will be influenced by how situationally and personally similar a country is to them” (p. 72). In other words, we test whether there is ideological bias among respondents geared toward certain types of countries. The V-Dem postsurvey questionnaire allows us to evaluate three such respondent-country characteristic interactions: whether respondents who support free markets provide different corruption ratings for free trade economies (using a measure for trade openness from the Correlates of War project); whether those who support the principles of electoral democracy tend to provide different corruption ratings for electoral democracies; and whether those who support the principles of liberal democracy tend to provide different corruption ratings for liberal democracies.
The results of the analysis considering how respondent and country characteristics might interact in Table 4 are again quite reassuring.Footnote 32 Unsurprisingly, respondents consider more “liberal” countries less corrupt. More importantly, respondents who strongly support this “liberal” principle do not code or perceive more liberal countries differently than respondents who do not exhibit such support. Respondents also consider more open economies less corrupt, but this has no effect on how free market ideological bias affects ratings. With no interactions being statistically significant, there seems to be no overall ideological bias or “situational closeness” introduced by the context of the country being coded.
Table 4 Predicting respondent ratings with respondent and country characteristics.
Beyond the assessment of the V-Dem corruption measures, this section illustrates how researchers can use information provided about the data generation process and data generators (e.g., respondents) to analyze disagreement between data generators and determinants of generator biases. Often, as here, data generators will be respondents, but analysts can apply these techniques whenever data is generated by multiple sources. This analysis, in turn, suggests the types of cases, points in time, and research questions where a measure may provide higher or lower quality estimates, information that can shape substantive conclusions from data analysis.
4.3 Convergent Validity Assessment
Our final data quality assessment component asks: To what extent do the measures correspond to alternative data sources? First, we suggest conducting a traditional convergent validity analysis, visually and statistically comparing the correlation between the chosen measure and possible alternatives. Second, we recommend statistically examining the extent to which observable aspects of the data generation process predict systematic divergence between the chosen measure and the alternatives. Finally, we recommend examining the convergence between the measure and original or pre-existing qualitative cases studies.
Basic Quantitative Convergent Validity
A typical convergent validity test aims to use statistical tools (e.g., correlation coefficients) to assess whether various measures appear, on aggregate, to tap into the same concept. However, a broader convergent validity assessment can identify a measure’s relative strengths and limitations compared to other measures the researcher might choose. In terms of substantive research, the goal of this exercise is to answer the question: When might the findings of research be sensitive to using this measure instead of others?
Before embarking on this more detailed analysis of convergent validity, however, considering aggregate correlation coefficients is a useful first step. Since the measures most comparable to the V-Dem Corruption Index—WGI and CPI—explicitly discourage comparisons over time, we assess aggregate convergent validity on a year-by-year basis. In Figure 1, we present the association between the V-Dem Corruption Index and WGI and CPI for 1 year (2010), but the patterns remain similar across all years. Both pooled correlation coefficients are around 0.90: clear evidence of convergent validity. Divergence between V-Dem and WGI or CPI is particularly limited when considering the most corrupt countries. However, there are differences in how V-Dem compares to WGI versus CPI. The deviations from WGI are more uniformly distributed over the range of the V-Dem Corruption Index, whereas the V-Dem Corruption Index is systematically lower than CPI for countries with a moderate level of corruption, and systematically higher for countries with extreme levels of corruption.
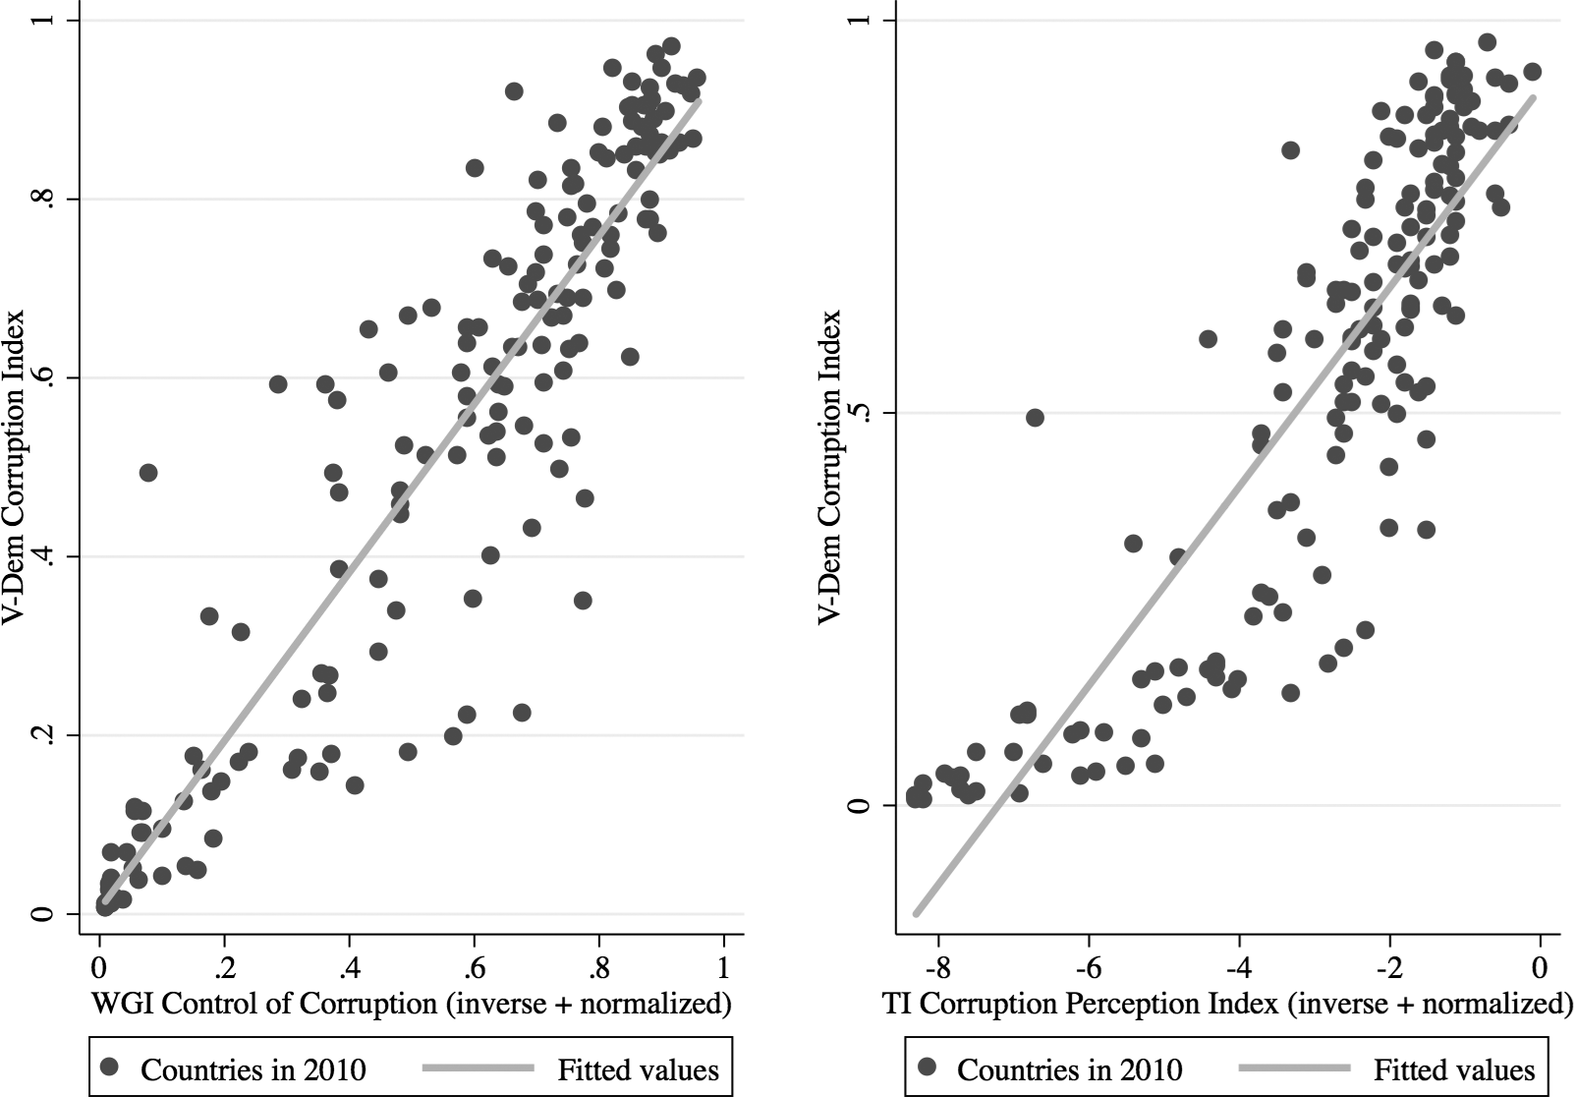
Figure 1 Comparing the V-Dem Corruption Index with the WGI and CPI Corruption Indices.
Statistical Analysis of Measure Convergence
Explaining patterns of convergence and divergence is as, or more, important as demonstrating strong correlations (Adcock and Collier Reference Adcock and Collier2001; Bowman, Lehoucq, and Mahoney Reference Bowman, Lehoucq and Mahoney2005). As Hawken and Munck (Reference Hawken and Munck2009a) note, “Consensus is not necessarily indicative of accuracy and the high correlations … by themselves do not establish validity” (p. 4). While one rarely has access to a “gold standard” against which to assess convergence, researchers can model systematic determinants of divergence. Therefore, the next step in our proposed convergent validity assessment is to identify the correlates of divergence and attempt to diagnose the cases where the use of one measure over another could be consequential.
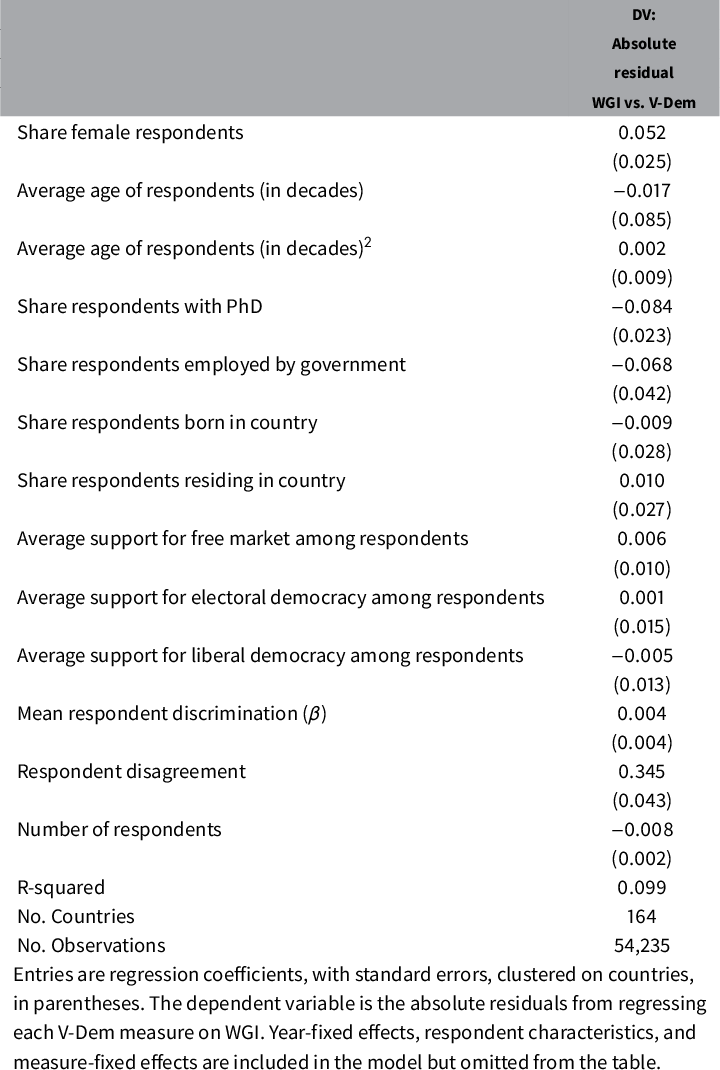
In applying this analysis to the case of the V-Dem corruption indicators, we ask whether the composition of V-Dem respondents per country and year, measured with average respondent characteristics, affects the tendency for V-Dem to deviate from WGI.Footnote 33 In other words, what are the respondent composition predictors of the absolute residuals in Figure 1 (pooled across all years)?
We present the results of this analysis in Table 5.Footnote 34 The gender composition coefficient is positive and statistically significant; the larger the share of female V-Dem respondents, the larger the absolute difference between V-Dem and WGI. Moreover, WGI and V-Dem diverge less when V-Dem relies more heavily on PhD-holding respondents. Overall, however, the pattern is clear: there are few systematic predictors of the deviations between WGI and V-Dem Corruption Index.
Table 5 Explaining deviations from WGI control of corruption index with aggregate respondent characteristics
Predicting convergence between a measure and its alternative(s) as we have modeled it here relies on the availability of data about respondent traits. This information is not always available. However, there may be other available information about cases, respondents, or data sources to facilitate unpacking patterns in convergence and divergence. Our aim is not to prescribe the set of predictors, but rather to demonstrate the kind of insight that can be obtained by a detailed convergent validity assessment.
Convergent Validity Assessment with Case Studies
Even when a chosen measure generally converges with alternative measures, it is useful to examine convergent validity in the context of specific examples. Researchers can use case studies to scrutinize particularly salient examples of divergence and examine how the information presented by quantitative measures corresponds to actual cases. The case studies are labor-intensive, so it is important to select cases purposefully to assess the measures in question. It is also preferable to perform the exercise “blind,” meaning that one reads the available case material about corruption in a country and writes her case study before seeing the measures (which possibly necessitates the involvement of a collaborator who has not yet examined the data).
In applying this component of the approach to assess the V-Dem corruption measures, an experienced research assistant completed the blind case studies prior to ever reviewing the V-Dem corruption data (or any of the alternative corruption measures) for the cases.Footnote 35 We selected four countries for case studies to evaluate V-Dem. We chose Georgia and Zambia, from their points of independence to the present, because V-Dem corruption measures for these countries differ significantly from those produced by alternative corruption measures, specifically WGI and CPI. We also selected historical Spain and the United States to check the quality of the V-Dem Corruption Index going back in time. We examine both countries from 1900 and stop with 1988 for Spain and 1955 for the United States to capture periods of dramatic change. In this case, we do not compare the V-Dem measures of corruption with alternative corruption measures because there are no alternative corruption measures with this level of historical coverage. Due to space constraints, we present Zambia and the United States here and Georgia and Spain in the Supplementary Appendix.
For Zambia, the contrast among the measures is substantial, as Panel (a) of Figure 2 demonstrates. For a period, V-Dem and CPI move in opposite directions, with V-Dem showing a greater magnitude of change. V-Dem also differs from WGI, which depicts a relatively steady decline in corruption, whereas V-Dem shows more sudden shifts in corruption. Yet, the V-Dem measure matches published accounts of corruption in Zambia more closely than alternative corruption measures (Chikulo Reference Chikulo, Hope and Chikulo2000; Szeftel Reference Szeftel2000; Van Donge Reference Van Donge2009; Mbao Reference Mbao2011). During Zambia’s First and Second Republics, from independence in 1964 until 1990, corruption was pervasive in the country, according to published accounts. The relatively high score on the V-Dem scale reflects this. As the economy worsened in the early 1970s, civil servants increasingly turned to theft of state resources to augment their salaries: the V-Dem measure captures this increase. Since then, the increase in corruption can mainly be attributed to the informal practices of government elites. In the first years of the Third Republic, government officials used the privatization campaign to enrich themselves, according to published reports. Thick descriptions do not mention the small dip in the late 1990s that the V-Dem measure depicts (as does WGI, but not CPI). Otherwise, the case material and V-Dem measure move in lockstep for this era. The published accounts allude to a decline in corruption with the 2001 exit of President Frederick Chiluba and other officials who were implicated in theft of state resources. Corruption in the country then began to increase in 2008 with the election of new presidents in 2008 and 2012, according to those accounts. The V-Dem measure mirrors this pattern, except for showing a small drop in 2011, which the case material do not mention (but the other measures depict).
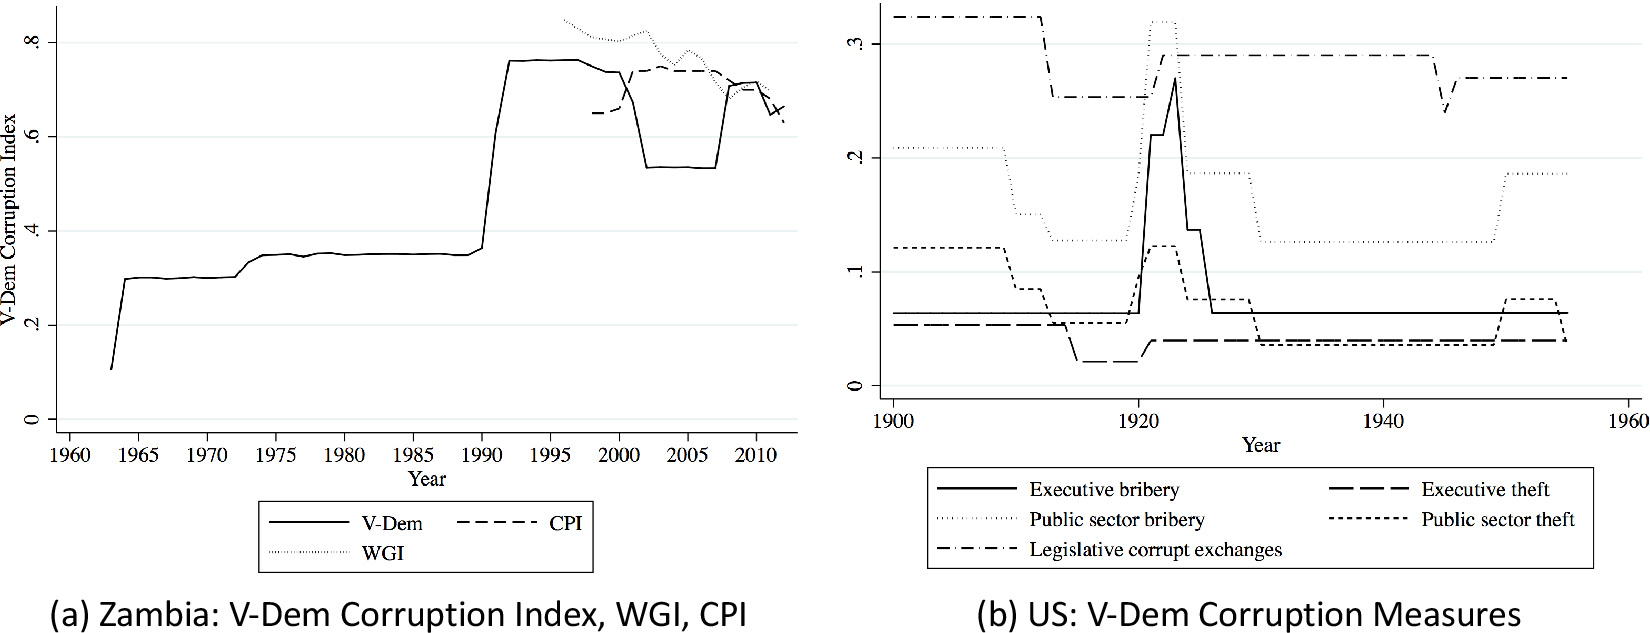
Figure 2 Corruption over time: Zambia and the United States.
For the United States, both the V-Dem Corruption Index and its constituent measures align with the details provided in the case material, increasing our confidence in the V-Dem measures going back in time and demonstrating the utility of providing disaggregated measures of corruption in addition to a high-level measure (Benson, Maaranen, and Heslop Reference Benson, Maaranen and Heslop1978; Woodiwiss Reference Woodiwiss1988; Reeves Reference Reeves2000; Grossman Reference Grossman2003; Menes Reference Menes2003). At the turn of the century, U.S. government bureaucrats stole state resources and exchanged state services for personal material gain. However, the Progressive Movement of the early 1900s discouraged and lessened this corruption. The V-Dem Corruption Index depicts this decrease in corruption. Corruption increased in 1921 with the administration of Warren Harding, fueled by Prohibition-era bribes from liquor smugglers, and declined upon his death in 1923. The V-Dem Corruption Index approximates this account well. The measure shows a small increase in 1920 but then, aligning with case material about the United States, a significant increase in 1921 followed by a dramatic decrease in 1924.
The value of the individual V-Dem measures becomes especially apparent with the Harding administration. The measures diverge, reflecting patterns described in the case material. As depicted in Panel (b) of Figure 2, there is an increase in executive and public sector bribery, and—to a lesser extent—embezzlement. However, this period is not characterized by a dramatic increase in legislative corruption, as is also discussed in the case material.Footnote 36 Legislative corruption, such as the awarding of military contracts in exchange for bribes, was central to corruption during World War II and sustained it during this period. With the end of the war and prosecutions for the schemes, these opportunities subsided. The V-Dem legislative corruption measures capture the dip in corruption at the end of the war in 1945. The individual V-Dem measures also match the published accounts of increased corruption by bureaucrats in numerous agencies during the Truman administration. The V-Dem measure shows that corruption increased during the Truman administration (1945–1953): corruption levels jump in 1950 and drop in 1955. Trends for individual V-Dem measures support the scholars’ accounts, showing that public sector bribery and theft, rather than executive or legislative corruption, were driving this shift (panel (b), Figure 2). Overall, the V-Dem measures present a picture similar to qualitative case material regarding corruption in the United States historically.
In general, the analysis of Georgia, Zambia, Spain and the United States that we present here and in the Supplementary Appendix suggests that the V-Dem corruption measures generally converge with available case material. The six corruption measures capturing different forms of corruption in different sectors of government seem to converge and diverge in line with published reports on the cases. More generally, this application illustrates the value of using qualitative material to validate quantitative measures. In the case where the measure being assessed does not have a quantitative alternative, comparing it to case studies facilitates a form of convergent validity assessment that can still yield valuable information about the measures' areas of strength and limitation.
5 Discussion
As Herrera and Kapur (Reference Herrera and Kapur2007) wrote, “Inattentiveness to data quality is, unfortunately, business as usual in political science” (p. 366). To address this issue, we synthesize a set of complementary, flexible, practical, and methodologically diverse tools for assessing data quality into a comprehensive approach. This holistic approach updates early guidance that balanced careful attention to construct validity with the application of empirical tools for assessing both validity and reliability (Zeller and Carmines Reference Zeller and Carmines1980).
Our proposed approach includes three components: a content validity assessment; a data generation process assessment; and a convergent validity assessment. Each component involves the use of qualitative and quantitative tools, developed by other scholars and synthesized by us. In addition, we innovate over existing validity assessment in three ways. First, our assessment includes a road map for evaluating the validity and reliability of the data generation process as a signal of resulting data quality. Second, it includes an analysis of the predictors of inter-respondent disagreement and intra-respondent biases to assess both reliability and validity. Third, we propose a qualitative case assessment using blind coding as one piece of a convergent validity assessment.
In a world of limited data, it is often tempting to conduct validation tests, mention they have been done in a footnote of a paper, and then say no more about it. The literature on validation has provided scant guidance about what to do with the findings of a validation exercise, nor how to use validation results to inform substantive research conclusions, beyond adopting or discarding a measure. Yet, validation exercises provide rich information about how strengths and limitations of a chosen measure might affect the findings of substantive research, or more specifically, the conditions under which substantive conclusions might be more or less robust. We therefore now provide five examples of how the findings of our data quality assessment approach applied to the V-Dem corruption measures might be incorporated by researchers conducting substantive analyses with these measures.
First, our content validity assessment reveals that V-Dem corruption measures are best suited to research on exchange-based, material corruption among public officials. The six low-level measures and the high-level corruption measure do not capture, or capture only minimally, other forms of corruption, including revolving door, vote-buying, and nepotism. Substantive research about these forms of corruption should not rely on the V-Dem corruption measures for data.
Second, our data generation process assessment underscored that V-Dem respondents and V-Dem management each represent diverse backgrounds. This finding suggests that the V-Dem corruption measures might be particularly useful when conducting substantive research in which the theory is most salient in non-Western societies or researchers expect heterogeneous effects across contexts.
Third, also from the data generation process assessment, we learned that V-Dem inter-respondent disagreement for a country-year observation is inversely related to the level of freedom of expression and the level of corruption. This in turn means there will be more uncertainty in V-Dem Corruption Index estimates for countries with low freedom of expression or low levels of corruption. This uncertainty has the potential to diminish the robustness of results when testing theories pertaining to less free societies or relatively low-corruption contexts.Footnote 37
Fourth, the data generation process assessment highlighted the relative value of using V-Dem measures for time-series, cross-sectional research on corruption. The consistency of the V-Dem coding procedures and aggregation procedures across all years will enable researchers to use the V-Dem Corruption Index to examine corruption dynamics over time. Similarly, V-Dem’s use of a sophisticated measurement model, bridge respondents, lateral respondents, and anchoring vignettes facilitates cross-country comparison. The extensive temporal and geographic coverage of the measures also enables time-series, cross-sectional research. Researchers more focused on a particular time period or set of countries may not highly value these relative strengths of the V-Dem corruption measures.
Fifth, our convergent validity findings about respondent characteristics indicate it may be useful, when using the V-Dem corruption measures, to conduct additional measurement validation specific to one’s research project. We found that as the percentage of female or non-PhD respondents increases, so does the difference between the V-Dem Corruption Index and WGI. Because recruiting either women or those with PhDs might be correlated with another characteristic of a country that is under study, researchers using V-Dem measures of corruption may be over- or under-inflating findings compared to using alternative corruption measures like the WGI Control of Corruption Index. For that reason, researchers would be wise to examine correlations between female and PhD respondents with their variables of interest to understand how use of the V-Dem corruption measures may affect their findings.
These five points highlight how researchers might begin to think about mitigating concerns and utilizing strengths in working with the V-Dem corruption measures. More generally, this discussion offers an example of how the findings of a data quality assessment could inform substantive research. The overarching point is that any given measure will be more or less appropriate depending on the theoretical concepts under study, the expected relationship, and the set of cases pertinent to the research question. There are no optimally valid and perfectly reliable measures, and data consumers would be wise to diagnose, acknowledge, and mitigate strengths and limitations regarding data quality proactively and transparently.
Funding
This work was supported by the Riksbankens Jubileumsfond (grant number M13-0559:1); the Knut & Alice Wallenberg Foundation (to S.L.); the Swedish Research Council (to S.L. and J.T.); the National Science Foundation (grant number SES-1423944 to D.P.); and the Wenner–Gren Foundation and the European University Institute’s Fernand Braudel Senior Fellowship (to J.T.).
Acknowledgments
The authors are grateful to Gerardo Munck and other participants in the 2015 V-Dem Internal Research Conference for their comments and to Talib Jabbar and Andrew Slivka for their research assistance.
Conflicts of Interest
The authors of this manuscript have no conflicts of interests to disclose.
Data Availability Statement
The replication materials for this paper can be found at McMann et al. (Reference McMann, Pemstein, Seim, Teorell and Lindberg2021a; Reference McMann, Pemstein, Seim, Teorell and Lindberg2021b).
Supplementary Material
For supplementary material accompanying this paper, please visit https://doi.org/10.1017/pan.2021.27.


