Introduction
Watermelon [Citrullus lanatus (Thunb.) Matsum. & Nakai var. lanatus, 2n= 2x= 22] is an economically important vegetable crop that is grown on approximately 7% of the world's cultivated land area with an annual production of about 109 million tons (FAO Statistics 2013, http://faostat.fao.org/). China is the leading watermelon-producing country accounting for 71% of the world's production. More recently, in China, the economic and nutraceutical importance of watermelon has increased, thus challenging breeders to develop new varieties combining high fruit quality with enhanced resistance to biotic and abiotic stresses.
A number of watermelon genotypes and cultivars possess good morphological and horticultural traits, and some of them have been selected as core breeding materials and used extensively as parental lines in watermelon breeding programmes. A major challenge for breeders is to be able to accurately estimate the relationship between parents before initiating hybridization. This is particularly important since cultivated watermelon has been shown to exhibit narrow genetic diversity (Levi et al., Reference Levi, Thomas, Keinath and Wehner2001a, Reference Levi, Thomas, Wehner and Zhangb), resulting in progenies displaying undesirable agronomic characteristics obtained from the crosses. Knowledge of the genetic relationships and characterization of watermelon diversity, including core genotypes that are being used as parents in the current watermelon breeding programmes, can facilitate efficient management and improved utilization of available genotype resources.
Generally, genetic variation in plants can be characterized using morphological and molecular methods. However, the use of molecular markers has the advantage of improved reliability and repeatability (Powell et al., Reference Powell, Morgante, Andre, Hanafey, Vogel, Tingey and Rafalski1996). Molecular markers previously used for characterization of genetic diversity in watermelon genotypes include random amplified polymorphic DNA (RAPD; Mujaju et al., Reference Mujaju, Werlemark, Garkava-Gustavsson and Nybom2010), amplified fragment length polymorphism (AFLP; Che et al., Reference Che, Liang, Wang, Jin, Wang, Xu, Kang and Zhang2003), simple sequence repeat (SSR; Kwon et al., Reference Kwon, Oh, Yi, Kim, An, Yang, Ok and Shin2010) and expressed sequence tags-SSRs (EST-SSR; Mujaju et al., Reference Mujaju, Sehic and Nybom2013). However, these marker systems utilize limited molecular markers and are primarily gel-based, costly and time consuming. In contrast, single nucleotide polymorphism (SNP) markers offer substantial advantages over PCR-based methods such as large-scale genotyping, generation of high-abundance sequence information and whole-genome coverage to allow genetic studies (Gupta et al., Reference Gupta, Rustgi and Mir2008; Singh et al., Reference Singh, Choudhury, Singh, Kumar, Srinivasan, Tyagi, Singh and Singh2013). The method has been widely applied to various crop species, such as rice (Singh et al., Reference Singh, Choudhury, Singh, Kumar, Srinivasan, Tyagi, Singh and Singh2013), maize (Van Inghelandt et al., Reference Van Inghelandt, Melchinger, Lebreton and Stich2010), wheat (Nielsen et al., Reference Nielsen, Backes, Stougaard, Andersen and Jahoor2014) and melon (Esteras et al., Reference Esteras, Formisano, Roig, Díaz, Blanca, Garcia-Mas, Gómez-Guillamón, López-Sesé, Lázaro and Monforte2013), for genetic variability analysis. With the falling costs of DNA sequencing and availability of whole-genome sequence of watermelon (Guo et al., Reference Guo, Zhang, Sun, Salse, Lucas, Zhang, Zheng, Mao, Ren, Wang, Min, Guo, Murat, Ham, Zhang, Gao, Huang, Xu, Zhong, Bombarely, Mueller, Zhao, He, Zhang, Zhang, Huang, Tan, Pang, Lin, Hu, Kuang, Ni, Wang, Liu, Kou, Hou, Zou, Jiang, Gong, Klee, Schoof, Huang, Hu, Dong, Liang, Wang, Wu, Xia, Zhao, Zheng, Xing, Liang, Huang, Lv, Wang, Yin, Yi, Li, Wu, Levi, Zhang, Giovannoni, Wang, Li, Fei and Xu2013), a new SNP-based marker platform known as DArTseq was developed recently by combining the Diversity Arrays Technology (DArT) marker system with Illumina short-read sequencing method (Sansaloni et al., Reference Sansaloni, Petroli, Jaccoud, Carling, Detering, Grattapaglia and Kilian2011).
Here we used DArTseq-based SNP markers at the whole-genome level to analyse the genetic diversity of core watermelon genotypes that have been widely and commonly used in watermelon breeding programmes of China. Our results will facilitate further exploitation of these genotypes by researchers and breeders for watermelon improvement.
Materials and methods
Plant materials and DNA extraction
In the present study, a set of 37 watermelon core genotypes, including elite watermelon cultivars, inbred lines and wild watermelon genotypes, were evaluated. Single seed of each watermelon genotype was first pre-germinated and then transferred into pots (15 cm × 15 cm) filled with compost mix of sand and peat [1:1 (v/v), Levington M1 compost; Monro Group, Rendlesham, Suffolk, UK] for growing. At the four-leaf stage, one or two leaf pieces for each plant were collected for DNA extraction. The leaf samples were first placed in plastic bags with tiny holes and then vacuum-dried in a SuperModulyo freeze dryer (Thermo Savant, Holbrook, NY, USA) for 7 d, and stored before DNA extraction. Seedlings were grown under controlled growth room conditions with a 16 h light–8 h dark cycle and temperatures of 28°C during the day and 20°C during the night. The main characteristics obtained from the trials carried out over the last 2 years (2011 and 2012) at the watermelon breeding research station, Jiangsu Academy of Agricultural Sciences, are given in Supplementary Table S1 (available online).
Freeze-dried leaf samples (0.1 g) were ground completely in a 2 ml Eppendorf tube with added garnet sand (0.15 mm/0.7 mm) using a FastPrep®-24 Instrument (MP Biomedicals Inc., Heidelberg, Germany). DNA extraction was performed using the modified CTAB (cetyltrimethylammonium bromide) method (Ren et al., Reference Ren, Wang, Chen and Zhang2012). The quality and quantity of DNA samples were determined by agarose gel analysis, and DNA concentration was adjusted to 50–100 ng/μl.
DArTseq-based SNP analysis
Based on the preliminary tests for appropriate enzyme combinations in cucurbits, the restriction enzyme combination PstI-MseI was chosen for the digestion of a mixture of DNA samples. After digestion, DNA samples were processed in digestion/ligation reactions principally according to the method described by Kilian et al. (Reference Kilian, Wenzl, Huttner, Carling, Xia, Blois, Caig, Heller-Uszynska, Jaccoud, Hopper, Aschenbrenner-Kilian, Evers, Peng, Cayla, Hok and Uszynski2012), but replacing a single PstI-compatible adaptor with two different adaptors corresponding to two different restriction enzyme overhangs. The PstI-compatible adaptor was designed to include Illumina flow cell attachment sequence, sequencing primer sequence and ‘staggered’, varying length barcode region, similar to the sequence reported by Elshire et al. (Reference Elshire, Glaubitz, Sun, Poland, Kawamoto, Buckler and Mitchell2011). Reverse adaptor contained flow cell attachment region and MseI-compatible overhang sequence. Only ‘mixed fragments’ (PstI-HpaII) were effectively amplified in 30 rounds of PCR using the following reaction conditions: 1 min at 94°C for initial denaturation; 30 cycles each consisting of 20 s at 94°C for denaturation, 30 s at 58°C for annealing, 45 s at 72°C for extension; finally a 7 min extension step at 72°C. After PCR, equimolar amounts of amplification products from each sample of the 96-well microtitre plate were bulked and applied to c-Bot (Illumina) bridge PCR followed by sequencing on Illumina Hiseq2500. The sequencing (single read) was run for 77 cycles. Sequences generated from each lane were processed using proprietary DArT analytical pipelines and the corresponding fastq files were first processed to filter poor-quality sequences, applying more stringent selection criteria to the barcode region compared with the rest of the sequence. Accordingly, the assignments of the sequences to specific samples carried in the ‘barcode split’ step were very reliable. Approximately 2,500,000 ( ± 7%) sequences per barcode/sample were used in marker calling. Finally, identical sequences were collapsed into ‘fastqcall files’. These files were used in the secondary pipeline for DArT Proprietary Limited (PL's) proprietary SNP and SilicoDArT (presence or absence of restriction fragments in representation) calling algorithms (DArTsoft14).
Data analysis
Marker attributes for each marker locus were calculated using the software PowerMarker version 3.25 (Liu and Muse, Reference Liu and Muse2005), including major allele frequency, gene diversity, polymorphic information content (PIC), gene diversity and heterozygosity. Based on genetic similarity, a dendrogram was constructed by application of the unweighted pair group method with neighbour-joining (NJ) cluster analysis using the software Darwin version 5.0 (Perrier et al., Reference Perrier, Flori, Bonnot, Hamon, Seguin, Perrier and Glassman2003). It was also used to perform the principal coordinate analysis (PCoA) to visualize the genetic relationships among individual watermelon genotypes.
The software program STRUCTURE v2.3 (Pritchard et al., Reference Pritchard, Stephens and Donnelly2000) was used to infer population structure. Estimation of the best K value (the number of clusters) was performed by evaluating K= 1 to 8 using the admixture and correlated allele frequency models. Five independent runs were made for each value of K. Each run consisted of a burn-in period of 10,000 iterations followed by 10,000 Monte Carlo Markov chain iterations. Both LnP(D) in STRUCTURE output and its derived ΔK method (Evanno et al., Reference Evanno, Regnaut and Goudet2005) were used to determine the K value.
Results
Characterization of SNP markers
A total of 4808 polymorphic SNP markers with a scoring reproducibility of 99.7% and a call rate of 98.8% were identified by genotyping the 37 watermelon genotypes using the DArTseq platform. To make the subsequent analysis more reliable, SNP markers with a missing proportion of >5% were excluded and a total of 3882 SNP markers were used for further analysis. The physical position along the chromosome of SNP markers was determined based on the results of the alignment to the reference watermelon genome of 97 103 (minimum base identity >90% and E< 10− 5; Guo et al., Reference Guo, Zhang, Sun, Salse, Lucas, Zhang, Zheng, Mao, Ren, Wang, Min, Guo, Murat, Ham, Zhang, Gao, Huang, Xu, Zhong, Bombarely, Mueller, Zhao, He, Zhang, Zhang, Huang, Tan, Pang, Lin, Hu, Kuang, Ni, Wang, Liu, Kou, Hou, Zou, Jiang, Gong, Klee, Schoof, Huang, Hu, Dong, Liang, Wang, Wu, Xia, Zhao, Zheng, Xing, Liang, Huang, Lv, Wang, Yin, Yi, Li, Wu, Levi, Zhang, Giovannoni, Wang, Li, Fei and Xu2013). The number of SNP markers was not evenly distributed across the 11 chromosomes and it ranged from 204 for chromosome 04 to 478 for chromosome 05, with an average number of 352 (Supplementary Fig. S1, available online).
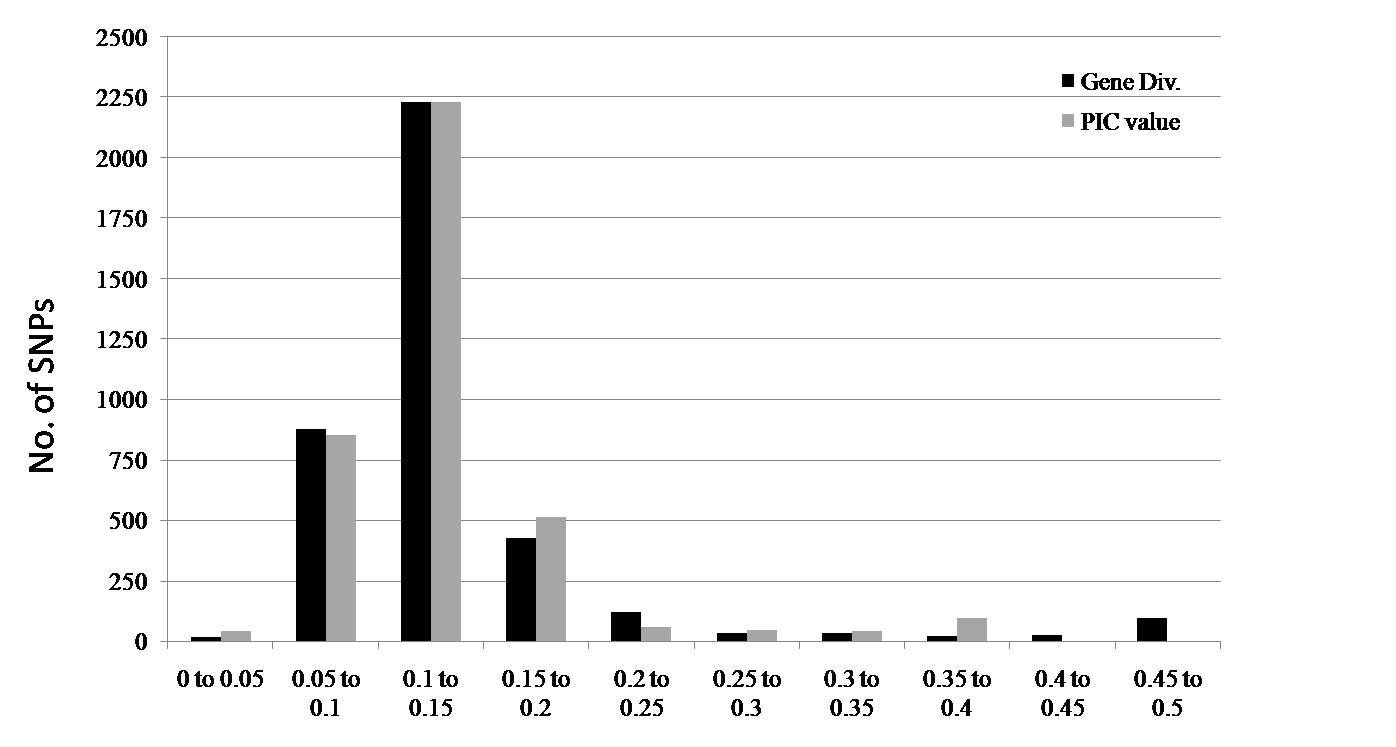
Based on the SNP genotyping data of the 37 watermelon genotypes screened, gene diversity and polymorphism information content values across chromosomes ranged from 0.03 to 0.5 and from 0.02 to 0.38, respectively (Supplementary Fig. S2, available online). The mean gene diversity and PIC values were 0.14 and 0.13, respectively, and their distributions showed that 91% (for gene diversity) and 93% (for PIC value) of the markers were in the range of 0.05–0.2 (Supplementary Fig. S2, available online).
Genetic diversity analysis
A NJ dendrogram of the 37 watermelon genotypes based on Jaccard's similarity matrix data obtained using the 3882 SNP markers is shown in Fig. 1. The NJ dendrogram broadly separated two wild genotypes from the 35 cultivated genotypes (Fig. 1(a)). To visualize the genetic relationships among the 35 cultivated genotypes more clearly, a new dendrogram was generated by excluding the two wild genotypes, and the results showed that the SNP markers were able to detect a high variability among the 35 watermelon cultivars (Fig. 1(b)). In this dendrogram, the 35 cultivars were classified into three clusters. Cluster I contained 11 genotypes in total and all of the 11 genotypes were either elite cultivars from the USA or breeding lines with known US racial background. Cluster II consisted of 20 genotypes, of which two were from the USA, one were from Korea, two were from Australia, two were from Japan, one was from Taiwan and 12 were from China (three were from Xinjiang, six were from Jiangsu and three were from Beijing). The third main group was formed by three breeding lines from Jiangsu and one breeding line from Taiwan.

Fig. 1 NJ dendrogram showing the genetic relationships among (a) 37 and (b) 35 watermelon cultivars based on 3882 SNP markers.
Principal coordinate analysis
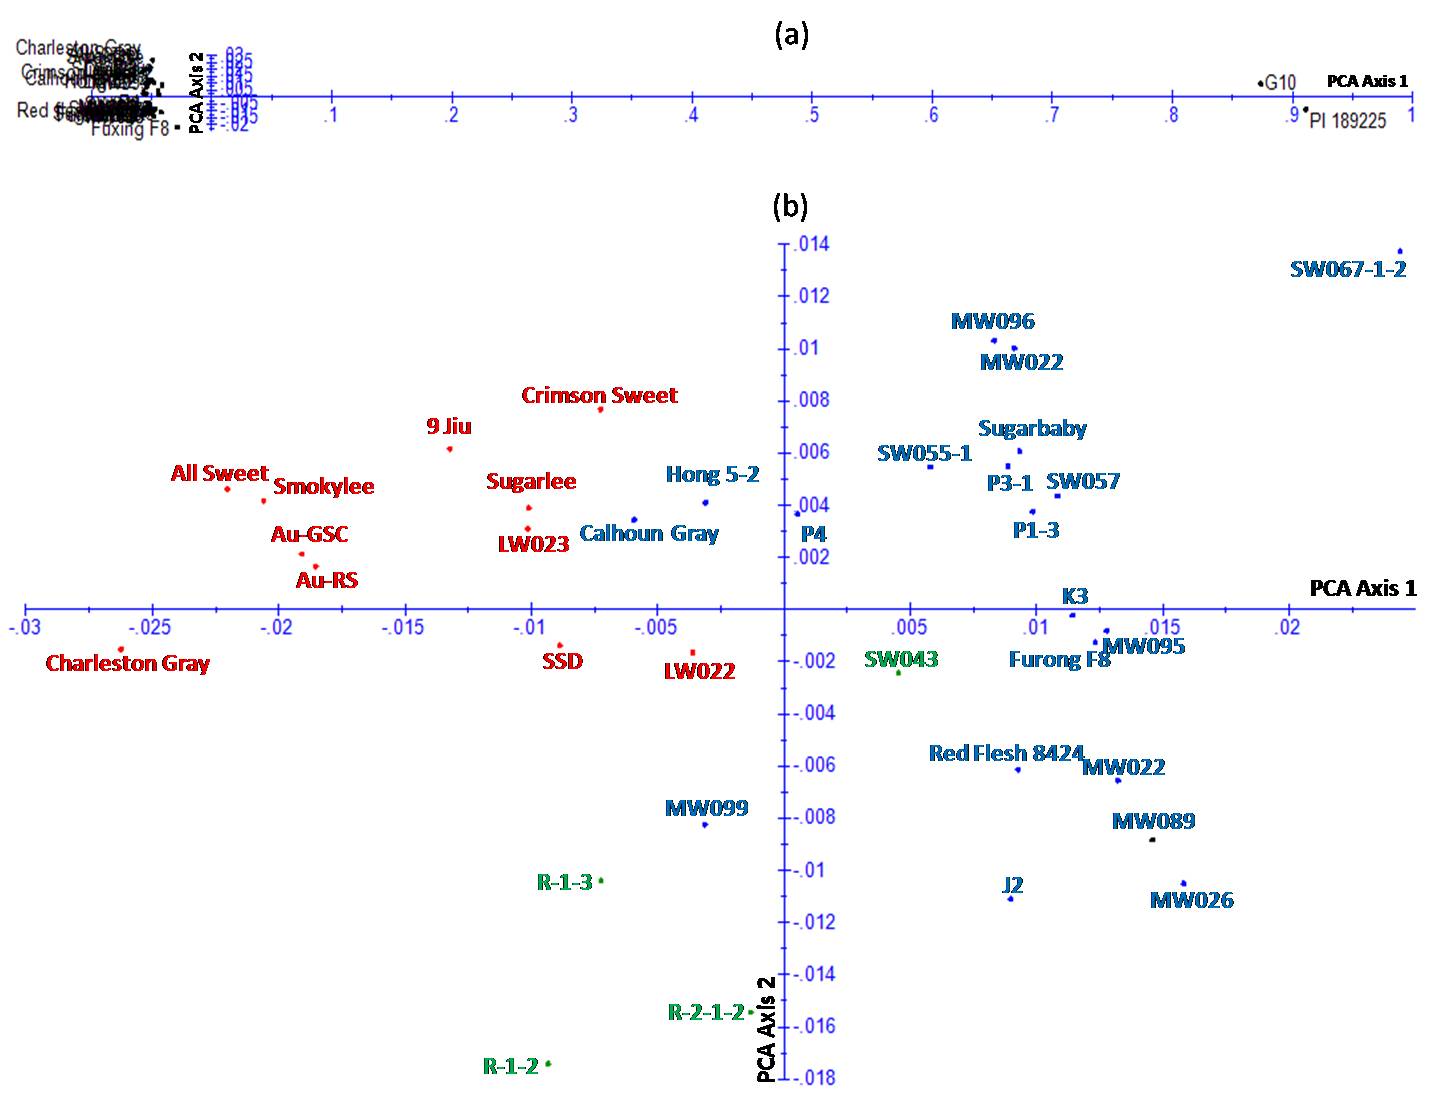
Jaccard's similarity matrix generated from marker scores was also used for PCoA to visualize the genetic relationships between the watermelon genotypes, and the results showed that the 37 genotypes were clearly classified into two groups. Group I included only two wild genotypes and group II included only cultivated genotypes (Supplementary Fig. S3(a), available online). The 35 cultivated genotypes assigned to group II were further arranged in three separate clusters (Supplementary Fig. S3(b), available online), which was generally consistent with the NJ analysis described above. The first and the second principal axis explained 25.9 and 11.2% of the variation, respectively.
Population structure analysis
For all the 37 genotypes, the sharp division of the LnP(D) score and the peak value of the ΔK score were both obtained at K= 2 (Figs 2 and (b) and 4). This means that the 37 genotypes were partitioned into two groups, which corresponded to the two wild genotypes and the 35 cultivated genotypes. When the 35 genotypes were examined, the LnP(D) score increased continuously with the increase in the K value from 1 to 8, but the most apparent change appeared when the K value increased from 2 to 3 (Fig. 3(a)). ΔK also peaked at a K value of 3 (Fig. 3(b)). These results indicate that the 35 genotypes should be divided into three populations. The results obtained from the STRUCTURE analysis were in good agreement with those obtained from the NJ dendrogram and the PCoA. Each genotype was represented by a vertical column and different colours represented different subpopulations. The proportion of a given genotype's colour bar represented the proportion of that genotype belonging to the corresponding subpopulation (Fig. 4(b)).

Fig. 2 Determination of the optimal value of K, based on five independent runs and K ranging from 1 to 8, based on 37 watermelon genotypes. (a) Evolution of the natural logarithm probability (LnP(D)) and (b) its derived statistics ΔK for each K value.
Fig. 3 Determination of the optimal value of K, based on five independent runs and K ranging from 1 to 8, based on 35 watermelon genotypes. (a) Evolution of the natural logarithm probability (LnP(D)) and (b) its derived statistics ΔK for each K value.

Fig. 4 Population structure of the genotypes based on 3882 SNP markers. (a) Optimal population structure (K= 2) for the 37 watermelon genotypes and (b) optimal population structure (K= 3) for the 35 watermelon genotypes. Each individual is represented by a narrow vertical bar, which is partitioned into coloured segments in proportion to the estimated membership in the three populations.
Discussion
Polymorphism of SNP markers
A total of 3882 SNP markers were used in the present study to provide a detailed molecular characterization of core watermelon genotypes. The distribution of markers on the 11 chromosomes varied greatly and their distribution was also reflective of chromosome size in watermelon (Guo et al., Reference Guo, Zhang, Sun, Salse, Lucas, Zhang, Zheng, Mao, Ren, Wang, Min, Guo, Murat, Ham, Zhang, Gao, Huang, Xu, Zhong, Bombarely, Mueller, Zhao, He, Zhang, Zhang, Huang, Tan, Pang, Lin, Hu, Kuang, Ni, Wang, Liu, Kou, Hou, Zou, Jiang, Gong, Klee, Schoof, Huang, Hu, Dong, Liang, Wang, Wu, Xia, Zhao, Zheng, Xing, Liang, Huang, Lv, Wang, Yin, Yi, Li, Wu, Levi, Zhang, Giovannoni, Wang, Li, Fei and Xu2013).
PIC refers to the usefulness of a marker for detecting polymorphism. Due to the bi-allelic nature of SNP markers, PIC values ranged from 0 to 0.5, which were lower than the PIC values for multi-allelic markers, such as SSR, AFLP and RAPD, that ranged from 0.5 to 1.0. Although with a low average PIC value (0.13), the SNP markers used in the present study have a greater abundance and co-dominant inheritance pattern, increasing their effectiveness in discriminating the genotypes compared with RAPD, SSR and AFLP markers used in previous watermelon genetic diversity studies.
Genetic diversity of wild and cultivated germplasm
Selection of genetically diverse parents with high genetic variability is a key step in hybridization programmes. In the present study, the genetic relationship based on three different approaches (NJ dendrogram, PCoA and population structure analysis) gave similar results. The 37 watermelon genotypes screened in the present study can be classified into two differentiated clusters: wild genotypes and cultivated genotypes. A similar distinct clustering pattern of wild and cultivated watermelon genotypes has also been reported by Hwang et al. (Reference Hwang, Jumsoon, Byeonggu, Kwanghwan and Younghoon2011), who clustered 32 watermelon genotypes into two major clusters based on AFLP and EST-SSR markers. Cluster I included all adapted watermelon cultivars and cluster II included four wild-type species (PI 189225, PI 386024, PI 494817 and PI 632755). These wild-type PIs are known to exhibit high levels of resistance against various diseases; for example, PI 189225, PI 632755 and PI 386024 have been reported to be resistant to powdery mildew (Podosphaera xanthii race 2W; Tetteh et al., Reference Tetteh, Wehner and Davis2010), while PI 494817 is moderately resistant to bacterial fruit blotch (Acidovorax citrulli), a significant threat to watermelon around the world (Hopkins and Thompson, Reference Hopkins and Thompson2002). Using molecular marker-based introgression, breeders can develop new cultivated varieties with superior disease resistance from the wild-type germplasm described above. Gichimu et al. (Reference Gichimu, Owuor, Mwai and Dida2009) also reported high morphological diversity between unimproved accessions (wild accession and landrace) and commercial cultivars.
The narrow genetic base of cultivated watermelon (Levi et al., Reference Levi, Thomas, Keinath and Wehner2001a, Reference Levi, Thomas, Wehner and Zhangb) poses a challenge for watermelon breeding programmes combining specific quality characteristics, such as high fruit and sugar yield, and pest and disease resistance. Thus, the exploitation of wild watermelon genotypes as a genetic source to improve resistance and tolerance to biotic and abiotic stresses is essential for the development of new varieties (Thies and Levi, Reference Thies and Levi2007). Indeed, the wild watermelon genotype PI 189225 included in our studies is a known source of resistance to various diseases such as powdery mildew (Tetteh et al., Reference Tetteh, Wehner and Davis2010, Reference Tetteh, Wehner and Davis2013), anthracnose (Boyhan et al., Reference Boyhan, Norton, Abrahams and Wen1994) and gummy stem blight (Gusmini et al., Reference Gusmini, Song and Wehner2005). ‘G10’ is another wild watermelon genotype that is characterized by its good resistance to Fusarium wilt (Ren et al. unpublished data). The wide differences observed between the wild and cultivated genotypes can provide valuable information for the utilization of wild watermelon in improving disease resistance by interspecific backcross between the wild germplasm and cultivated breeding lines (Levi et al., Reference Levi, Wechter, Harris, Davis and Fei2010). The identification and the use of the molecular markers linked to resistance genes in the wild-type germplasm will speed up the introgression of desirable traits into new varieties.
Cluster I of cultivated germplasm
Cluster analysis revealed the presence of genetic diversity according to origin and evidence of relationships between genotypes from different origins. For example, cluster I was constituted mainly by cultivars from the USA and cluster II was constituted mainly by cultivars from East Asia or Austria.
Cultivars with moderate fruit characteristics but good resistance to Fusarium wilt, such as ‘All Sweet’, ‘Charleston Gray’, ‘Smokylee’, ‘Sugarlee’ and ‘Crimson Sweet’, were differentiated in cluster I. In addition to the good fruit quality, they can all be used to derive lines with resistance to Fusarium wilt. ‘LW022’and ‘LW023’ are two advanced breeding lines that were bred and selected from US cultivars. ‘9 Jiu’ has good resistance to Fusarium wilt, and this characteristic should make it an excellent parent in hybrid crosses, especially for producing unprotected cultivars. ‘SSD’ is a large icebox variety with an attractive striped rind pattern, good internal red pigmentation and higher soluble sugar content than other icebox varieties. SSD could be crossed with a small parent to produce an icebox-sized fruit or with a large-fruited breeding line to produce a standard-sized fruit (Crall et al., Reference Crall, Elmstrom and McCuistion1994). ‘AU-GSC’ and ‘AU-RS’ both have multiple-disease resistance (resistance to anthracnose, gummy stem blight and Fusarium wilt), and they can be used as resistant materials for developing or enhancing disease resistance in watermelon cultivars.
Cluster II of cultivated germplasm
Among the cultivars in cluster II, ‘P1-3’and ‘P3-1’ are two inbred lines with dark skin, good quality and early maturity, and they can be used to synthesize hybrids with small fruits under the protected green house condition. The two inbred lines ‘SW055-1’ and ‘SW057’, with high soluble sugar content, can be used for the development of hybrids with good fruit quality. The inbred line ‘P4’ has considerable yield advantage over other watermelon plants; thus, it should be useful in breeding programmes aiming to develop good fruit quality, resistance and high fruit yield cultivars. ‘Red flesh 8424’ has a solid dark green rind and red flesh, and was used as the maternal parent to produce the most popular commercial cultivar ‘8424’ in East China. ‘K3’ is elongate with sweet, flavourful red flesh and thick rind. Many breeders have made use of ‘K3’ as a source of good fruit quality for the development of new hybrids. In previous studies, we selected some breeding lines, including ‘MW022’, ‘J2’, ‘P4’, ‘Hong 5-2’, ‘SW055-1’, ‘MW097’, ‘MW099’, ‘MW095’, ‘MW096’, ‘Furong F8’, ‘MW026’ and ‘MW089’, with excellent fruit quality. However, they were much less resistant to diseases. Thus, these breeding lines with different fruit and plant characteristics were selected in order to synthesize hybrids with a range of fruit and plant patterns to attend to the farmers' and consumers' preferences. Particularly, cultivars ‘Sugarbaby’ and ‘Calhoun Gray’ were apart from other US cultivars and were grouped into cluster II. This could be ascribed to the more frequent use of these two elite cultivars for watermelon breeding programmes, resulting in close genetic relationships with cultivars from East Asia.
Cluster III of cultivated germplasm
Interestingly, three advanced breeding lines (‘R-1-3’, ‘R-1-2’ and ‘R-2-1-2’) from Jiangsu Province and one advanced breeding line (‘SW043’) from Taiwan were located in an independent cluster (cluster III), suggesting a unique genetic background to other cultivated genotypes. ‘R-1-3’, ‘R-1-2’, ‘R-2-1-2’ and ‘SW043’ were the four advanced breeding lines with the same yellow colour of fruit flesh. The colour of fruit flesh has been shown to be an important indicator of genetic relationships among watermelon genotypes, and most wild watermelon genotypes have white, light green or yellow flesh while most cultivated genotypes have red flesh (Wang et al., Reference Wang, Behera and Kole2011). Thus, this genetic clustering reflected that the colour of fruit flesh may be one of the main causes for this clustering, but other influencing causes for this clustering need to be investigated further.
In conclusion, this study using DArTseq-based SNP markers revealed the relationships and genetic diversity among 37 core watermelon genotypes. The new information will be useful to breeders to maximize the parental diversity for new crosses within breeding programmes and development of varieties with improved resistance to abiotic and biotic stresses.
Conclusions
In this study, we used 3882 SNP markers to evaluate the genetic diversity and population structure of watermelon genotypes, and our results showed that apart from distinct grouping of wild genotypes from cultivated watermelon genotypes, there are also three main groups in the 35 cultivated genotypes. The grouping of genotypes based on the large number of SNP markers will also be useful in providing a theoretical foundation for effectively utilizing these genotypes in future watermelon breeding programmes.
Supplementary material
To view supplementary material for this article, please visit http://dx.doi.org/10.1017/S1479262115000659
Acknowledgements
This research was supported by grants from the Ministry of Science and Technology (2012BAD02B03-14), the Jiangsu Provincial Major Support Program for Agricultural (BE2012323), the China Postdoctoral Science Foundation (2013M541624) and the Jiangsu Province Postdoctoral Science Foundation (1301068B). The authors would also like to acknowledge the Jiangsu Academy of Agricultural Sciences, China and the University of Nottingham, UK for funding.
The authors declare that they have no conflict of interest.