


INTRODUCTION
Executive dysfunction is one of the most prominent cognitive symptoms associated with cerebral small vessel disease (SVD), a prevalent condition in the aging population that is known to contribute to the development of cognitive impairment and dementia (Debette & Markus, Reference Debette and Markus2010; Desmond, Reference Desmond2004; Kloppenborg, Nederkoorn, Geerlings, & van den Berg, Reference Kloppenborg, Nederkoorn, Geerlings and van den Berg2014). Magnetic resonance imaging (MRI) plays a central role in the clinical investigation of SVD (Pantoni, Reference Pantoni2010). However, advanced MRI is resource-consuming and not always readily available in clinical settings. Valid and sensitive measures of executive function could allow efficiently monitoring symptom onset, disease progression, and treatment efficacy in patients with SVD.
The Institute of Cognitive Neurology (INECO) Frontal Screening (IFS) is a well-validated neuropsychological screening instrument allowing the rapid assessment of executive functioning in Spanish-speaking subjects (Torralva, Roca, Gleichgerrcht, Lopez, & Manes, Reference Torralva, Roca, Gleichgerrcht, Lopez and Manes2009). This screening task was developed in Spanish, at the INECO (Buenos Aires, Argentina). It consists of eight subtests capturing three larger domains of executive function: (1) Response Inhibition and Set Shifting (RISS) (i.e., the ability to shift attention from one task to another and to stop an action in response to environmental cues), (2) Abstraction (i.e., the ability for conceptual thinking), and (3) Working Memory (WM) (i.e., the ability to hold and manipulate information mentally). The administration time of this screening tool is approximately 10 min, making it particularly relevant in clinical settings and in patients presenting with more severe forms of cognitive impairment.
The IFS has received substantial empirical support. This brief screening test has been used in many different clinical populations, and across different Spanish-speaking countries, including Argentina (Baez et al., Reference Baez, Pinasco, Roca, Ferrari, Couto, García-Cordero and Matallana2017), Peru (Custodio et al., Reference Custodio, Herrera-Perez, Lira, Roca, Manes, Báez and Torralva2016), Chile (Jory, Bruna, Muñoz-Neira, & Chonchol, Reference Jory, Bruna, Muñoz-Neira and Chonchol2013), and Colombia (Romero-Vanegas, Vargas-Gonzalez, Arboleda, Lopera, & Pardo, Reference Romero-Vanegas, Vargas-Gonzalez, Arboleda, Lopera and Pardo2014). Performance on the IFS correlates highly with standard tests of executive function, including the Wisconsin Card Sorting Test and the Trail Making Test (TMT) B (Torralva et al., Reference Torralva, Roca, Gleichgerrcht, Lopez and Manes2009). Further, performance on the IFS is sensitive and specific to the presence of executive dysfunction in various neurodegenerative diseases. Previous studies have demonstrated that patients diagnosed with behavioral variant of Frontotemporal Dementia, a condition linked to neurodegeneration in frontal and temporal areas and severe deficits in executive function, presented more severe impairments on the IFS than patients with Alzheimer’s disease (AD) and healthy controls (Bahia et al., Reference Bahia, Cecchini, Cassimiro, Viana, Lima-Silva, de Souza and Balthazar2018; Custodio et al., Reference Custodio, Herrera-Perez, Lira, Roca, Manes, Báez and Torralva2016; Gleichgerrcht, Roca, Manes, & Torralva, Reference Gleichgerrcht, Roca, Manes and Torralva2011; Moreira, Costa, Castro, Lima, & Vicente, Reference Moreira, Costa, Castro, Lima and Vicente2017). Using a cutoff score of 19.75, the IFS presented a sensitivity of 0.80 and a specificity of 0.63 in discriminating healthy controls from subjects with dementia (Bahia et al., Reference Bahia, Cecchini, Cassimiro, Viana, Lima-Silva, de Souza and Balthazar2018). Other studies have corroborated the adequate sensitivity and specificity of the IFS in distinguishing controls subjects from subjects with neurocognitive disorders (Custodio et al., Reference Custodio, Herrera-Perez, Lira, Roca, Manes, Báez and Torralva2016; Gleichgerrcht et al., Reference Gleichgerrcht, Roca, Manes and Torralva2011). Evidence further suggests that the IFS outperforms similar screening tool of executive dysfunction, namely the Frontal Assessment Battery, in differentiating normal controls from subjects with neurocognitive disorders (Custodio et al., Reference Custodio, Herrera-Perez, Lira, Roca, Manes, Báez and Torralva2016; Gleichgerrcht et al., Reference Gleichgerrcht, Roca, Manes and Torralva2011). In addition to age-related neurocognitive disorders, deficits on the IFS have been observed in various psychiatric conditions associated with executive dysfunction, including major depression, attention deficit and hyperactivity disorder, schizophrenia and bipolar disorder (Baez et al., Reference Baez, Ibanez, Gleichgerrcht, Perez, Roca, Manes and Torralva2014; Reyes et al., Reference Reyes, Viswanathan, Godin, Dufouil, Benisty, Hernandez and Czernecki2009; Silva, Monteiro, & Lopes, Reference Silva, Monteiro and Lopes2014). Taken together, these results support the validity of the IFS in detecting executive function deficits in a wide range of clinical populations. However, the effectiveness of this screening test in detecting and assessing executive deficits associated with SVD remains unknown.
Cerebral autosomal dominant arteriopathy with subcortical infarcts and leukoencephalopathy (CADASIL) is a hereditary form of SVD caused by mutations in the NOTCH3 gene (Chabriat, Joutel, Dichgans, Tournier-Lasserve, & Bousser, Reference Chabriat, Joutel, Dichgans, Tournier-Lasserve and Bousser2009; Joutel et al., Reference Joutel, Corpechot, Ducros, Vahedi, Chabriat, Mouton and Maréchal1996). It is the most common inherited cause of vascular dementia. Individuals with CADASIL develop SVD and vascular-related cognitive impairments at an early age of onset (Chabriat et al., Reference Chabriat, Joutel, Dichgans, Tournier-Lasserve and Bousser2009). Other common symptoms of the disease include recurrent strokes, migraines with aura, and mood disturbances (e.g., apathy and depression). This unique clinical population allows investigating the effects of SVD in the absence of confounding factors typically associated with older age (Chabriat et al., Reference Chabriat, Joutel, Dichgans, Tournier-Lasserve and Bousser2009; Desmond et al., Reference Desmond, Moroney, Lynch, Chan, Chin and Mohr1999).
The objective of this study was twofold. First, we aimed to characterize performance on the IFS in subjects with CADASIL, a hereditary SVD, as opposed to nonaffected family members. Secondly, we examined associations between performance on the IFS and MRI markers of SVD. Results from this study will provide unique insights into the usefulness of the IFS as a screening measure of executive dysfunction in the context of SVD.
METHODS
Participants
This cross-sectional study included 47 nondemented members of Colombian families with NOTCH3 mutations for CADASIL (24 carriers and 23 noncarriers).
For this present study, potential participants from families with confirmed CADASIL mutations were identified on the Sistema de Información del Grupo de Neurociencias de Antioquia (SISNE) database, a large patient registry from the Neuroscience Group of the University of Antioquia Research Center (La Sede de Investigación Universitaria [SIU]), using a random sampling approach. Participants included in this study were selected based on predetermined inclusion/exclusion criteria, following a complete medical and neurological evaluation.
The inclusion/exclusion criteria were age over 18 years (no upper limit), absence of neurological illnesses other than CADASIL, absence of history of psychiatric illness, absence of noncontrolled systemic disease, absence of illiteracy preventing the administration of a complete neuropsychological evaluation, absence of current use of medication/substance affecting metabolism and/or neurocognitive functioning, absence of major neurocognitive disorder (i.e. dementia), absence of history of ischemic or hemorrhagic strokes, and absence of contra-indications for MRI. Recruited subjects were considered “asymptomatic” because of the absence of strokes history and of dementia. All recruited subjects completed a neuropsychological evaluation and an MRI scan. This study was performed following a double-blind design, and neither participants nor investigators involved in data collection were aware of participants’ genetic status. Following data collection, subjects were classified as carriers or noncarriers based on results from genetic testing (DNA extraction with Gentra Puregene Blood Kit, QIAGEN, Hilden, Germany).
Clinical Evaluation
All participants underwent a complete medical and neurological evaluation. The absence of dementia was established based on neurological examination, and confirmed with scores on the Functional Assessment Staging and Global Deterioration Scale ranging from 1 to 2 (Auer & Reisberg, Reference Auer and Reisberg1997). The level of depressive symptoms was assessed using the Geriatric Depression Scale – short form (GDS-sf; Yesavage & Sheikh, Reference Yesavage and Sheikh1986). Conventional cardiovascular risk factors [body mass index (BMI), systolic/diastolic blood pressure hypercholesterolemia, diabetes, and tobacco use] were assessed during the medical evaluation using standard biometric procedures and questionnaires. The BMI and blood pressure measurements were treated as continuous variables, while hypercholesterolemia, diabetes, and use of tobacco were treated as dichotomous variables (absence vs. presence at the time of evaluation). Socioeconomic status (SES) was established using the current place of residence and census data for Antioquia, using an ordinal scale ranging from 1 (lowest SES) to 6 (highest SES) (DANE, 2020).
Neuropsychological Evaluation
All participants completed a standard battery of neuropsychological tests at the University of Antioquia. The neuropsychological evaluation was administered by a licensed neuropsychologist (YZ) and included the following tests validated in Spanish: Mini-Mental State Examination (MMSE), Colombian version of the Consortium to Establish a Registry for Alzheimer Disease (CERAD; Verbal Fluency, Modified Boston Naming Test, Word List Test, Constructional Praxis Test Copy and Recall) (Aguirre-Acevedo et al., Reference Aguirre-Acevedo, Gomez, Moreno, Henao-Arboleda, Motta, Muñoz and Lopera2007; Welsh et al., Reference Welsh, Butters, Mohs, Beekly, Edland, Fillenbaum and Heyman1994), Raven Progressive Matrices-short form (Arthur Jr & Day, Reference Arthur and Day1994), TMT A (Reitan, Reference Reitan1971), WAIS-III Digit Symbol Coding (Wechsler, Reference Wechsler1999), Phonemic Fluency (FAS) (Tombaugh, Kozak, & Rees, Reference Tombaugh, Kozak and Rees1999), and Wisconsin Card Sorting Test (WCST – number of perseveration errors) (Nelson, Reference Nelson1976). All tasks had previously been validated in Spanish and used in a large sample of subjects from Colombia (Arango-Lasprilla, Reference Arango-Lasprilla2015; Torres et al., Reference Torres, Vila-Castelar, Bocanegra, Baena, Guzmán-Vélez, Aguirre-Acevedo and Moreno2019). Executive functioning was further assessed with the IFS (Torralva et al., Reference Torralva, Roca, Gleichgerrcht, Lopez and Manes2009). The IFS is composed of eight subtests capturing three larger domains of executive function, as illustrated in Table 1. For all subjects, the score on each subtest, as well as the IFS Total Score, was calculated. We additionally computed Domain Scores (RISS, AC, and WM) by adding performance on individual subtests included within each domain, as described in Table 1.
Table 1. Description of subtests’ structure of the IFS

The maximum score on the INECO Frontal Screening is 30. The eight subtests can be regrouped to capture three distinct components of executive functioning (i.e., domains). For a description of each subtest, please refer to Torralva et al. (Reference Torralva, Roca, Gleichgerrcht, Lopez and Manes2009). RISS – Response Inhibition and Set Shifting Domain; AC – Abstraction Domain; WM – Working Memory Domain.
MRI Acquisition
MRI scans were performed on a 3-Tesla Siemens scanner at the Pablo Tobón Uribe Hospital (Medellín, Colombia). The following sequences were acquired in all subjects to allow quantification of structural MRI markers of SVD: Magnetization Prepared Rapid Gradient Echo (MPRAGE) (repetition time [TR]/echo time [TE]: 2000/2.45 ms; resolution: 0.96 ×0.96 × 0.96), Susceptibility weighted imaging (SWI) (TR/TE: 27/20 ms, resolution: 0.76 × 0.76 × 1.8), T2 Turbo Spin Echo (TSE) (TR/TE: 4700/94 ms; resolution: 0.36 × 0.36 × 3.3), and Fluid Attenuation Inversion Recovery (FLAIR) (TR/TE: 8000/81 ms; resolution: 0.68 × 0.68 × 5.0).
Quantification of MRI Markers of SVD
MRI markers of SVD were identified and quantified in accordance with guidelines provided by an expert consensus report, the Standards for Reporting Vascular Changes on Neuroimaging (STRIVE) recommendations (Wardlaw et al., Reference Wardlaw, Smith, Biessels, Cordonnier, Fazekas, Frayne and Benavente2013).
White matter hyperintensity
The volume of white matter hyperintensity (WMH) (Figure 1A) was automatically segmented on FLAIR images using a previously described automated algorithm (Schirmer, Dalca, et al., Reference Schirmer, Dalca, Sridharan, Giese, Donahue, Nardin and Wasselius2019). In brief, images first undergo brain extraction, intensity normalization, and affine registration to a template space, which enables the use of spatial priors (Schirmer, Giese, et al., Reference Schirmer, Giese, Fotiadis, Etherton, Cloonan, Viswanathan and Rost2019). Relying on a deep learning u-net-like architecture for clinical grade input data, the algorithm then automatically identifies WMH, while excluding imaging ‘artifacts’ derived from any acute ischemic lesions. Following automated segmentation, the obtained WMH masks were visually inspected and, if needed, manually corrected. The WMH volume was finally computed by performing a voxel count. To account for between-subjects variations in brain volume, the WMH volume was normalized to the total brain volume, as estimated with FreeSurfer version 6.0 [nWMHVol = (WMH volume/Total brain volume) × 100]. The severity of periventricular WMH was also assessed on FLAIR images using the well-validated Fazekas scale (ranging from 0 to 3) (Fazekas, Chawluk, Alavi, Hurtig, & Zimmerman, Reference Fazekas, Chawluk, Alavi, Hurtig and Zimmerman1987).
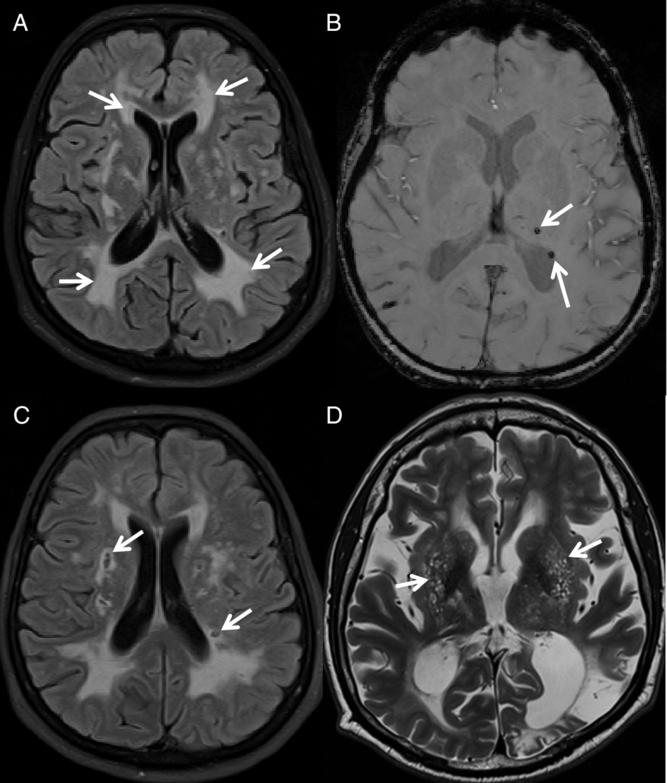
Fig. 1. Illustration of MRI markers of SVD in CADASIL. MRI markers of SVD in CADASIL subjects: (A) FLAIR image with severe WMH; (B) SWI image showing the presence of CMBs, (C) FLAIR image showing the presence of lacunes, and (D) T2 TSE image showing the presence of severe perivascular spaces enlargement in the BG (EPVS-BS)
Cerebral Microbleeds
Cerebral microbleeds (CMBs) (Figure 1B) were identified on SWI images and manually counted by a trained expert in neuroimaging, according to published guidelines (Greenberg et al., Reference Greenberg, Vernooij, Cordonnier, Viswanathan, Salman and Warach2009). To assess reliability, CMBs were counted twice by the same rater. Test–retest reliability was estimated using intraclass correlation coefficient (ICC), which confirmed a high consistency in the counts of CMBs (ICC = 0.96, p < 0.001).
Lacunes
Lacunes of presumed vascular origin (Figure 1C) were identified on FLAIR images as ovaloid areas of signal hypointensity (signal similar to that of cerebrospinal fluid [CSF]). The total volume of lacunes was calculated by manually segmenting identified lacunar areas of signal hypointensity and performing a voxel count. To assess reliability, lacunes were segmented twice by the same rater. Test–retest reliability was assessed using ICC, which demonstrated a high consistency in the volumetric assessment of lacunes (ICC = 0.92, p < 0.001). For each subject, the total volume of lacunes was normalized to the total brain volume, as estimated with FreeSurfer version 6.0 [nLacuneVol = (Total lacune volume/Total brain volume) × 1000].
Enlarged Perivascular Spaces
Enlarged perivascular spaces (EPVS – Figure 1D) were identified on T2 TSE images as small round foci or linear bands of signal hyperintensity, following a previously described protocol (Potter, Morris, & Wardlaw, Reference Potter, Morris and Wardlaw2015). EPVS were coded in the most severely affected hemisphere and separately for the centrum semiovale (CS) (EPVS-CS) and basal ganglia (BG) (EPVS-BG), using a four-point Likert-like scale (0 representing the absence of EPVS to 4 representing the presence of more than 40 EPVS). To assess reliability, EPVS were rated twice in each subject. Test–retest reliability was assessed using ICC, which demonstrated a high consistency in the assessment of EPVS in both the CS (EPVS-CS ICC = 0.90, p < 0.001) and the BG (EPVS-BG ICC = 0.92, p < 0.001).
Brain Parenchymal Fraction
To obtain an estimation of global brain atrophy, the brain parenchymal fraction (BPF) was estimated by computing the ratio of total brain volume on the total intracranial volume [BPF = (Total brain volume/Total intracranial volume) × 100]. Both volumetric measures were obtained automatically using MPRAGE images and the FreeSurfer version 6.0 structural pipeline.
Computation of an SVD Sum Score
In a similar method as previously described (Staals et al., Reference Staals, Booth, Morris, Bastin, Gow, Corley and Wardlaw2015), we calculated an SVD Sum Score representing the overall severity of MRI markers of SVD. Evidence suggests that such score allows quantifying the overall “SVD state” (Staals et al., Reference Staals, Booth, Morris, Bastin, Gow, Corley and Wardlaw2015; Yilmaz, Ikram, Niessen, Ikram, & Vernooij, Reference Yilmaz, Ikram, Niessen, Ikram and Vernooij2018). The SVD Sum Score was calculated as follows: (1) one point was awarded for the presence of 1 or more CMBs; (2) one point was awarded for the presence of 1 or more lacunes; (3) one point was awarded in the presence of large and irregular areas of WMH in the periventricular region extending into the deep white matter (i.e., Fazekas grade of 3), and (4) one point was awarded for the presence of moderate to severe EPVS in the BG (EPVS-BG ratings between 2 and 4). To summarize, the SVD Sum Score consists in an ordinal four-point scale, ranging from 0 to 4, providing an indication of the overall burden of quantified MRI markers of SVD in each subject.
Statistical Analysis
Statistical analyses were performed using SPSS Statistics version 20 (IBM, New York, United States).
Differences in demographics and clinical features between the two groups were assessed using one-way analysis of variance for continuous variables (i.e., age, education, GDS-sf, systolic/diastolic blood pressure, and BMI), Mann–Whitney U-test for ordinal variables (i.e., SES), and chi-square tests for dichotomous variables (i.e., sex, diabetes, tobacco use, and hypercholesterolemia). Differences in cognitive performance were assessed with univariate general linear model (GLM) analyses, with group as a fixed factor, and age and education as covariates.
Group differences on the IFS subtests and associations with neuropsychological measures of executive function
Associations between performance on standard neuropsychological tests of executive function (i.e., Phonemic Fluency and Wisconsin Card Sorting Test Perseveration Errors) and performance on the IFS (Total Score and Domain Scores) were assessed in the full sample using Pearson correlations.
Performance across the three Domain Scores (RISS, AC, and WM) of the IFS was compared between CADASIL and noncarriers using GLM analyses, with group as a fixed factor, and age and education as covariates. For this analysis, we adjusted the threshold for significance to p < 0.01 to account for the three comparisons, as per the Bonferroni correction. Performance on the eight subtests of the IFS was also contrasted between groups in a similar GLM analysis. For the latter analysis, we adjusted the threshold for significance to p < 0.006, to account for the eight comparisons.
Group differences on MRI markers of SVD
The distribution of SVD markers across subjects was first evaluated using the Shapiro–Wilk test. Because the nWMHVol, the number of CMBs, and the nLacuneVol were not normally distributed, they were log-transformed for the purpose of group difference analyses. Group differences in log-nWMHVol, log-CMBs, log-nLacuneVol, and BPF were assessed using a multivariate GLM analysis, with group as a fixed factor, and age as a covariate. Group differences in the SVD Sum Score as well as in ratings of perivascular spaces enlargement in the CS (EPVS-CS) and BG (EPVS-BG) were assessed using a Mann–Whitney U-test.
Associations between MRI markers of SVD and performance on the IFS
Spearman’s rank correlations were computed between quantified MRI markers of SVD (nWMHVol, CMBs, nLacuneVol, EPVS-CS, EPVS-BG, and BPF), as well as the SVD Sum Score, and performance on the IFS (Subtests and Total Score). All correlations were controlled for age, in partial correlations. A multivariate linear regression model was used to assess the combined influence of all quantified MRI markers of SVD (nWMHVol, CMBs, nLacuneVol, EPVS-CS, EPVS-BG, and BPF) on the IFS Total Score, with age and education as additional covariates. A separate linear regression model was also computed to assess the influence of the SVD Sum Score on the IFS performance, again with age and education as covariates.
Receiver operating characteristic curve analysis
Finally, the sensitivity and specificity of the IFS Total Score to discriminate CADASIL subjects from noncarriers, or detect the presence of MRI markers of SVD, was assessed using receiver operating characteristic (ROC) analyses. For this purpose, quantified MRI markers of SVD were dichotomized as described in the previous subsection. In brief, the presence of one or more CMBs was assigned a “1” or, alternately, a “0” to indicate the absence of this marker. The presence of one or more lacunes was assigned a “1” or, alternately, a “0” to indicate the absence of this marker. The presence of severe WMH in the periventricular area (a Fazekas grade of 3) was assigned a “1,” and lower Fazekas grades (scores of 0 to 2) were assigned a “0.” The presence of moderate to severe EPVS in each of the CS and the BG (ratings of 2 to 4) were assigned a “1,” while lower ratings (ratings 0 or 1) were assigned a “0.”
RESULTS
Demographic, Clinical, and Cognitive Characteristics
A summary of demographic and clinical characteristics of CADASIL subjects and noncarriers is presented in Table 2. Subjects with CADASIL and noncarriers were equivalent in terms of education and sex representation. However, CADASIL subjects were, on average, younger than noncarriers. Groups did not differ in the representation of standard cardiovascular risk factors, nor in ratings of SES (p > 0.05 for all). No significant group difference was observed in the level of depressive symptoms (GDS-sf). The cognitive performance of CADASIL and noncarriers subjects is summarized in Table 3. The results of the GLM analysis, with age and education as covariates, highlighted a significantly lower performance on the MMSE (p = 0.001) for CADASIL subjects. CADASIL subjects showed a significantly reduced performance across all neuropsychological tests of executive function (p < 0.01, for all), as well as on the Constructional Praxis–Recall subtest of the CERAD (p = 0.01) and the TMT A (p < 0.01).
Table 2. Summary of demographic and clinical characteristics

Reported values are mean (standard deviation; SD) for continuous or ordinal variables, and number of cases presenting with the listed condition (n(percentage of sample); n (%)) for dichotomous variables. The “F/χ 2/U (p-value)” column presents results from group difference analyses. Differences in demographic and clinical characteristics were assessed with an analysis of variance for continuous variables, chi-square test for dichotomous variables, and Mann–Whitney U test for ordinal variables. ns – not significant as per an α level of p < 0.05.
Table 3. Summary of cognitive performance

Presented values are mean (SD). The “F (p-value)” column presents results from group difference analyses. Group differences in cognitive performance were obtained with a GLM, controlling for age and education level. Presented values are uncorrected raw scores. Unless specified in the legend, higher scores indicate a superior performance. CERAD – subtests from the Spanish version of the Consortium to Establish a Registry for Alzheimer’s Disease Neuropsychology Battery; TMT A, a higher score indicates a lower performance; WAIS-III – Wechsler Adult Intelligence Scale 3rd Edition; WCST – Wisconsin Card Sorting Test, a higher score indicates a lower performance; max. – maximum score attainable on the listed task, when available; ns – not significant as per an alpha level of p < 0.05.
Associations Between Performance on the IFS and Neuropsychological Tests of Executive Function
We found significant correlations between performance on standard neuropsychological measures of executive function (WCST Perseverations and Phonemic Fluency) and the Total Score and Domain Scores (RISS, AD, and WM) of the IFS (see Figure 2A and B).

Fig. 2. Associations between scores on the IFS and standard neuropsychological measures of executive function. Scatter plots presenting associations between the IFS Total Score and Domains Scores (RISS – Response Inhibition and Set Shifting; AC – Abstraction Domain; WM – Working Memory Domain) and (A) WCST Perseveration Errors, and (B) Phonemic Fluency (FAS) in our sample (n = 47). Results from Pearson correlations, and significance levels, are presented in the legend
Analysis of Group Differences on the IFS
Results of group difference analyses, controlling for the effects of age and education, across all scores of the IFS are summarized in Figure 3A–C. CADASIL subjects showed a significantly reduced performance on the IFS Total Score, after controlling for age and years of education (IFS Total Score; F(1,43) = 8.39, p = 0.006). When comparing performance across domain scores of the IFS, CADASIL subjects showed a significantly reduced performance on the AC (F(1,43) = 7.50, p = 0.009) and WM (F(1,43) = 7.27, p = 0.01) domains, but not on the RISS (F(1,43) = 3.09, p = 0.09). The results of group difference analyses across all individual subtests of the IFS, and after correction for multiple comparisons, revealed a significantly lower performance on the Verbal Working Memory (VWM; F(1,43) = 8.95, p = 0.005) subtest for CADASIL subjects. Group differences on the Abstraction Capacity (AC; F(1,43) = 7.50, p = 0.009), Conflicting Instructions (CI; F(1,43) = 6.00, p = 0.02), Spatial Working Memory (SWM; F(1,43) = 3.63, p = 0.06), Motor Inhibitory Control (MIC; F(1,43) = 2.90, p = 0.10), Backwards Digit Span (BDS; F(1,43) = 1.67, p > 0.05), Verbal Inhibitory Control (VIC, F(1,43) = 0.07, p > 0.05), and Motor Programming (MP; F(1,43) =0.05, p > 0.05) subtests did not reach statistical significance after accounting for multiple comparisons (corrected α level: p < 0.006).
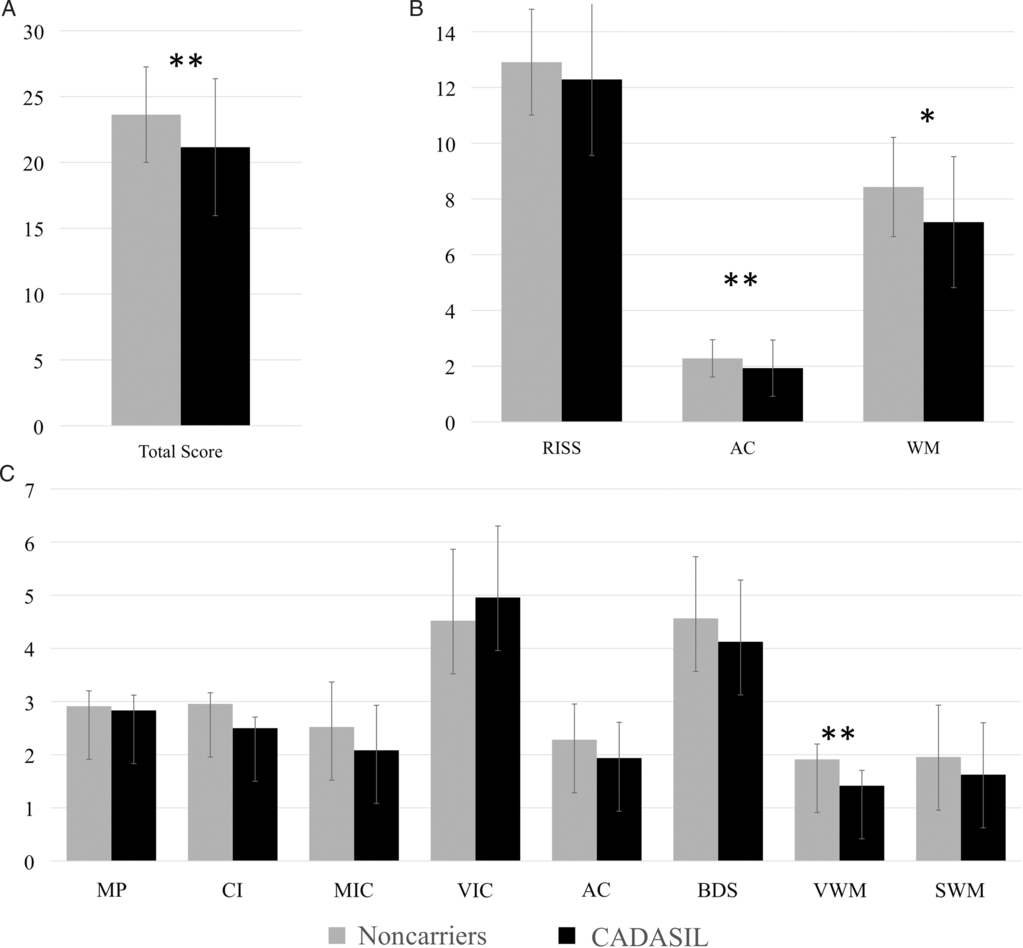
Fig. 3. Differences on the IFS between CADASIL subjects and noncarriers. Differences in performance on the IFS (A) Total Score, (B) Domains Scores, and (C) individual subtests between CADASIL subjects (n = 24) and noncarriers (n = 23). The bar height represents the mean and the error bar represents the standard deviation. A multivariate GLM analysis controlling for age and education was used to establish statistical significance of group differences. RISS – Response Inhibition and Set Shifting; VIC – Verbal Inhibitory Control; AC – Abstraction; BDS – Backwards Digit Span; VWM – Verbal Working Memory; WM – Working Memory Domain; MP – Motor Programming; CI – Conflicting instructions; MIC – Motor Inhibitory Control; SWM – Spatial Working Memory. *p < 0.05, **p < 0.01
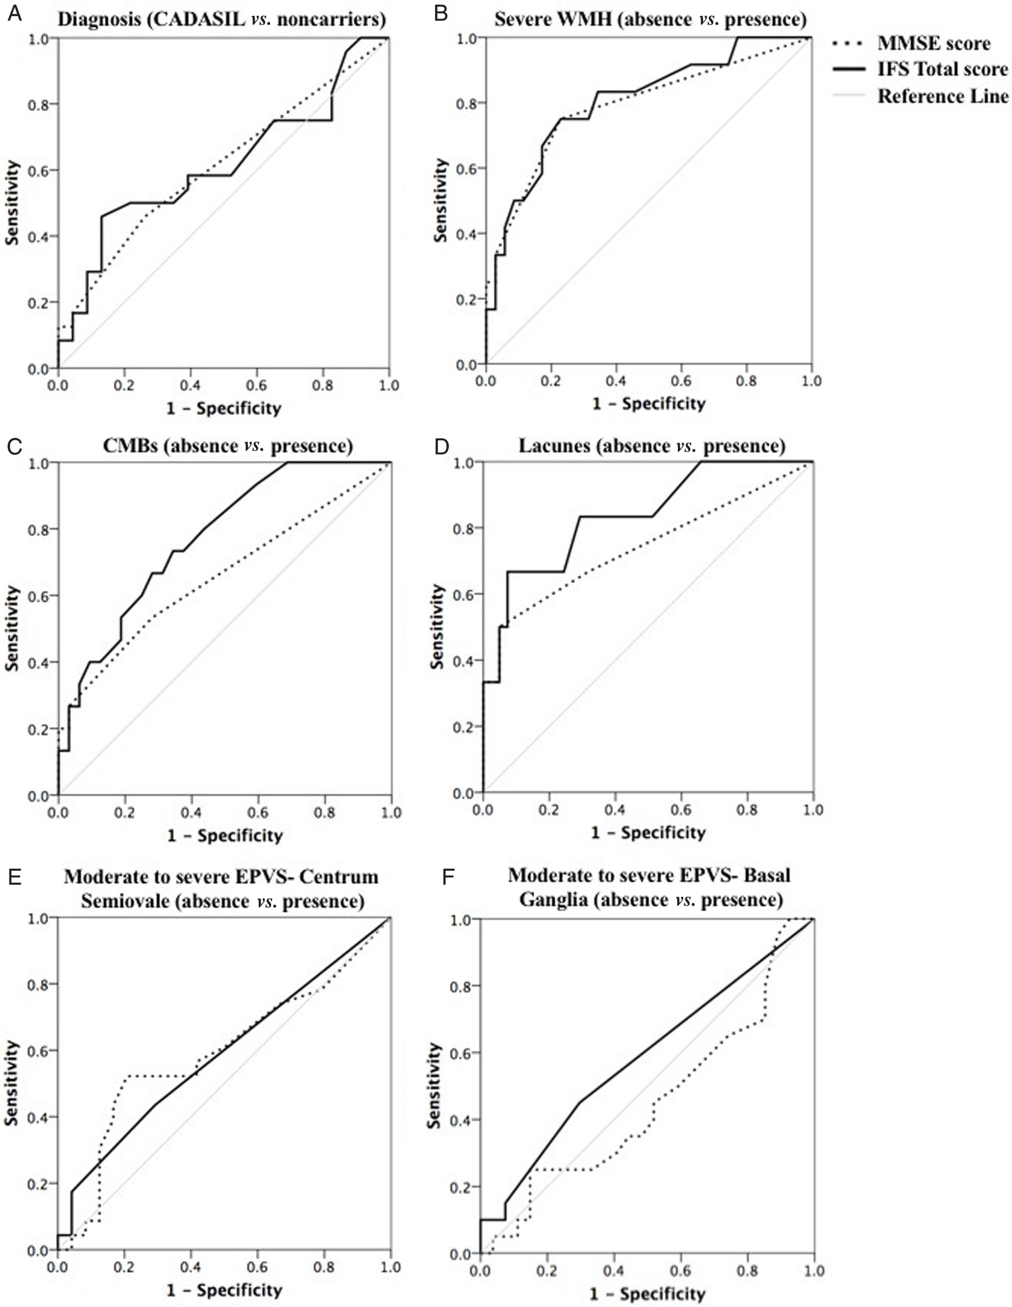
Fig. 4. Summary of ROC curve analyses. ROC curves for the MMSE (dotted line) and IFS Total Score (full line) to illustrate their ability to discriminate between: (A) CADASIL subjects (n = 24) and noncarriers (n = 23); (B) subjects presenting with or without severe white matter lesions (WMH); (C) subjects presenting with or without CMBs; (D) subjects presenting with or without lacunes; (E) subjects presenting with or without moderate to severe perivascular spaces enlargement in the CS (EPVS-CS); (F) subjects presenting with or without moderate to severe perivascular spaces enlargement in the BG (EPVS-BG). The diagonal grey line corresponds to the reference line, showing an AUC of 0.50
Associations Between IFS Performance and MRI Markers of SVD
After controlling for age, there were significant group differences in the log-nWMHVol (F(1,44) = 144.93, p < 0.001), log-CMBs (F(1,44) = 20.51, p < 0.001), and log-nLacuneVol (F(1,44) = 8.94, p = 0.005), showing an increased presence of these markers in CADASIL subjects in comparison to noncarriers. No significant group difference was found in BPF (F(1,44) = 0.27, p > 0.05). In contrast to noncarriers, CADASIL subjects presented significantly higher ratings of EPVS severity in both the CS (EPVS-CS: Mann–Whitney U = 168.00, p = 0.009) and the BG (EPVS-BG: Mann–Whitney U = 138.00, p = 0.001). Subjects with CADASIL also had significantly higher SVD Sum Score than noncarriers (Mann–Whitney U = 86.00, p < .001), indicating a globally more severe profile of MRI markers of SVD.
Results of Spearman correlation analysis controlling for age are presented in Table 4. The IFS Total Score correlated with all quantified MRI markers of SVD (p < 0.01), except for the BPF and EPVS-CS/BG (p > 0.05). Performance on the VIC subtest did not correlate with any of the quantified MRI markers of SVD (p > 0.05 for all). The EPVS-CS only showed a significant association with the BDS (p < 0.05) subtest, while the BPF and EPVS-BG did not correlate significantly with any of the IFS subtests (p > 0.05 for all).
Table 4. Results of correlation analyses examining associations between IFS performance and quantified MRI markers of SVD

Spearman’s rank correlations between performance on the IFS and MRI markers of SVD in CADASIL subjects (n = 24) and noncarriers (n = 23). All correlations were adjusted for age, in partial correlations. nWMHVol – normalized volume of white matter hyperintensity; CMBs – number of cerebral microbleeds; nLacuneVol – normalized volume of lacunes; EPVS-CS – ratings of perivascular space enlargement in the centrum semiovale; EPVS-BG – ratings of perivascular space enlargement in the basal ganglia; BPF – Brain parenchymal fraction; SVD Sum Score – ordinal score ranging from 0 to 4 representing the overall severity of the profile of MRI markers of SVD; RISS – Response Inhibition and Set Shifting Domain; WM – Working Memory Domain; MP – Motor Programming; CI – Conflicting instructions; MIC – Motor Inhibitory Control; VIC – Verbal inhibitory control; AC – Abstraction Capacity; BDS – Backwards Digit Span; VWM – Verbal Working Memory; SWM – Spatial Working Memory. Statistically significant correlations are presented in bold. * p < 0.05, **p < 0.01, ***p < 0.001.
A multivariate linear regression analysis was used to evaluate the independent explanatory value of MRI markers of SVD on the IFS Total Score. The analysis included age, education, and all quantified markers of SVD (i.e., nWMHVol, CMBs, nLacuneVol, EPVS-CS, EPVS-BG, and BPF). The overall model was significant and accounted for 67% of the variance in the IFS Total Score (R 2 = 0.67, p < 0.001). The education level (β = 0.46, p < 0.001), the nWMHVol (β = -0.39, p = 0.02), and the nLacuneVol (β = -0.27, p = 0.04) were the only significant predictors in the model. A trend for significance was found for the EPVS-BG (β = 0.22, p = 0.05). Age (β = 0.10, p > 0.05), the BPF (β = 0.18, p > 0.05), the number of CMBs (β = -0.15, p > 0.05), and the EPVS-CS (β = -0.05, p > 0.05) did not significantly contribute to the overall model fit. A separate multivariate linear regression analysis evaluating the influence of the SVD Sum Score on the IFS Total Score, with age and education as additional covariates, was significant and explained 42% of the variance in performance (R 2 = 0.42, p < 0.001). Education (β = 0.52, p < 0.001) and the SVD Sum Score (β = -0.45, p < 0.001) significantly contributed to the model fit, while the influence of age (β = 0.13, p > 0.05) was not significant.
ROC Curve Analyses
The results of ROC analyses are summarized in Figure 4. These analyses revealed that neither the MMSE [area under curve (AUC) = 0.61, p > 0.05] nor the IFS Total Score (AUC = 0.62, p > 0.05) accurately differentiate CADASIL subjects from noncarriers (Figure 4A). Nonetheless, the IFS Total Score was able to significantly discriminate between subjects presenting with or without CMBs (AUC = 0.77, p = 0.003, 95% confidence interval: 0.63–0.91; Figure 4C), and between subjects presenting with or without lacunes (AUC = 0.84, p = 0.008, 95% confidence interval: 0.66–1.00; Figure 4D). The MMSE Score did not accurately differentiate these subgroups (p > 0.05). Both the MMSE (AUC = 0.79, p = 0.003, 95% confidence interval: 0.63–0.95) and the IFS Total Score (AUC = 0.81, p = 0.002, 95% confidence interval: 0.66–0.95) were able to significantly differentiate between subjects presenting with or without severe WMH (Figure 4B). On the other hand, neither the MMSE (EPVS-CS: AUC = 0.59, p > 0.05; EPVS-BG: AUC = 0.58, p > 0.05) nor the IFS (EPVS-CS: AUC = 0.59, p > 0.05; EPVS-BG: AUC = 0.45, p > 0.05) were able to distinguish between subjects presenting with or without more severe forms of EPVS (Figure 4E/F). A cutoff score of 22 on the IFS Total Score yielded a sensitivity of 0.75 and a specificity of 0.77 for the presence of severe WMH, a sensitivity of 0.83 and a specificity of 0.71 for the presence of lacunes, and a sensitivity of 0.67 and a specificity of 0.72 for the presence of CMBs.
DISCUSSION
Our results highlight a significant reduction in performance on the IFS for asymptomatic CADASIL subjects, as opposed to noncarriers. We further show significant associations between the IFS Total Score and multiple MRI markers of SVD. In our cohort, the IFS Total Score was able to discriminate between subjects presenting or not with various well-characterized MRI markers of SVD, including the presence of severe WMH, CMBs, and lacunes. These findings suggest that performance on the IFS could serve as a cognitive marker for underlying SVD burden.
Executive dysfunction is a well-documented consequence of SVD, a prevalent condition in the aging population (Debette & Markus, Reference Debette and Markus2010; Desmond, Reference Desmond2004; Kloppenborg et al., Reference Kloppenborg, Nederkoorn, Geerlings and van den Berg2014). Tracking the progression of executive dysfunction could thus provide useful information on the severity and progression of SVD in affected patients. The detection of executive deficits usually implies the administration of an extensive neuropsychological assessment, which is not always readily available in clinical settings. As such, a brief screening tool sensitive to executive deficits secondary to SVD could be highly beneficial to evaluate cognitive symptoms and track disease progression in clinical settings. For this reason, we investigated performance on the IFS and relationships with MRI markers of SVD in patients with CADASIL, a rare hereditary condition leading to the early onset of SVD and vascular-related cognitive impairments (Chabriat et al., Reference Chabriat, Joutel, Dichgans, Tournier-Lasserve and Bousser2009). This population allows characterizing the specific consequences of SVD, while reducing the influence of risk factors and comorbidities typically associated with older age. This is, to the best of our knowledge, the first report investigating performance on the IFS in the context of SVD.
Subjects with CADASIL showed a consistent reduction in performance across neuropsychological tests assessing executive functions, including the IFS. This is consistent with previous literature highlighting predominant executive function deficits in CADASIL (Buffon et al., Reference Buffon, Porcher, Hernandez, Kurtz, Pointeau, Vahedi and Chabriat2006) and, more generally, in subjects with SVD (Debette & Markus, Reference Debette and Markus2010; Desmond, Reference Desmond2004). Confirming the validity of this measure, the IFS Total and Domain Scores were significantly correlated with two widely used neuropsychological tests (Phonemic Fluency and Wisconsin Card Sorting Test) in our sample. The evaluation of group differences across the different domains of executive function assessed by the IFS revealed a significantly lower performance on the AC and WM domains, but not on the RISS domain, in carriers as opposed to noncarriers. Analysis of group differences across individual IFS subtests revealed a significant and predominant reduction in performance on the VWM for CADASIL subjects. Group differences on other subtests did not remain statistically significant after correction for multiple comparisons. This suggests that the VWM subtest is particularly sensitive to the effects of SVD.
In addition to providing details on the neuropsychological profile of asymptomatic CADASIL subjects, this study contributes to the characterization of neuroimaging features of this rare disease. This is the first publication describing in details the neuroimaging features of this cohort of CADASIL subjects from Colombia. With regards to MRI markers of SVD, CADASIL subjects differed from noncarriers on the nWMHVol, the nLacuneVol, the number of CMBs, EPVS in the CS and BG, but not on the BPF, a measure of global atrophy. Compared to noncarriers, subjects with CADASIL had significantly higher SVD Sum Scores, an ordinal score combining different quantified MRI markers of SVD and representing the overall severity of the SVD profile. The absence of group differences on the BPF is contradictory to previous results demonstrating a lower normalized brain volume in CADASIL patients (Jouvent et al., Reference Jouvent, Viswanathan, Mangin, O’Sullivan, Guichard, Gschwendtner and Pachaï2007, Reference Jouvent, Mangin, Porcher, Viswanathan, O’sullivan, Guichard and Chabriat2008; Stromillo et al., Reference Stromillo, Dotti, Battaglini, Mortilla, Bianchi, Plewnia and De Stefano2009). This discrepancy in findings across studies is likely explained by differences in disease severity between the studied samples. The present CADASIL cohort only includes nondemented subjects with no previous history of strokes. These subjects are at a relatively early or mild stage of the disease, which possibly explains the absence of global structural alterations in this sample.
Correlation analyses revealed significant associations between the IFS Total Score and the nWMHVol, nLacuneVol, number of CMBs, and SVD Sum Score. Ratings of perivascular spaces enlargement (EPVS-BG/CS) and the BPF showed no association with the IFS Total Score. The absence of direct associations between the IFS and the BPF is somewhat in contrast with findings from Baez and colleagues (Reference Baez, Pinasco, Roca, Ferrari, Couto, García-Cordero and Matallana2017) revealing significant associations between performance on the IFS and grey matter volume in selected brain areas, including medial temporal lobe regions and the orbitofrontal cortex. It is possible that the investigation of regional volumes rather than a global volumetric measure (i.e., BPF) could provide additional information and allow detecting associations between structural markers and performance on the IFS. The absence of association between perivascular spaces enlargement and cognition has been reported in the literature (Benjamin et al., Reference Benjamin, Trippier, Lawrence, Lambert, Zeestraten, Williams and MacKinnon2018; Hurford et al., Reference Hurford, Charidimou, Fox, Cipolotti, Jager and Werring2014), although inconsistently (Huijts et al., Reference Huijts, Duits, Staals, Kroon, de Leeuw and van Oostenbrugge2014; MacLullich et al., Reference MacLullich, Wardlaw, Ferguson, Starr, Seckl and Deary2004). A multivariate linear regression analysis including age, education years, and all quantified MRI markers of SVD explained as much as 67% of the observed variance in the IFS Total Score. The normalized volumes of WMH and lacunes were the only MRI marker of SVD significantly and independently associated with performance on the IFS Total Score. Perivascular spaces enlargement in the BG (EPVS-BG) showed a marginal influence on the IFS Total Score, while the BPF, the count of CMBs, and the severity of perivascular spaces enlargement in the CS (EPVS-CS) did not significantly contribute to the observed variance in performance. A separate linear regression model showed that the SVD Sum Score, together with the education level, was also significantly related to performance on the IFS. These results demonstrate that performance on the IFS is significantly related to the profile of MRI markers of SVD. This screening test could thus become a useful outcome measure in clinical settings or in the evaluation therapeutic strategies for CADASIL.
Finally, results from ROC analysis showed that neither the IFS Total Score nor the MMSE accurately discriminated CADASIL subjects from controls. The limited diagnostic discrimination of the IFS is not unexpected in our CADASIL sample due to the small sample size and the variability in age (age ranging from 21 to 61 years), cognitive functioning (MMSE ranging from 21 to 30), and severity of quantified SVD markers. Accordingly, a number of CADASIL subjects in our sample present with a low burden of SVD and minimal cognitive impairment. We would not expect these subjects to obtain a markedly low score on the IFS despite a genetic diagnosis of CADASIL. On the other hand, the IFS was able to significantly discriminate between subgroups based on the presence or absence of various well-characterized MRI markers of SVD. A cutoff score of 22 on the IFS Total Score yielded an adequate sensitivity (range: 0.67 to 0.83) and specificity (range: 0.71 to 0.77) to detect the presence of lacunes, microbleed, and severe white matter lesions on MRI investigation. These findings reveal that performance on the IFS is sensitive to the presence of several key MRI markers of SVD.
Limitations
Although our results are promising for the identification of specific and early cognitive markers for SVD, it is important to note that this study has several limitations. First, since CADASIL is a rare condition, our sample size is small, which limits our statistical power and the scope of our findings. Secondly, while our results provide support for the utility of the IFS in the assessment executive dysfunction associated with SVD in a unique cohort of subjects with CADASIL, it is unknown whether this test is adequate to estimate executive dysfunction related to other forms of vascular cognitive impairments. Thirdly, we did not have detailed information on background, premorbid cognitive, or intellectual functioning in our sample. This limits the interpretability of our results and the evaluation of cognitive decline. Finally, our sample was recruited from a specific region of Colombia (Antioquia). It is possible that our results are influenced by our sample sociodemographic and sociocultural characteristics and are not fully generalizable to other samples presenting with SVD.
To promote its interpretability and clinical applications, the IFS should be translated and validated in other languages and across different populations. Further, to better characterize associations between IFS performance and SVD, future studies should evaluate the relevance of this test in larger samples and in other cerebrovascular disorders, including cerebral amyloid angiopathy, stroke, or sporadic forms of SVD or vascular dementia. Future studies should also examine relationships between the IFS and SVD progression using a longitudinal design, as to characterize the prognostic utility of this screening test.
Conclusion
Overall our results highlight significant differences in IFS performance between asymptomatic CADASIL subjects and noncarriers. We further demonstrate that the IFS is significantly related to various markers of SVD, as quantified using MRI. These results indicate that the IFS could be a useful and efficient tool to evaluate and track executive function impairments associated with the presence of SVD.
Acknowledgements
We thank patients and families who have devoted their time and effort to participate in this project. This research was supported by grant from the National Institute of Neurological Disorders and Stroke (JFA-V, grant numbers RF1NS110048, UH3NS100121), the CureCADASIL Research Alliance Program (JFA-V), COLCIENCIAS (FL), CODI University of Antioquia (FL), and Massachusetts General Hospital ECOR (YTQ). AV’s research work was supported by the National Institutes of Health (grant numbers R01NS104130, R01AG047975). DS received postdoctoral funding from the American Heart Association (USA; grant number 20POST35110047) and the Fonds de recherche du Québec – Santé (Canada; grant number 254389).
Conflict of Interest
The authors have nothing to disclose.


