Introduction
Conflict between wildlife, most notably birds, and the aviation industry began with the first flights in 1904 (Sodhi Reference Sodhi2002, Dolbeer Reference Dolbeer2006a, McKee et al. Reference McKee, Shaw, Dekker and Patrick2016). This conflict has grown to become a major problem with globally significant financial and human costs (Blackwell et al. Reference Blackwell, DeVault, Fernández-Juricic and Dolbeer2009, McKee et al. Reference McKee, Shaw, Dekker and Patrick2016). Bird–aircraft collisions are estimated to cost civil aviation worldwide more than US$1.2 billion each year (Blackwell et al. Reference Blackwell, DeVault, Fernández-Juricic and Dolbeer2009) and have accounted for the reported loss of 255 human lives and 243 civil and military aircraft (Dolbeer Reference Dolbeer2006b, Coccon et al. Reference Coccon, Zucchetta, Bossi, Borrotti, Torricelli and Franzoi2015, Viljoen & Bouwman Reference Viljoen and Bouwman2016). In countries with high densities of wildlife, this poses an especially large threat. For example, in South Africa alone, the Civil Aviation Authority reported 400 bird/wildlife strikes in a single year between April 2012 and March 2013 (Viljoen & Bouwman Reference Viljoen and Bouwman2016). For a middle-income country with limited resources, efforts should be directed towards avoiding collisions and minimizing damage to existing aircraft.
Not all birds pose an equal threat to aircraft, so risk assessment techniques can be used to identify priority bird strike hazards (DeVault et al. Reference DeVault, Belant, Blackwell and Seamans2011, Hauptfleisch & Avenant Reference Hauptfleisch and Avenant2016). Bird risk ranking systems allow resources to be targeted towards species most hazardous to aircraft, rather than attempting to manage all bird species concurrently. Such ranking systems prioritize species on the potential severity of a bird–aircraft collision (consequence) and the likelihood of such a collision taking place (probability). The characteristics of the bird species themselves account for the consequences of a bird–aircraft collision. For example, species with a large body mass will cause more damage to aircraft, as will species that congregate in large flocks and those with slow, meandering or hovering flight patterns (ICAO 2012, De Vault et al. Reference DeVault, Blackwell, Seamans and Belant2016). On the other hand, the probability of a bird–aircraft collision often depends on the abundance of some species near the aircraft runway (ICAO 2012). This is usually based on the ability of the surrounding habitat to support bird populations, so managers aim to modify habitat to manipulate the composition of bird communities and minimize the risk of bird–aircraft collisions (ICAO 2012, De Vault et al. Reference DeVault, Blackwell, Seamans and Belant2016).
Collisions between birds and aircraft are not limited to the runway. Approximately 74% of all bird strikes to aircraft occur at under 500 feet (Dolbeer Reference Dolbeer2006b), which equates to a ground distance radius of 3 km from the runway (Dolbeer Reference Dolbeer2006b, Blackwell et al. Reference Blackwell, DeVault, Fernández-Juricic and Dolbeer2009). This is the zone in which aircraft descend on approach to land and ascend on take-off and have little leeway to avoid potential bird collisions (Schafer et al. Reference Schafer, Blackwell and Linnell2007). Therefore, the habitat in this 3-km zone is a major determinant of bird abundance and thus the likelihood that birds might come into contact with aircraft.
In this study, we examined the risk posed by birds at Air Force Base Ysterplaat, a military airfield in Cape Town (South Africa). Military aircraft, especially fighter jets, are particularly vulnerable to collisions with birds because of low-altitude operations at high speeds (Linnell et al. Reference Linnell, Conover and Ohashi1996, Sodhi Reference Sodhi2002, McKee et al. Reference McKee, Shaw, Dekker and Patrick2016). Similarly, helicopters, which are commonly used by the military, are also at risk of bird strikes, and almost half of all helicopter accidents are caused by windshield penetration (Thorpe Reference Thorpe2012).
Although Air Force Base Ysterplaat was originally developed on the outskirts of Cape Town in 1941 during World War II (Teale Reference Teale2014), anthropogenic urban expansion, particularly in the last two decades, has surrounded the base with residential and industrial developments. This has resulted in an urbanization gradient between the open airfield and the built-up surroundings, which has altered the composition of bird communities. Urbanization in this context is the alteration of land use that eliminates dominant native ecosystems (Güneralp & Seto Reference Güneralp and Seto2013, Beninde et al. Reference Beninde, Veith and Hochkirch2015). The hadeda ibis, Bostrychia hagedash, is a typical example of the way changing land use due to urbanization has altered the distribution and abundance of bird species. This large-bodied (≥1.2 kg) species first appeared in the Cape Peninsula during the 1970s and is now common because irrigation in human-modified landscapes has increased soil moisture and therefore their ability to feed on subterranean invertebrates (Hockey & Midgley Reference Hockey and Midgley2009, Duckworth et al. Reference Duckworth, Altwegg and Guo2010, Reference Duckworth, Altwegg and Harebottle2012). Human structures – such as roofs, fence posts and pylons – are also the preferred perching sights for these birds (Singh & Downs Reference Singh and Downs2016a).
This study used four steps to examine whether urbanization surrounding Air Force Base Ysterplaat influences the hazard of bird–aircraft collisions. First, we carried out a multiple-season survey of the bird community in and around the air force base and estimated bird densities after accounting for imperfect detection during the survey in the built-up environment. Second, we estimated urbanization in the survey area by quantifying the area of impervious, built-up surfaces using a geographic information system. Third, we linked the densities of bird species to urbanization and categorized species based on their affinities to open or built-up habitats. Fourth, we developed a risk rating system for each species based on the consequence and probability of an aircraft collision and compared these ratings to the species habitat affinities. Combined, these four steps allowed us to determine whether the bird species that are most hazardous to aircrafts had any preference for the open habitat of the air force base or in the surrounding urban matrix. Ultimately, this information will guide management strategies to reduce the likelihood of devastating bird–aircraft collisions.
Methods
Study Area
This study was carried out at Air Force Base Ysterplaat (Fig. 1) in Cape Town, South Africa (33.906° S, 18.495° E); this is a single-runway airport with clearly defined corridors for approach and departure. The base covers 242 ha along the south-western Atlantic coast with an average altitude of 14 m above sea level and a temperate dry summer (Mediterranean) climate. The air force base comprises a 1.6-km tarred runway surrounded by 165 ha of open vegetation and 77 ha of hangars, offices, barracks and other operational infrastructure.
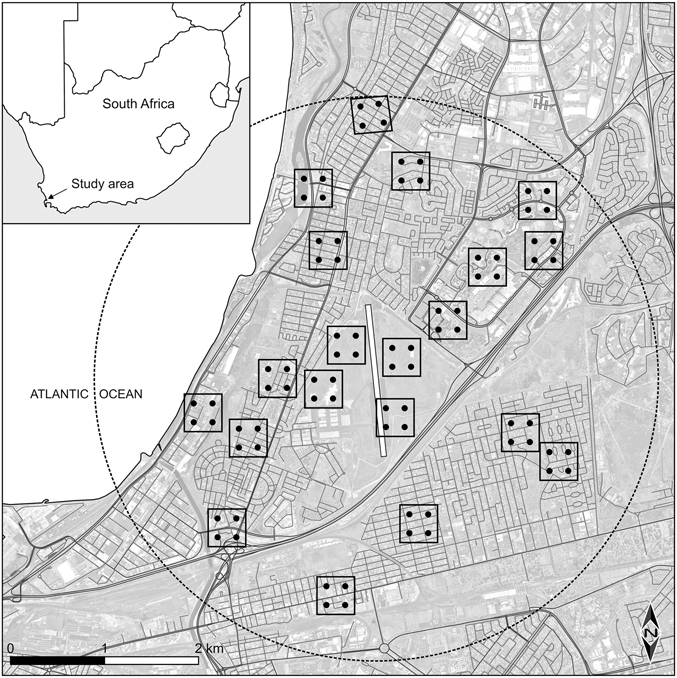
Fig. 1 A map of the study area showing the location of the runway at Air Force Base Ysterplaat and the 20 sampling quadrats (each with four observation localities) within a 3000-m radius of the centre of the runway.
When established in 1941, the airfield would have been part of the fynbos biome. Today, a small portion (6.11 ha) of the base still contains remnants of endangered Cape Flats Dune Strandveld and critically endangered Cape Flats Sand Fynbos (Mucina & Rutherford Reference Mucina and Rutherford2006), but the larger portion of the base is now short open grassland dominated by naturalized species (Avena sativa and Cynodon dactylon). Areas within 30 m of runways and taxiways are mowed according to aviation safety regulations, whereas the rest of the base is managed in an effort to encourage the re-establishment of native species (i.e., minimal disturbance, except when clearing invasive species). The land surrounding the airfield would also have been part of the fynbos biome originally, but is now made up of residential and industrial developments. This includes the multi-use developments to the north-east, residential areas to the east and west and industrial developments to the south. The Atlantic Ocean forms the western border of the study area.
Bird Surveys
The survey area was constrained to areas within a 3-km radius of the centre of the runway. We used a stratified random sampling design that approximately reflected the varying degrees of urbanization in the surrounding matrix. We began by outlining five zones; one on the base itself and then one each to the north, east, south and west of the runway. These zones represented residential, mixed-use and industrial urban zones, as well as open spaces and environmental conservation zones as defined by the local Spatial Development Plan and Environmental Management Framework for the Blaauwberg District (City of Cape Town 2012). Within each of these five zones we selected four random sampling quadrats (400 m×400 m) using Hawth’s Analysis Tool version 3.27 (Beyer Reference Beyer2004) for ArcGIS version 9.3 (ESRI 2009). In each quadrat, four survey points were equally spaced 200 m apart and 100 m from the quadrat boundaries to prevent overlapping observations of individual birds at each point (Sandström et al. Reference Sandström, Angelstam and Mikusiński2006, van Rensburg et al. Reference van Rensburg, Peacock and Robertson2009). This gave a total of 80 sampling points nested within 20 quadrats (Fig. 1).
Birds were surveyed by the same observer (RFJ) across four seasons (Winter: July 2015; Spring: October–November 2015; Summer: December 2015–January 2016; and Autumn: March–April 2016) using fixed-radius point counts (Gibbons et al. Reference Gibbons, Hill and Sutherland1997, Johnson Reference Johnson1997, Gregory et al. Reference Gregory, Gibbons and Donald2004), which were more suitable for the built-up urban environment than linear strip counts (Bibby et al. Reference Bibby, Jones and Marsden2000, Schafer et al. Reference Schafer, Blackwell and Linnell2007). At each point, a two-minute settling period was allowed before bird specimens were recorded. After this settling period, all visible bird specimens were identified and recorded for a total of eight minutes at each point and their distance from the observer assigned to one of four bands (0–25 m, 26–50 m, 51–75 m or 76–100 m) based on estimates from a Tasco Laser Rangefinder. The time of each observation was also recorded relative to the starting time, which showed that new specimens were rarely recorded after more than five minutes of observation, thereby confirming the robustness of the eight-minute observation window. Birds flying overhead were recorded, but eventually removed from the dataset because these individuals could potentially be double-counted across multiple sampling points. The sequence in which points were sampled was randomized across morning and afternoon surveys, as well as across seasonal surveys.
Completing a round of seasonal surveys took approximately two weeks. On windy (>20 km hour–1) or rainy days, surveys were postponed because birds were likely to be less observable (Guilherme & Pereira 2013). Surveys were carried out when the birds were most active during a period half an hour after sunrise for three hours and at the same point three hours before sunset (Lynch Reference Lynch1997). Surveys were repeated four times a year in each season to account for seasonal variation (Coccon et al. Reference Coccon, Zucchetta, Bossi, Borrotti, Torricelli and Franzoi2015). This meant that each point was surveyed eight times (one morning survey and one afternoon survey across the four seasons).
Bird Density Estimation
Observation of birds could be obstructed in the built-up urban environment, resulting in imperfect detection (i.e., birds were not recorded even when they were actually present). Therefore, we used distance-based sampling to estimate bird density while accounting for the fact that nearby birds are more likely to be detected than more distant specimens (Gregory et al. Reference Gregory, Gibbons and Donald2004, Alldredge et al. Reference Alldredge, Pollock, Simons and Shriner2007). We modelled a distance detection function for each species separately (ds function in the Distance R-package) using R 3.1.2 (R Core Team 2014). Although it is conservatively recommended that detection curves be fitted to 60–80 observations per species, as few as 40 observations are adequate for a moderate level of precision (Buckland et al. Reference Buckland, Anderson, Burnham and Laake1993, Phalan et al. Reference Phalan, Onial, Balmford and Green2011). Since our aim was to identify broad urban responses rather than precise measurements of density, we fitted detection curves to all species with at least 40 observations. For the species with fewer than 40 observations, detectability was not estimated and observed abundance was used in all subsequent analyses. Although this underestimated the abundance of rarer species (by not considered imperfect detection), we assumed that this would be less biased than fitting detectability functions to sparse data.
For species with more than 40 observations, one detection function was fitted for all observations, while including the sampling season as a covariable (Marques et al. Reference Marques, Thomas, Fancy and Buckland2007). Here, distance classes for specimen records were treated as binned data. For each species, both the half-normal and hazard rate key functions were fitted, and the function with the lowest Akaike Information Criterion was selected as the best-fitting detection function (Bibby et al. Reference Bibby, Jones and Marsden2000). The uniform key function and all adjustments (i.e., cosine, Hermite, polynomial) were not considered because these parameters cannot be used when incorporating covariables. After fitting the detection curves, the species densities were estimated as individuals per m2 for each of the 20 sampling quadrats. For rare species with fewer than 40 observations, density was calculated by dividing the number of observed individuals by the area of the sampling quadrat (160 000 m2).
Quantifying Urbanization
We quantified the percentage of built-up area in each sampling quadrat as an estimate of urbanization. Caddie 9 surveying GIS software was used to classify 2015 aerial imagery from Google Earth (http://earth.google.com) into three coarse urban landscape types: built areas, open areas and surface water. Specific refinement of the quadrats was done through visual interpretation of the Google Earth imagery and verified through site visits during the bird surveys. The percentage of built area in each sampling quadrat was used as a continuous proxy for urbanization in subsequent analyses.
Categorizing Species Based on Habitat Affinities
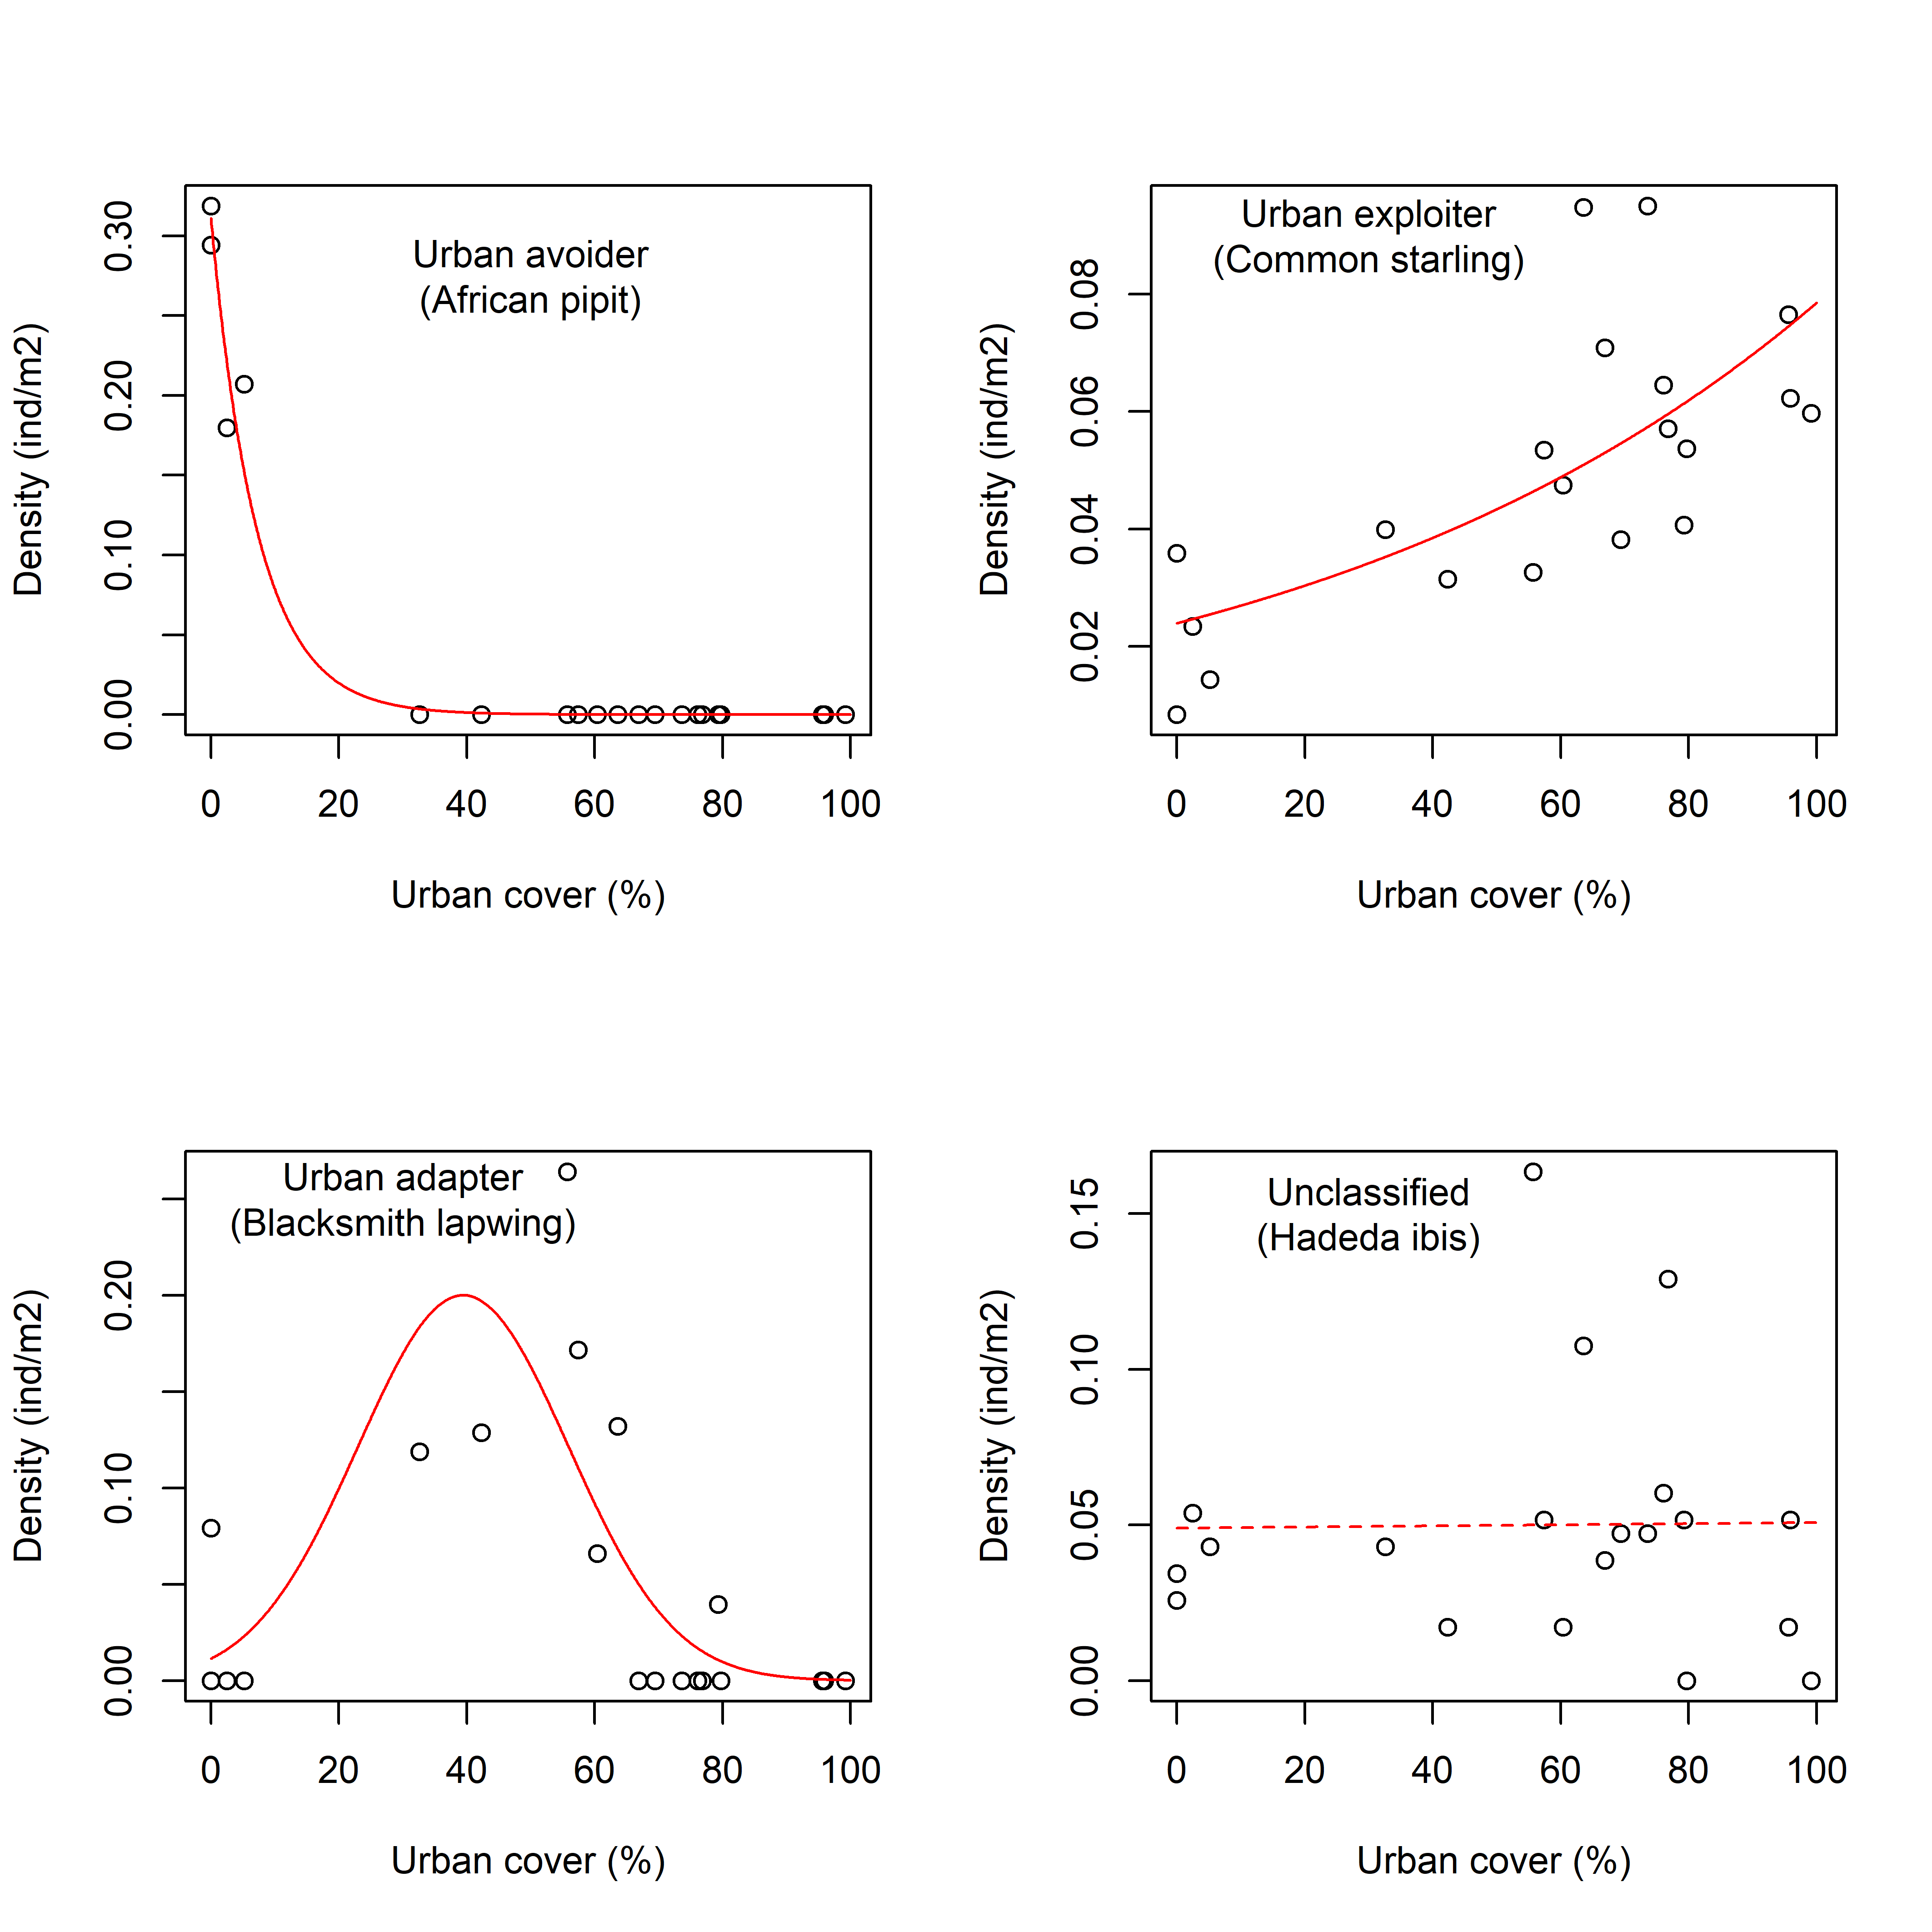
Population density for each species was compared to the degree of urbanization in each sampling quadrat. This was used to classify species as urban avoiders, adaptors or exploiters (Blair Reference Blair1996, Seress & Liker Reference Seress and Liker2015). Urban avoiders are habitat specialists sensitive to human-induced disturbances and have lowest densities in urban habitats. Urban adapters are edge species that dominate the transitions between open and built-up habitats. Urban exploiters have the highest density in urban habitats and are well suited to exploiting built-up environments.
To assign species to urban response categories, we regressed population density against the percentage of urbanization using separate generalized linear models (glm function in stats R-package) with quasi-Poisson error distributions. A quasi-Poisson error distribution was used because the density data, while not discrete, had variances proportional to the means. To make the model coefficients comparable across species, population density was standardized by dividing the density of each quadrat by that species’ density across the whole study area. Examples of species in each urban response category are shown in Supplementary Fig. S1 (available online).
Two models were fitted for each species. The first represented a monotonic response to the urbanization gradient and included only the proportion of the built-up area as an independent variable. The second model tested for a unimodal (i.e., humped-shaped) relationship with urbanization and included both linear and quadratic terms for the proportion of the built-up area. The two models were compared using an F-test (anova function in stats R-package), and the best-fitting model (i.e., the one that had the lower residual deviance) was selected if the two models differed significantly (α=0.05). In the cases where the two models did not differ statistically, the simpler monotonic model was selected for reasons of parsimony. In addition to the deviances, the fit of the model was assessed using the R2 from a unity line regression (a line with intercept=0 and slope=1) between the modelled and empirical density data.
Each bird species was assigned to an urban response category based on the following rules: first, if a species occupied fewer than three quadrats or if the R2 from the unity line regression was less than 0.15, then the species remained ‘Unclassified’. This represented species for which there were either too few records to identify an urban response or species with only weak statistical associations between density and urbanization for this specific landscape. Species were classified as ‘Urban Adapters’ if the model with the quadratic urbanization term provided the best fit. Species were categorized as ‘Urban Avoiders’ or ‘Urban Exploiters’ if the regression coefficients from the monotonic models were negative or positive, respectively.
Bird Risk Rating System
A risk rating for each species was determined based on the consequence and probability of a bird–aircraft collision (Paton Reference Paton2010, Hauptfleisch & Avenant Reference Hauptfleisch and Avenant2016). The consequence of a collision was based on body mass, flock size and flight behaviour (Table 1). Species were classified into one of six classes based on average body mass as recorded in published sources (Hockey et al. Reference Hockey, Dean and Ryan2005, Dunning Reference Dunning2007). Three classes of flock size and two classes of flight behaviour were determined from Hockey et al. (Reference Hockey, Dean and Ryan2005), and these were validated by comparing the bird observations to expectations from the literature. For species that aggregated in flocks when breeding, the highest flock size was used for this rating system to reach more conservative estimates of hazard (Hauptfleisch & Avenant Reference Hauptfleisch and Avenant2016). Each class of body mass, flock size and flight behaviour was assigned a predetermined score and the product of these three scores was the total consequence score (Table 1), which was used to assign species to one of six consequence categories (‘very low’, ‘low’, ‘medium’, ‘high’, ‘very high’ or ‘extreme’).
Table 1 The classification scheme for summarizing body size, flock size and flight behaviour in a consequence score for bird–aircraft collisions (Paton Reference Paton2010)

The probability of a collision was determined from the estimated abundance of bird species across all sites and seasons after correcting for imperfect detection. Species were assigned to one of four probability categories based on their contribution to the overall abundance of the community: ‘very high’ (≥1% of all individuals), ‘high’ (<1% and ≥0.1% of all individuals), ‘medium’ (<0.1% and ≥0.01% of all individuals) or ‘low’ (<0.01% of all individuals). These probability categories were then combined with the consequence categories to determine the overall risk of bird–aircraft collision (Table 2).
Table 2 The hazard ranking system for classifying species hazard from combinations of probability and consequence of collision with an aircraft (Paton Reference Paton2010)

We compared the species richness and the total bird density in each quadrat with degree of urbanization (percentage built area) using linear regression (lm command in stats R-package) with a quadratic term. This parametric test was appropriate because richness, density and degree of urbanization are all continuous variables and the residuals of the regression models were normally distributed. This was followed by a non-parametric Kruskal–Wallis test (kruskal.test command in stats R-package) comparing the overall hazard of bird–aircraft collision across the four bird urban response groups. A non-parametric test was needed because the hazard ratings were categorical variables based on the ordinal ranking of overall hazard.
Results
Over the course of this study, 15 939 birds were recorded from 71 species (Supplementary Table S1). Urbanization accounted for 18% of the variation in bird species richness (adjusted R2=0.182) and 48% of variation in bird density (adjusted R2=0.485), with both species richness and density peaking at intermediate levels of urbanization (Fig. 2). However, the hump-shaped relationship between species richness and urbanization was not statistically significant (Urbanization coefficient=0.186, p=0.171; Urbanization2 coefficient=–0.003, p=0.065). In contrast, the hump-shaped relationship for bird density was strongly significant (Urbanization coefficient=1.9×10⁻⁴, p<0.001; Urbanization2 coefficient=–1.6×10⁻⁴, p=0.003).
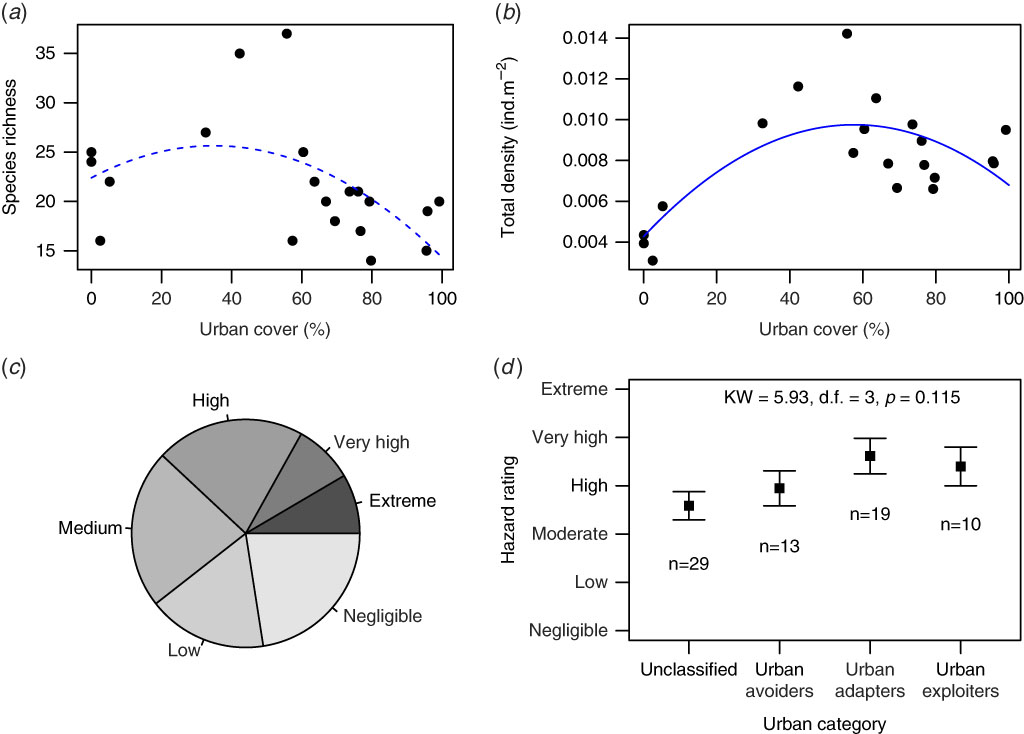
Fig. 2 Bird species richness (a) and density (b) across an urbanization gradient surrounding Air Force Base Ysterplaat; dashed and solid lines represent non-significant and significant quadratic relationships, respectively. The proportions of bird species in each of the six bird hazard rating categories (c) and the mean hazard rating – with standard errors – for bird species in different urban response categories (d).
Of the bird species, most posed only a small hazard to aircrafts (Fig. 2(c)), with 16 (22.5%) and 12 (16.9%) species in the ‘negligible’ and ‘low’ hazard categories, respectively. Another 16 species (22.5%) were of ‘medium’ hazard and 15 species (21.1%) were of ‘high’ hazard. The hazard categories with the fewest species were ‘very high’ and ‘extreme’ hazard, which had six species each (8.4%). Of the six species that were of ‘extreme’ hazard, two species – the greater flamingo, Phoenicopterus ruber, and the swift tern, Sterna bergii – were not assigned to an urban response category (i.e., ‘unclassified’) because they were only recorded from one sample quadrat to the north of the air force base where there is a large natural wetland. A third species – the hadeda ibis, Bostrychia hagedash – was also ‘unclassified’, but this was because it was equally common across the entire urban gradient. Two of the ‘extreme’ hazard species – the Cape spurfowl, Pternistis capensis, and the helmeted guinea fowl, Numida meleagris – preferred the open grasslands of the air force base and were therefore ‘urban avoiders’. The sixth ‘extreme’ hazard species was the Egyptian goose, Alopochen aegyptiacus, which was an ‘urban adapter’ with densities peaking at intermediate levels of urbanization. There were no ‘urban exploiters’ with ‘extreme’ hazard ratings.
When all species were considered, overall hazard ratings did not differ across the urban response categories (Kruskal–Wallis χ 2=5.93, p=0.115; Fig. 2(d)). Despite most species (n=29) not being assigned to an urban response category, the average hazard rating for this group was not statistically discernible from urban adapters (n=19), which would be expected to have higher population densities considering the overall trends of the community (Fig. 2(b)). Nevertheless, the average hazard for the whole community could be considered as ‘high’ (mean rank=2.98, with 0 and 5 denoting negligible and extreme hazard, respectively). This implies that, on average, species in and around Air Force Base Ysterplaat pose a ‘high’ hazard to aircraft, regardless of their affinities to combinations of open or built-up habitat.
Discussion
Despite developing techniques to quantify the risk of bird–aircraft collisions, the aviation industry faces the novel challenge of changes to the areas surrounding airfields. In this study, we examined the effect of urbanization around Air Force Base Ysterplaat on the hazard of bird–aircraft collisions. Although built-up environments tended to reduce habitat for certain species, they also created new opportunities for other species able to exploit urban landscapes (Marzluff Reference Marzluff2001); urbanization has evidently altered the bird community composition. However, these changes do not necessarily represent changes to the hazard of bird–aircraft collisions. Instead, the overall hazard is consistently high across species, irrespective of their affinities for open or built-up habitat.
Urbanization may not increase the hazard of bird–aircraft collisions, but presents novel management challenges (DeStefano & DeGraaf Reference DeStefano and DeGraaf2003). Specifically, intensive management of the relatively uniform habitat of the airfield is insufficient for controlling overall hazard because the surrounding urban matrix – which is a patchwork of different land uses and ownership structures – poses an equivalent threat. The International Civil Aviation Organization (ICAO 2012) acknowledges this and outlines in their wildlife control and reduction manual how airport operators should organize bird strike control programmes beyond the boundaries of the airfield to avoid and minimize any increases in hazardous bird species.
Avoidance should always be the first form of mitigation. The most effective way to prevent the negative effects of urbanization on bird strike hazard is to limit development to compatible land uses (ICAO 2012). In South Africa, developers are required to undertake an environmental impact assessment (EIA) for certain listed developments and changes in land use. However, in the case of Air Force Base Ysterplaat, it seems that the EIA process for development around the base has yet to include potential changes to bird strike hazard. According to the aviation safety officer at the base (R. Wilson, personal communication 2016), the base has only ever been approached on issues of flight safety, such as buildings potentially obstructing flight paths or interfering with radar or radio systems. The potential effect of developments on bird–aircraft collisions has yet to be integrated into the EIA process. Therefore, airfield operators and EIA practitioners need to expand the way bird strike hazard is included in future development applications.
A deeper understanding of intra-city variation in bird distributions (e.g., Beninde et al. Reference Beninde, Veith and Hochkirch2015) would help identify how urbanization affects the hazard of bird–aircraft collisions. Cities are not simple concentric rings with densely developed cores that open up towards the periphery. Instead, they are complex mosaics of different types of land use. The area of suitable habitat and the availability of corridors linking these habitats are among the greatest predictors of urban biodiversity (Beninde et al. Reference Beninde, Veith and Hochkirch2015). This could be integrated into land-use planning to ensure that future developments do not change bird community structures in a way that worsens bird strike hazard (Alberti et al. Reference Alberti, Botsford and Cohen2001).
The second form of mitigation available to airfield operators is to minimize the potential hazard of bird strikes. The clear guidelines for how this can be applied to the airfield property (ICAO 2012) are not easily applied to built-up environments; many of the prescribed deterrents (e.g., lethal removal, patrols, chemicals, projectiles or audio and visual deterrents) are unsuitable for densely populated urban areas. Biological control agents, such as trained falcons, have been used successfully elsewhere (Burger Reference Burger1983), but these generally work best as part of an integrated deterrent system. In general, there is a shortage of bird deterrent techniques that can be applied in the surrounding urban matrix. Even if new deterrents are developed, there remains the obstacle of implementing management interventions on private property. South African legislation does not compel landowners to manage flight safety risks on their properties.
In the specific case of Air Force Base Ysterplaat, the airfield operator is not liable for managing hazardous birds in the urban matrix because, as a military base, it does not need to meet the standards set out for the civil aviation sector. The South African Air Force is not subject to the National Civil Aviation Act or the White Paper on National Civil Aviation Policy. In addition, all military aircraft and exclusive military installations are excluded from the statutory standards and requirements of ICAO (Milde Reference Milde2008). Nevertheless, despite not being legally obliged to manage bird hazard, it is still in the best interests of Air Force Base Ysterplaat to minimize the potential loss of human life, aircraft and equipment. For extremely hazardous species with specific habitat requirements – such as greater flamingos and swift terns – the airfield operator could implement management strategies beyond the boundary of the airfield because these species have very predictable distributions linked to freshwater habitats. However, for less predictable species, the best strategy to reduce risk is likely one that mobilizes residents and businesses surrounding the airfield to contribute to a community-driven bird management strategy (Lepczyk et al. Reference Lepczyk, Mertig and Liu2004).
Many residents will be willing to assist in managing certain species if these are, for instance, nuisance roosting species that are messy and noisy, but considerably fewer residents will voluntarily deal with species that do not affect them directly (Kelly & Allan Reference Kelly and Allan2006). In this regard, the airfield operators could expand on our ranking of hazardous bird species by further categorizing species based on their nuisance to other sectors. For example, we identified Egyptian geese as extremely hazardous to aircraft, and this species is also considered a nuisance on smallholdings (Mangnall & Crowe Reference Mangnall and Crowe2001), golf courses (Mackay et al. Reference Mackay, Little, Amar and Hockey2014) and residential estates (Little & Sutton Reference Little and Sutton2013) due to damage caused by their faeces and feeding. There is an opportunity to share the responsibility of managing this species with stakeholders around the airfield if they also perceive the species as problem-causing (Clergeau et al. Reference Clergeau, Mennechez, Sauvage and Lemoine2001, Gaertner et al. Reference Gaertner, Larson, Irlich, Holmes, Stafford, van Wilgen and Richardson2016). A related framework exists for managing invasive species in Cape Town (Gaertner et al. Reference Gaertner, Larson, Irlich, Holmes, Stafford, van Wilgen and Richardson2016), which identifies management approaches based on the potential negative impact of a species and the public’s perception of its utility. Managing invasive species could also be beneficial for minimizing bird strikes. In other South African cities, for example, the hadeda ibis favours exotic over indigenous trees for nesting and roosting (Singh & Downs Reference Singh and Downs2016b), so removing these trees could reduce bird strikes (Byron & Downs Reference Byron and Downs2002). Integrating the invasive species management framework with one based on subcategories of hazardous species will not eliminate the difficulty of managing birds around the airfield, but it could make the task more practicable.
A caveat of our findings is that the probability of a bird strike is based on the abundance of a species despite one individual bird being capable of significant damage. For example, two bird species (the spur-winged goose, Plectropterus gambensis, and the Caspian tern, Sterna caspia) were recorded flying over the study area. Although these were likely vagrant individuals, it would be incredibly hazardous if they collided with an aircraft. The same applies to nocturnal bird species, which were not recorded during our survey. This highlights a limitation of our study in that there were no formal records of which species have collided with aircraft in the past. Effective bird control programmes depend on reliable collision records (ICAO 2012), but our discussions with aviation safety staff at Air Force Base Ysterplaat suggest that low awareness amongst pilots inhibits the accurate identification and reporting of bird–aircraft collisions. The shortage of reliable data on wildlife collisions is not unique to our study, however, because estimates suggest that pilots only report 15–20% of all bird strikes (Linnell et al. Reference Linnell, Conover and Ohashi1996, Kelly & Allan 2012). Even when incidents are reported, the reliability of these reports is questionable. Similar studies in southern Africa have reported that many bird strike records lacked reliable information of species identity or time of collision (Oribi Airport in South Africa: Byron & Downs Reference Byron and Downs2002), with 70–100% of all collision records containing no information on species identity (two airports in Namibia: Hauptfleisch et al. Reference Hauptfleisch, Avenant and Tsowaseb2013).
Conclusion
Even though urbanization did not increase the hazard of bird–aircraft collision at Air Force Base Ysterplaat, it does create unique management challenges. To mitigate these challenges, this airfield and others like it should become more active in participating in the EIA process of future developments. Where this is not possible, airfield operators could manage birds in the surrounding matrix by: (1) modifying existing and developing new deterrent techniques suitable for built-up environments;, (2) collaborating with landowners surrounding the airfield to manage hazardous birds that are also a nuisance to other sectors; and (3) streamlining the management of hazardous birds in the surrounding matrix by using predictive models of their movements and habitat requirements. Ultimately, birds continue to be potentially hazardous to the aviation industry, but rather than trying to eliminate this hazard completely, the aviation industry should focus on updating their sophisticated hazard rating systems to incorporate urbanization and other forms of environmental change.
Supplementary Material
For supplementary material accompanying this paper, visit www.cambridge.org/core/journals/environmental-conservation
Supplementary material can be found online at http://dx.doi.org/10.1017/S0376892918000231
Acknowledgements
We would like to thank Morgan Hauptfleisch, Doug Harebottle, Johan van Niekerk, Antón Pérez-Rodríguez and two anonymous referees for valuable feedback.
Financial Support
None.
Conflict of Interest
Roderick F. Jeffery is an employee of the South African Department of Defence, which manages Air Force Base Ysterplaat.
Ethical Standards
This study was approved by the Animal Research Ethics Committee of the University of the Free State (UFS-AED2016/0041). Permission to access the security area and property of Air Force Base Ysterplaat was provided by SAAF Headquarters (Directorate Operations Support and Intelligence Systems), as well as by the Officer Commanding Air Force Base Ysterplaat.