


Introduction
The McMurdo Dry Valleys encompass a ~4500 km2 ice-free region in southern Victoria Land, East Antarctica (Levy Reference Levy2013) (Fig. 1). Rock glaciers are numerous in this cold, hyper-arid region (Hassinger & Mayewski Reference Hassinger and Mayewski1983, Bockheim Reference Bockheim2014). Despite regional snowfall precipitation of ~10–100 mm water equivalent per year (Fountain et al. Reference Fountain, Nylen, Monaghan, Basagic and Bromwich2010), rock glaciers and debris-covered ice are able to form and survive, possibly for timescales of 105–106 years (Mackay et al. Reference Mackay, Marchant, Lamp and Head2014, Swanger et al. Reference Swanger, Babcock, Winsor and Valletta2019). The mechanism of rock glacier formation probably varies within the McMurdo Dry Valleys (Bockheim Reference Bockheim2014). A talus-derived model states that a rock glacier develops when boulders, sediments and interstitial ice collect along the base of talus slopes until the accumulated mass is sufficient to cause the ice to deform plastically (Haeberli et al. Reference Haeberli, Hallet, Arenson, Elconin, Humlum and Kaab2006). When debris is supersaturated with ice, the material deforms and creeps readily, whereas saturated or unsaturated debris experiences much higher internal friction and thus its interstitial ice (or ice cement) experiences reduced deformation. In a second model, rock glaciers form when glacial ice becomes covered by debris, yielding clean ice cores (Haeberli et al. Reference Haeberli, Hallet, Arenson, Elconin, Humlum and Kaab2006, Fukui et al. Reference Fukui, Sone, Strelin, Torielli, Mori and Fujii2008, Swanger et al. Reference Swanger, Babcock, Winsor and Valletta2019). Features fitting within this model are often called glacigenic rock glaciers or debris-covered glaciers.
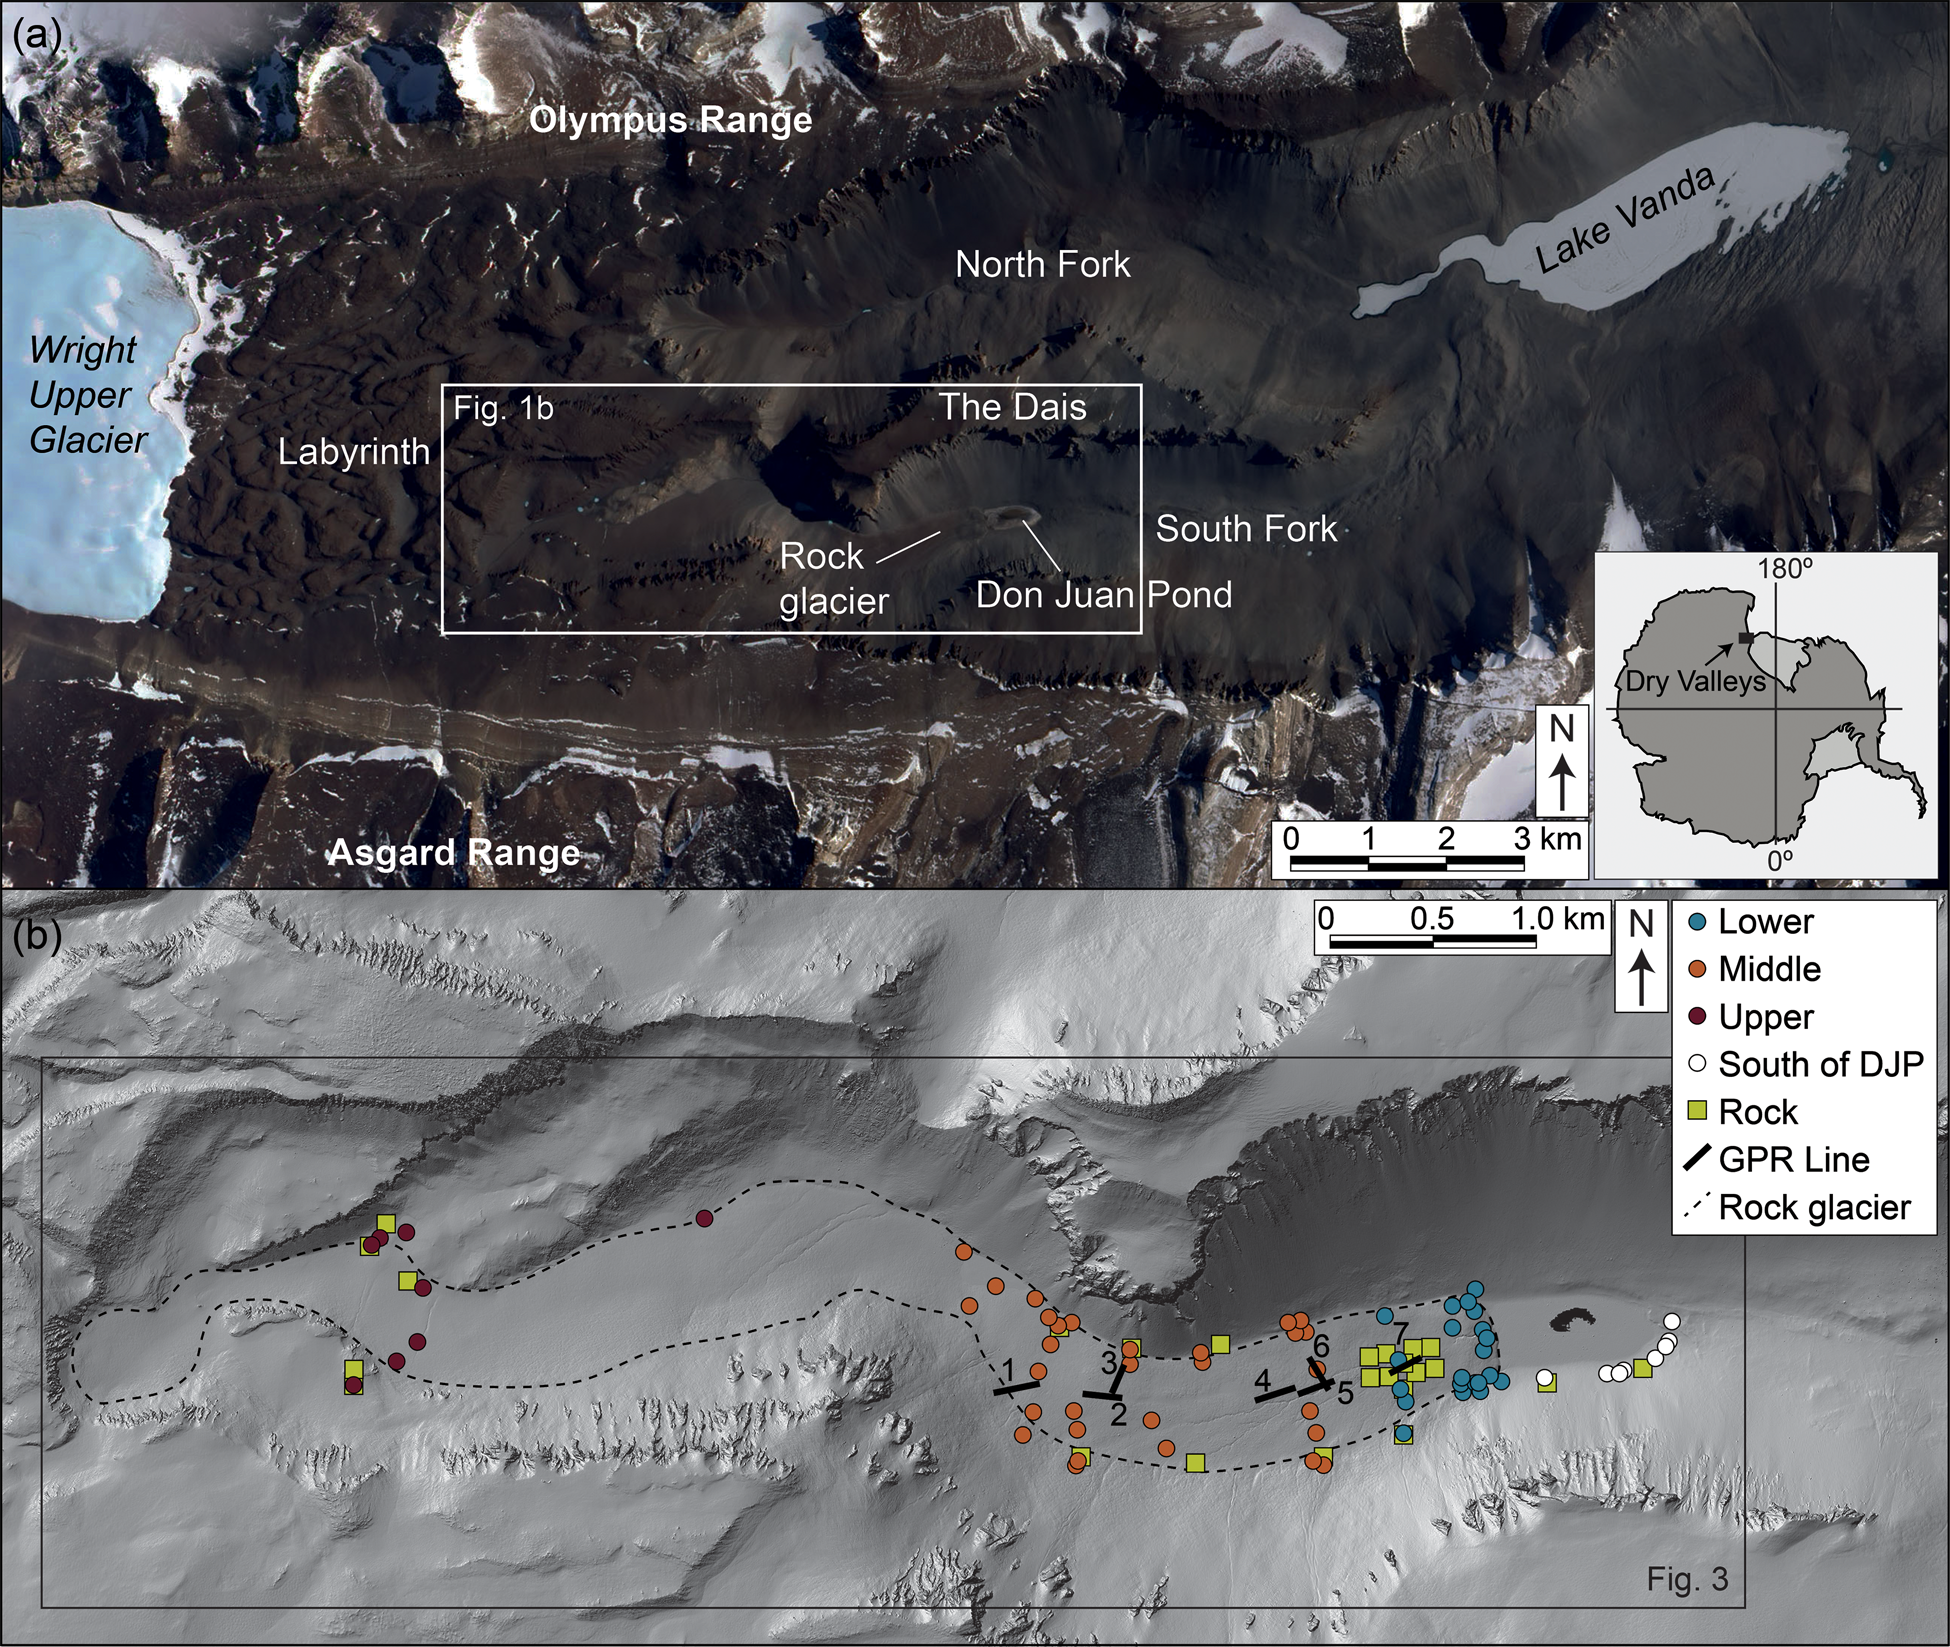
Fig. 1. a. Western Wright Valley, including position of Don Juan Pond (DJP) and South Fork. The white box outlines the location of b. Right inset shows the location of McMurdo Dry Valleys in Antarctica. Satellite imagery is open source from Landsat7 (18 December 1999). b. South Fork, showing rock glacier (dashed line) and all sediment and rock sampling locations. Shaded relief image from open source LiDAR elevation data provided by Fountain et al. (Reference Fountain, Fernandez-Diaz, Obryk, Levy, Gooseff and van Horn2017).
Complicating the characterization of rock glaciers in the McMurdo Dry Valleys is that ice cement is present year-round in the upper ~1 m of many McMurdo Dry Valley rock glaciers, and some (but not all) are cored by clean ice (Hassinger & Mayewski Reference Hassinger and Mayewski1983, Marchant & Head Reference Marchant and Head2007, Swanger et al. Reference Swanger, Marchant, Kowalewski and Head2010, Reference Swanger, Babcock, Winsor and Valletta2019). The presence of near-surface ice cement and/or clean ice is often evidenced by polygonal ground, which forms via contraction cracking of near-surface ice (Marchant & Head Reference Marchant and Head2007). Polygonal ground is the most common geomorphic feature in the McMurdo Dry Valleys and occurs even where ice cement appears to be out of equilibrium with the cold, dry climate (Marchant & Head Reference Marchant and Head2007, McKay Reference McKay2009).
In the McMurdo Dry Valleys, ice-rich and ice-cored rock glaciers might interact with surrounding landscapes via melting of subsurface ice, which could feed meltwater streams and ponds. Yet, there are few direct investigations of the geochemistry of rock glacier sediments, ice and/or streams in the McMurdo Dry Valleys. Here, we combine qualitative field observations, geophysical observations and geochemical analyses to characterize the surface and subsurface of a large rock glacier in Upper Wright Valley with implications for the presence of a regional, glacially dammed lake during the Last Glacial Maximum (LGM) and for modern geochemical influences from adjacent, hypersaline Don Juan Pond (DJP) (Fig. 1).
Geological and geomorphic setting
Modern climate
Cold and arid as a whole, the McMurdo Dry Valley climate generally varies with elevation and distance from the perennially ice-free Ross Sea (Marchant & Head Reference Marchant and Head2007). Upper Wright Valley experiences an average annual temperature of -19°C and a maximum high temperature of ~10°C (Doran et al. Reference Doran, McKay, Clow, Dana, Fountain and Nylen2002). In this low-elevation, inland region, minor meltwater production occurs in the summer and active-layer depths can reach 0.3–0.5 m (McLeod et al. Reference McLeod, Bockheim, Balks and Aislabie2009). Precipitation falls exclusively as snow, at a considerably lower rate than that of average annual sublimation in valley bottoms (Fountain et al. Reference Fountain, Nylen, Monaghan, Basagic and Bromwich2010). Aeolian redistribution can concentrate snow in topographic traps such as polygon troughs, stream channels and the lee of cliffs.
Topography and bedrock geology
The Transantarctic Mountains prevent incursion of the East Antarctic Ice Sheet into much of the McMurdo Dry Valleys, although three major outlet glaciers (Wright Upper, Taylor and Ferrar) do enter the valleys. Wright Upper Glacier terminates at an elevation of ~900 m above sea level (a.s.l.), ~5 km west of the head of the South Fork rock glacier. Between Wright Upper Glacier and the rock glacier is a rugged bedrock region, termed the Labyrinth, which is characterized by large anastomosing channels with ~100 m scale relief. East of the Labyrinth, Upper Wright Valley divides around the Dais (surface elevation of ~800 m a.s.l.) into North and South Forks, which drop from ~700 m a.s.l. to ~200 m a.s.l. in < 10 km. The narrow valley bottom and steep sidewalls of South Fork cause marked differences in received solar radiation and temperature gradients, with the south-facing wall experiencing more shade than the north-facing wall (Doran et al. Reference Doran, McKay, Clow, Dana, Fountain and Nylen2002).
The bedrock of South Fork is composed of acid plutonics, dolerite sills and sedimentary rocks, all of which are intruded by mafic dikes (McKelvey & Webb Reference McKelvey and Webb1962, Faure & Jones Reference Faure and Jones1973). The Neoproterozoic-aged Vida Granite and Dais Granite are present in the upper and lower elevations, respectively, of the slopes surrounding the rock glacier (Faure & Jones Reference Faure and Jones1973). Sandstones and subgraywackes of the Palaeozoic-aged Beacon Supergroup are exposed in the higher elevations above western Wright Valley, reaching into the Asgard and Olympus ranges (McKelvey & Webb Reference McKelvey and Webb1962). Mafic sills of the Jurassic-aged Ferrar Dolerite intrude the plutonic basement rocks, as well as the unconformity between the basement complex and the Beacon Supergroup. With the exception of the Beacon Supergroup units, all of the formations outcrop on the valley walls and contribute surface clasts to the rock glacier (Figs 2 & 3a).
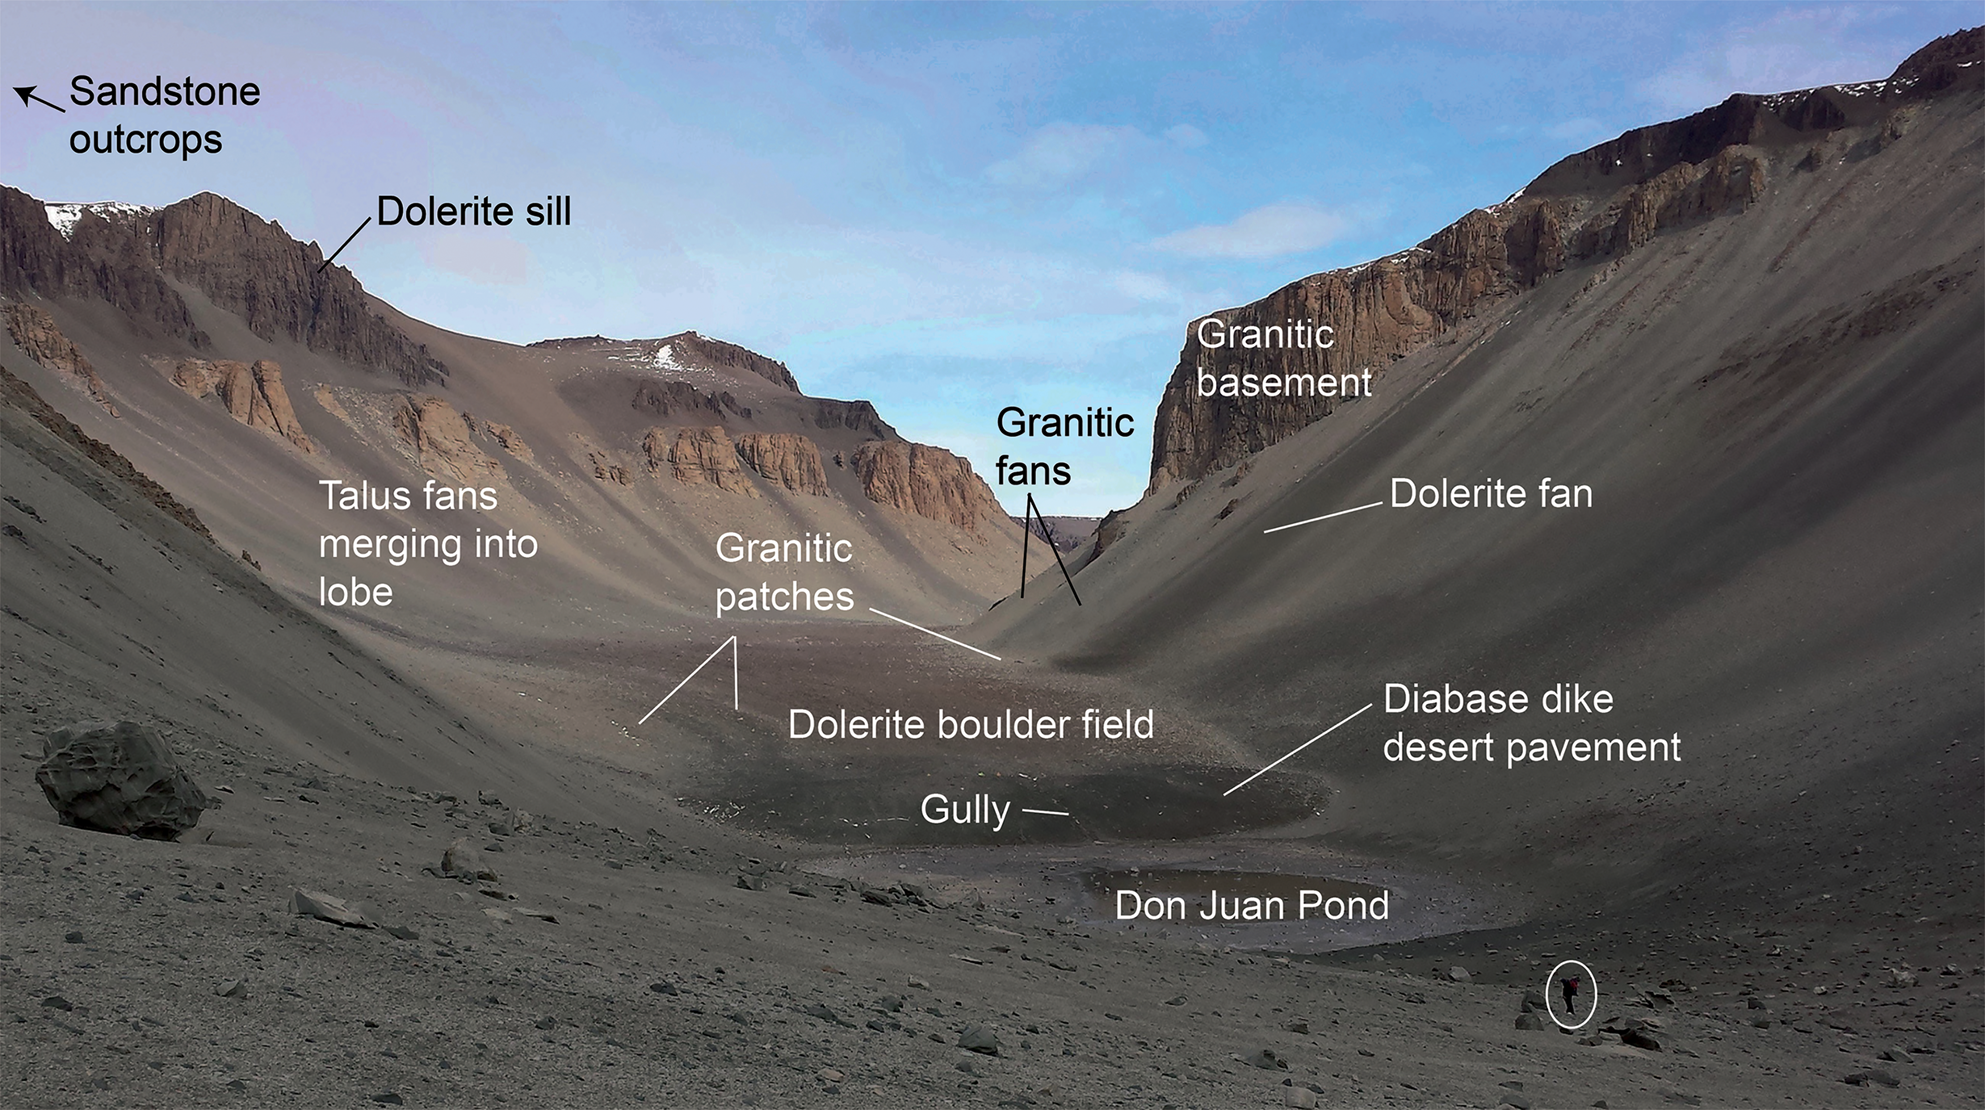
Fig. 2. Overview of the lower region of the rock glacier. Note the dispersion of light-coloured granitic boulders onto the dolerite-rich main body of the rock glacier. This view encompasses the lower and middle regions of the feature, as defined in Fig. 1b. The width of the rock glacier at the toe is ~450 m. The person in the foreground is circled for scale.
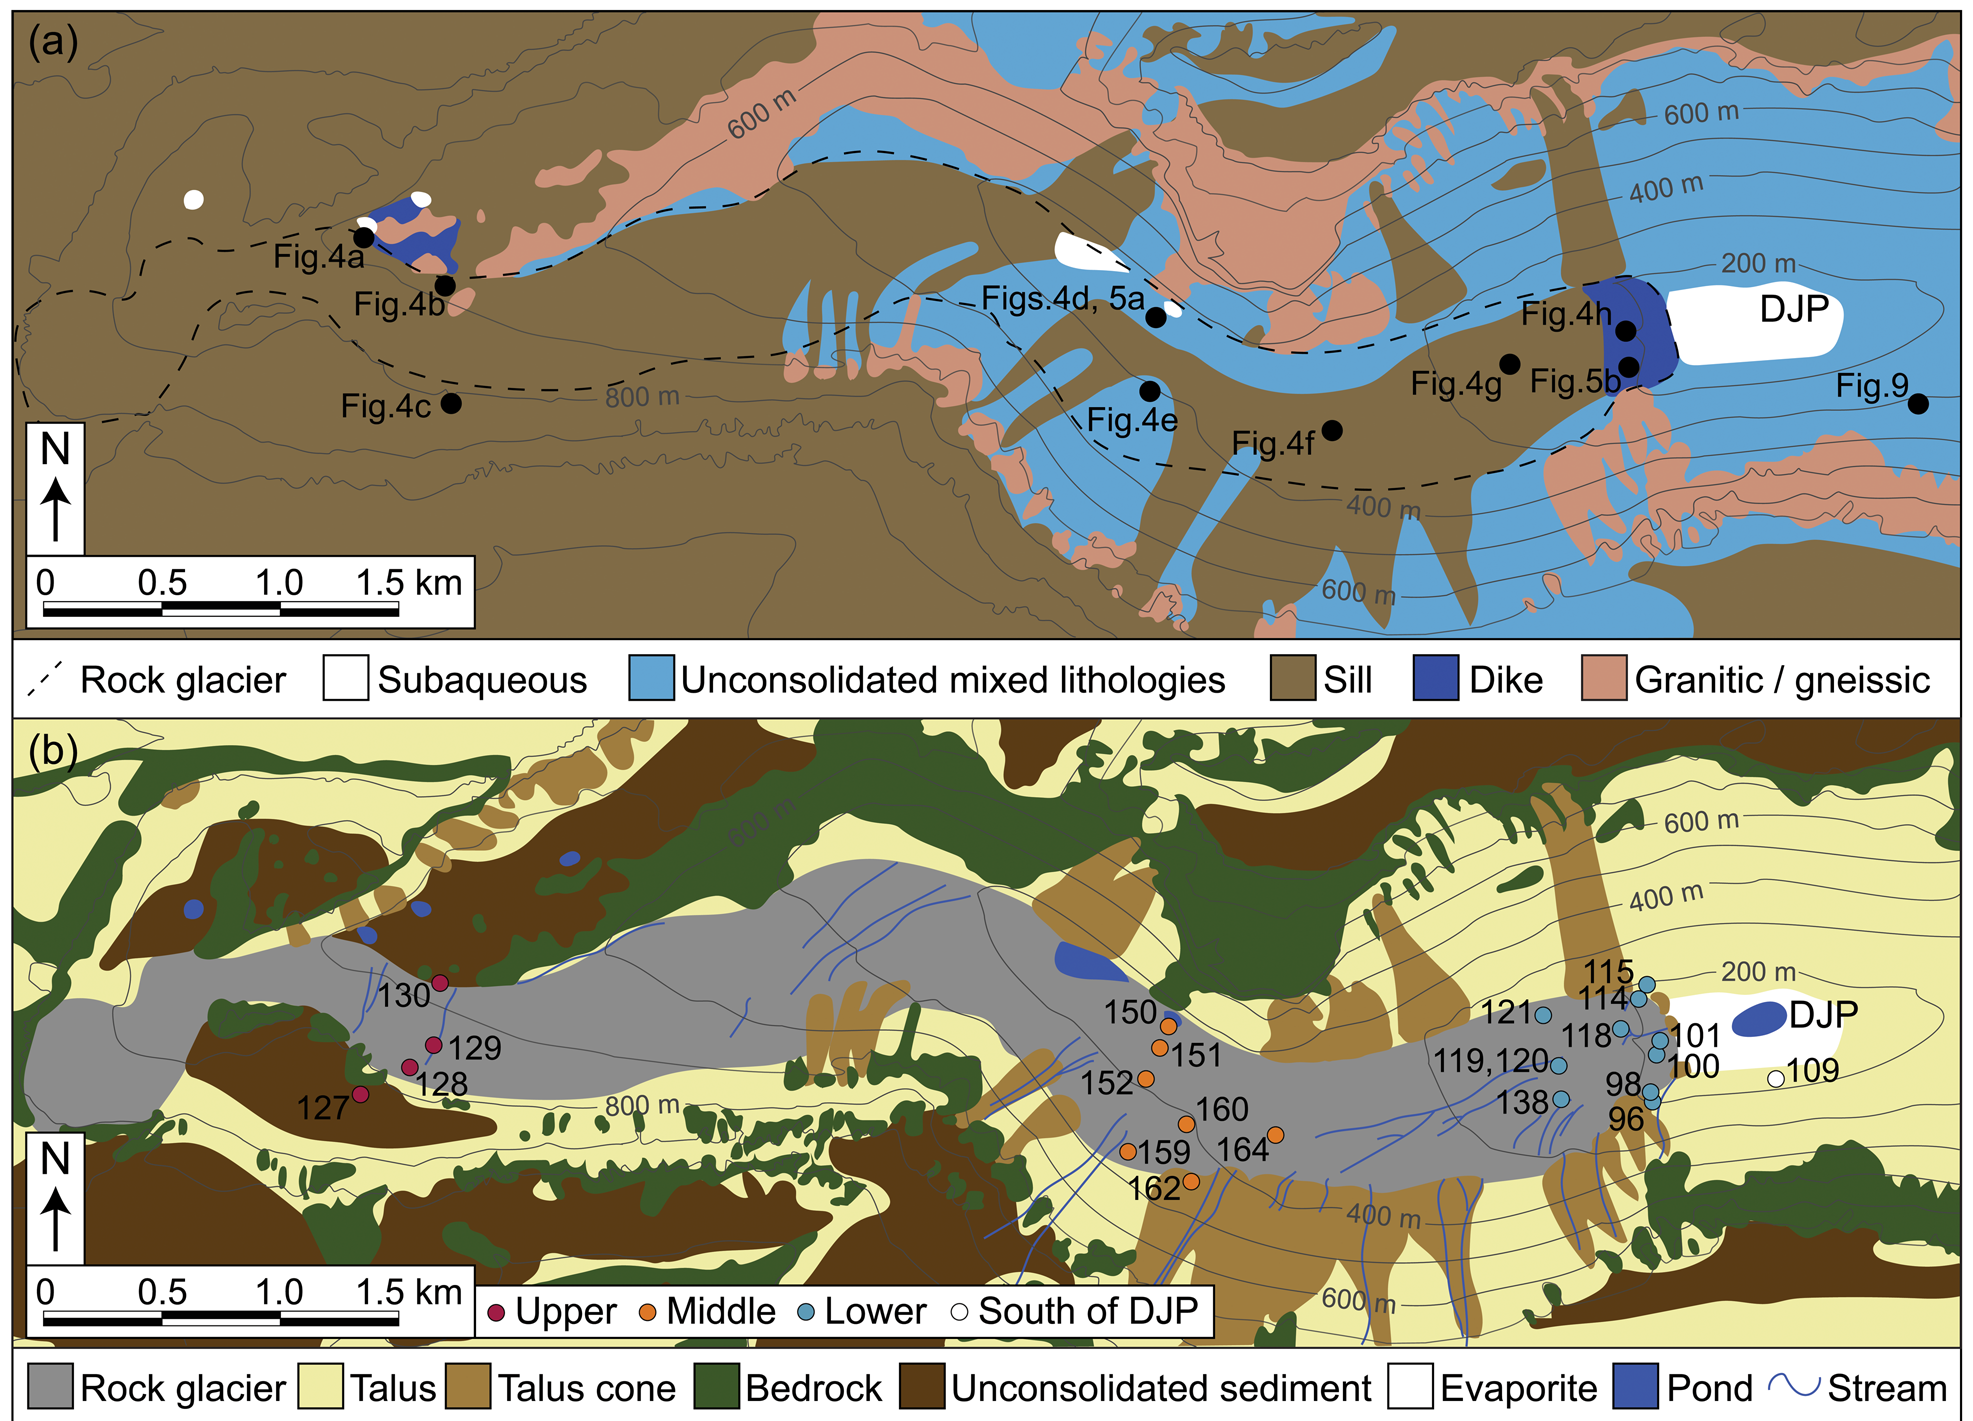
Fig. 3. a. Lithological map showing talus contributions to the rock glacier, along with exposed bedrock, and b. geomorphic map of the rock glacier and surroundings. Talus cones indicate gravity-driven deposits that originate from specific bedrock outcrops as opposed to mixed talus. The map location is indicated in Fig. 1b. Don Juan Pond (DJP) is labelled for reference. The contour interval is 100 m; data are from Fountain et al. (Reference Fountain, Fernandez-Diaz, Obryk, Levy, Gooseff and van Horn2017). Numbered dots in a. indicate locations of photographs in Figs 4, 5 & 9. Numbered samples in b. show selected sites of sediment leachate analysed for major ions (Table I).
Rock glacier geomorphology
At 7 km long, the South Fork rock glacier is one of the largest in the McMurdo Dry Valleys (Hassinger & Mayewski Reference Hassinger and Mayewski1983). The rock glacier curves between steep, talus-covered bedrock cliffs, and the main trunk has a gentle average surface slope that loses ~600 m of elevation eastward over its length. The ~450 m wide, ~17 m high toe of the rock glacier abuts DJP, the most saline natural surface water body in the world (Figs 1 & 2) (Cartwright & Harris Reference Cartwright and Harris1981). We separate the rock glacier (and adjacent talus slopes) into three broad sections for this study: lower, middle and upper. The lower rock glacier extends 550 m westward from the toe. It is characterized by a high-angle toe with incised stream channels, and then a flat region that experiences widespread near-surface saturation during the summer (as observed in the December 2014 and 2015 field seasons). The middle rock glacier extends from 550 m to 4 km upflow from the toe and is characterized by boulder-rich terrain incised by streams. The upper rock glacier extends from 4 to 7 km upflow from the toe, where the feature exhibits poorly defined lateral margins and lower boulder concentrations than the middle section.
Six ponds (currently ranging from 50 to 300 m in diameter) occur along/near the northern boundary of the rock glacier (Fig. 3b). Gullies incise the rock glacier in several areas (Fig. 3b). While gullies sourced from the southern slope are generally shallow, those found in the central rock glacier reach depths of > 2 m and are lined by angular boulders. Snowdrifts accumulate in these sheltered gullies and melt to produce liquid water that contributes to summer streamflow. The main gully system terminates in a small fan at the western edge of DJP.
Despite numerous studies of the soils and geomorphology of Wright Valley, the age of the rock glacier is unconstrained. Lewis et al. (Reference Lewis, Marchant, Kowalewski, Baldwin and Webb2006) demonstrated that the Labyrinth west of South Fork was probably incised by mid- to late-Miocene subglacial flooding with limited erosion since the Miocene. Conversely, central and lower Wright Valley contain evidence of multiple glacial advances from the Ross Sea during Plio-Pleistocene time (Hall & Denton Reference Hall and Denton2005), as well as glacially dammed Glacial Lake Wright during and after the LGM (Hall et al. Reference Hall, Denton and Overturf2001). If Glacial Lake Wright reached the maximum size proposed by Hall et al. (Reference Hall, Denton and Overturf2001) of 480 m elevation and 210 km2, much of South Fork would have been covered by the lake. Therefore, the rock glacier should either 1) be younger than the LGM or, 2) exhibit geomorphic, chemical and/or sedimentological evidence of submergence below this liquid water body (Bockheim & McLeod Reference Bockheim and McLeod2006).
Methods
Lithological mapping
We characterized the lithology of the rock glacier and of talus along the South Fork of Wright Valley using a combination of field observations, field photographs, hand samples and satellite imagery. Satellite data show distinct talus cones composed of lighter (gneisses and granitics) or darker (dolerite sill material) lithologies than the surrounding hillslopes (Figs 1a & 2). Although some lithological variation occurs at any given study location, we categorize rock type by the dominant component. For instance, a talus cone emanating from a Ferrar Dolerite sill would be classified as ‘dolerite’ despite minor incorporation of granitic boulders from outcrops below the sill. We classify the surface of the rock glacier based only on boulder and cobble composition.
Field sampling
We collected a total of 101 sediment samples from 75 locations between 24 November and 2 December 2015 (Figs 1c & 3b). Elevation and geographical coordinates for each sample are presented in Table SI. Sediment samples are classified by location: upper rock glacier (n = 11), middle rock glacier (n = 45), lower rock glacier (n = 33) and valley wall south of DJP (n = 12). The presence of ice cement almost exclusively confined sampling to the upper ~15 cm of the soil. At each site, we removed any surface cobbles prior to sampling, with a zero sampling depth representing the contact between pavement and soil. We used a clean, stainless steel trowel to gather sediments and stored them in sterile, airtight Whirl-Pak® bags. Subsets of the sediment samples were used for the major ion and X-ray diffraction (XRD) analyses. We collected 22 rock samples both from outcrops adjacent to the rock glacier and in the form of cobbles on and next to the rock glacier (Fig. 3b).
Ground-penetrating radar data collection and processing
We ran two north–south and five west–east survey lines, each measuring ~100 m, along the rock glacier using ground-penetrating radar (GPR) (Fig. 1). Surface roughness on the rock glacier is exceptional and presents an obstacle to GPR data acquisition. To the maximum extent possible, we moved surface clasts > ~0.1 m off the GPR transect prior to measurement in order to improve ground coupling (clasts were returned to their original positions after data acquisition). We recorded relative surface topography with a Brunton pocket transit for all surface elevation changes > ~1 m.
The GPR system used was a Geophysical Survey Systems, Inc. (GSSI) Subsurface Interface Radar (SIR) 3000 in conjunction with three antenna frequencies: 100, 200 and 400 MHz. The 200 and 400 MHz antennas were common-offset dipole antennas in a single housing unit, while the 100 MHz antenna was monostatic. All antennas were shielded. The system collected radar traces every 0.04, 0.10 and 1.00 m along the line for the 400, 200 and 100 MHz antennas, respectively. The system stacked four traces per record for the 100 MHz antenna, but did not stack during data collection for the other two frequencies. We used variable time windows for each antenna and survey during data collection, but we manually adjusted the system settings to ensure that the sampling rate was at least five times the Nyquist frequency to avoid aliasing (Annan Reference Annan, Rubin and Hubbard2005). We did not apply any filters during the data collection and used a time-invariant gain. Because the SIR 3000 will only collect data with a gain applied, we use the lowest possible setting, -20 dB.
We performed all data processing using Reflex-2D processing software (Sandmeier Reference Sandmeier2008). Basic data processing steps included the following: 1) distance normalization to correct for system positioning errors, 2) removal of the low-frequency carrier signal, also known as dewow, 3) time-zero correction to the peak amplitude of the first direct arrival, 4) bandpass frequency filter (100 MHz: 25-50-200-400 MHz, 200 MHz: 50-100-400-800 MHz, 400 MHz: 100-200-1000-2000 MHz), 5) spreading compensation (t1) gain, 6) background removal and, 7) time cut to the useful data window (Annan Reference Annan, Rubin and Hubbard2005).
For each radar transect, we converted the Brunton measurements into surface profiles in Matlab. We used the resulting profile data for topography migration and then topography correction to the calculated relative surface. Resulting uncertainties in relative elevations along the transects are probably on the order of ± 1 m. Mean interpreted velocity in the profiles used for all migrations, topography correction and subsequent time-to-depth conversion was ~0.13 m ns-1 based on standard diffraction hyperbola analyses. Although hyperbola analysis is prone to error in part due to unknown crossing angles of diffracting bodies, it agrees well with other reported radar velocities in similar rock glaciers (Farbrot et al. Reference Farbrot, Isaksen, Eiken, Kääb and Sollid2005). Cumulative positioning errors as well as velocity errors negatively impact the topography migration and topography correction. However, the final data product has reduced or eliminated diffraction hyperbolae and increased coherency of reflectors, signifying that our data processing routine does produce useful results for subsequent interpretation despite these and other errors. To estimate ice content, we used the Hanai–Bruggeman–Sen model (Jol Reference Jol2009) for porosity mixtures.
Major ion analysis
For major ion analysis of the soluble salt component in surface sediments, we collected 10 g subsamples from 28 of the air-dried samples (Fig. 3b). Sample locations were upper rock glacier (n = 5), middle rock glacier (n = 9), lower rock glacier (n = 13) and valley wall south of DJP (n = 1). Each subsample was placed in 50 ml of 18.2 MΩ water in a clean glass beaker and stirred for 1 min by hand. We then allowed subsamples to soak for 2 h with additional 1 min stirrings every 30 min (Sonmez et al. Reference Sonmez, Buyuktas, Okturen and Citak2008). This procedure yields a 1:5 sediment-to-water ratio, consistent with studies by soil scientists working in Antarctica (e.g. McLeod et al. Reference McLeod, Bockheim, Balks and Aislabie2009). While some researchers have used a lower ratio of sediment to water (e.g. Bisson et al. Reference Bisson, Welch, Welch, Sheets, Lyons and Levy2015), we used 1:5 to maintain consistency with field standards.
We decanted the leachate solution and filtered it using Whatman Puradisc 0.45 μm filter syringes into sterile centrifuge tubes. Due to silt/clay in some samples, a pre-filtering step with fine filter paper was also performed. Samples were analysed for major ions courtesy of Dr Fred Luiszer at the University of Colorado-Boulder Department of Geosciences. We analysed anions (Br-, Cl-, F-, NO3-, PO43-, SO42-) by ion chromatography. Because we were not able to measure carbonate species immediately after sampling, we did not include these anions in our analysis. After acidifying aliquots with 0.5% trace metal-grade HCl, we used inductively coupled plasma optical emission spectroscopy to analyse cation elements (Ca, Fe, K, Mg, Mn, Na, Si).
X-ray powder diffraction
We air-dried 39 sediment subsamples at room temperature and then powdered them by hand using an agate mortar and pestle for XRD analysis. Sample locations were upper rock glacier (n = 3), middle rock glacier (n = 10), lower rock glacier (n = 20) and valley wall south of DJP (n = 6). We loaded powders into a 16 mm diameter, 0.5 mm deep cavity cut into a 30 mm2 inert single crystal quartz zero background plate (Gem Dugout, State College, PA). We then scanned each sample at a rate of 2° min-1 over a 2θ range of 2–70° using a Scintag PAD X powder X-ray diffractometer with a Cu-Kα source (λ = 1.54 Å) energized at 45.0 kV and 40.0 mA. Peaks observed in the resultant diffraction patterns were compared with reference data from the ICDD Powder Diffraction File (PDF-2 Release 2004, searched using Thermo ARL Powder Diffraction Database Search Version 1.09, Build 60) and the WebMineral Mineralogy Database (www.webmineral.com) for the purposes of phase identification. Due to the similarities in the locations of diffraction peaks associated with many soluble salts, major ion analyses complemented the XRD identification of these phases.
Results
Field observations
On the toe of the rock glacier and on the northern margin of the middle to upper sampling area, surface cover is dominated by wind-polished and pitted, dark grey mafic dike cobbles with very few boulders (Figs 3a, 4h & 5). Wind polishing is observable on all exposed sides of cobbles in these areas, but because most cobbles are flat and low to the surface, polish is concentrated on the top face. Surface dike cobbles exhibit weathering pitting up to 0.8 cm in diameter (Fig. 5). Although occasional mafic dikes intrude into the granitic basement in the upper portion of the rock glacier, no such dikes are evident near the toe. Due to the small size of these dikes and the difficulty of field travel, Fig. 3a does not show in situ mafic dikes.
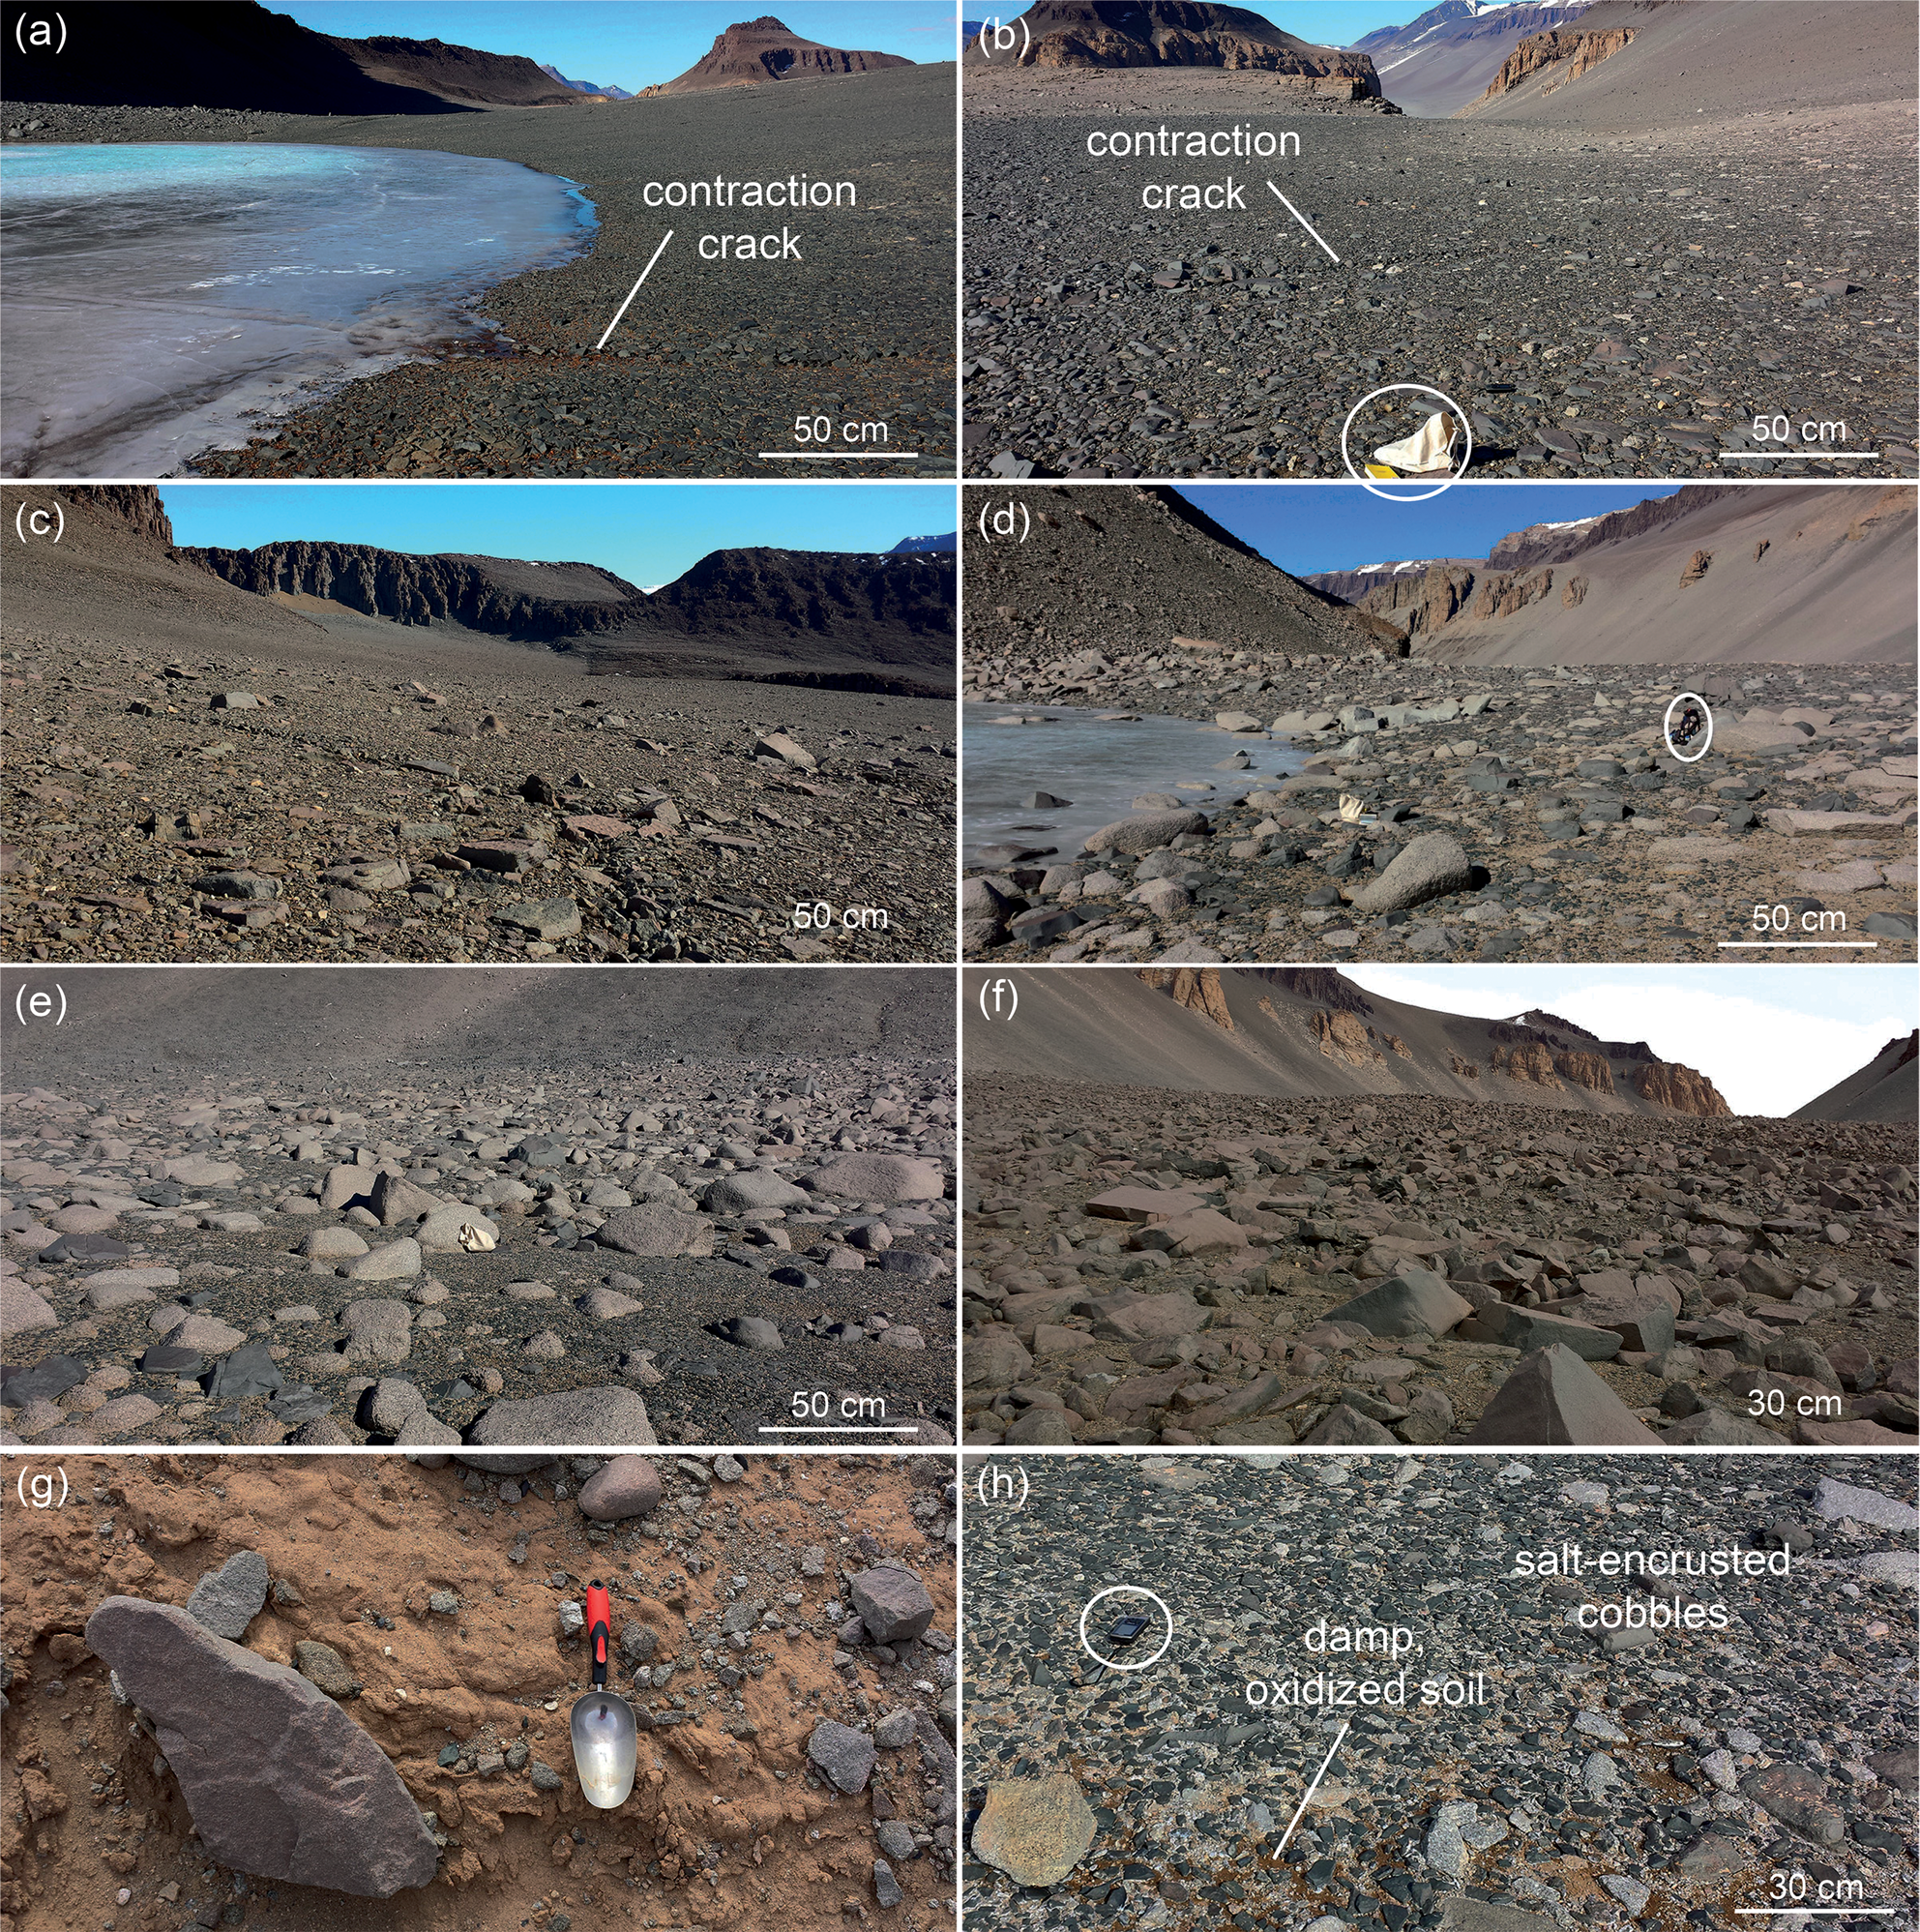
Fig. 4. Examples of rock glacier surface from west to east. Photograph locations are shown in Fig. 3a. a. Weathered, oxidized dolerite and mafic dike cobbles composing a stable surface at high elevation. b. Mafic dike cobbles with no boulders; ~30 cm bag for scale. c. Flat ground with phaneritic dolerite clasts. d. Shore of a small pond in a granitic region of the rock glacier; backpack for scale. e. Gneissic/granitic boulders and grus. f. Dolerite boulders with phaneritic crystals. g. Contraction crack exposing cemented sand. h. Desert pavement near rock glacier toe, with polished and pitted mafic dike cobbles; GPS unit for scale.

Fig. 5. Well-developed desert pavement surfaces composed of granitic and mafic dike cobbles with pitted surfaces along the a. middle and b. lower rock glacier. Photograph locations are shown in Fig. 3a.
At the highest elevation sampling sites above the main trunk of the rock glacier, oxidized dolerite clasts with low boulder coverage characterize much of the near-horizontal ground surface (Figs 3b & 4c). Abundant, poorly sorted sandstone cobbles that exhibit wind polishing and scalloping are present among the dolerites. This high-elevation surface exhibits shallow polygonal contraction cracking with minimal geomorphic evidence of downslope flow (such as polygon deformation or longitudinal/transverse ridges). Some permafrost-controlled size sorting is visible, with large cobbles and small boulders concentrated along contraction cracks. In this area, dolerite sill outcroppings are heavily oxidized to a deep reddish black, and weathering pits of < 1 cm diameter occur.
Phaneritic dolerite boulders and cobbles, sourced from the Ferrar Basement Sill, spill onto the rock glacier from the cliffs to the south. These densely packed clasts dominate the upper ground surface of the rock glacier (Fig. 4b), with the exception of areas of granitic-sourced rocks along the northern valley wall (Fig. 4d & e). There, granitic boulders and grus mix with mafic dike clasts, which are pitted and scalloped (Fig. 5a). Eastwards towards the toe of rock glacier, the ground surface is primarily densely packed phaneritic dolerite boulders resting on mixed felsic and mafic sediments (Fig. 4f). Occasional granitic boulders and sandstone cobbles are present, with granitic boulders exhibiting ventifaction.
The northern valley wall presently yields relatively little material to the rock glacier, hosting only small talus cones that terminate north of the rock glacier margin (Figs 2 & 3b). In most instances, a sand- and gravel-rich trough 1–3 m deep divides these cones from the rock glacier. In a few areas, fan-sourced boulders coat the trough. Mummified seal carcasses rest in the trough amidst boulders. The southern wall, in contrast, possesses numerous large talus fans that stretch onto and are incorporated into the rock glacier (Figs 3b & 6a). This incorporation is evident from both morphology and lithology: granitic fans yield granitic surface clasts, and this influence can be traced downflow along the rock glacier. The central and upper portions of the rock glacier are not distinguishable from the talus cones feeding into the feature, but rather merge seamlessly together (Figs 1c & 3b). Contraction crack polygons, present in most cones entering South Fork, are not morphologically disrupted by the transition from the steep valley wall onto the rock glacier surface (Fig. 6a).
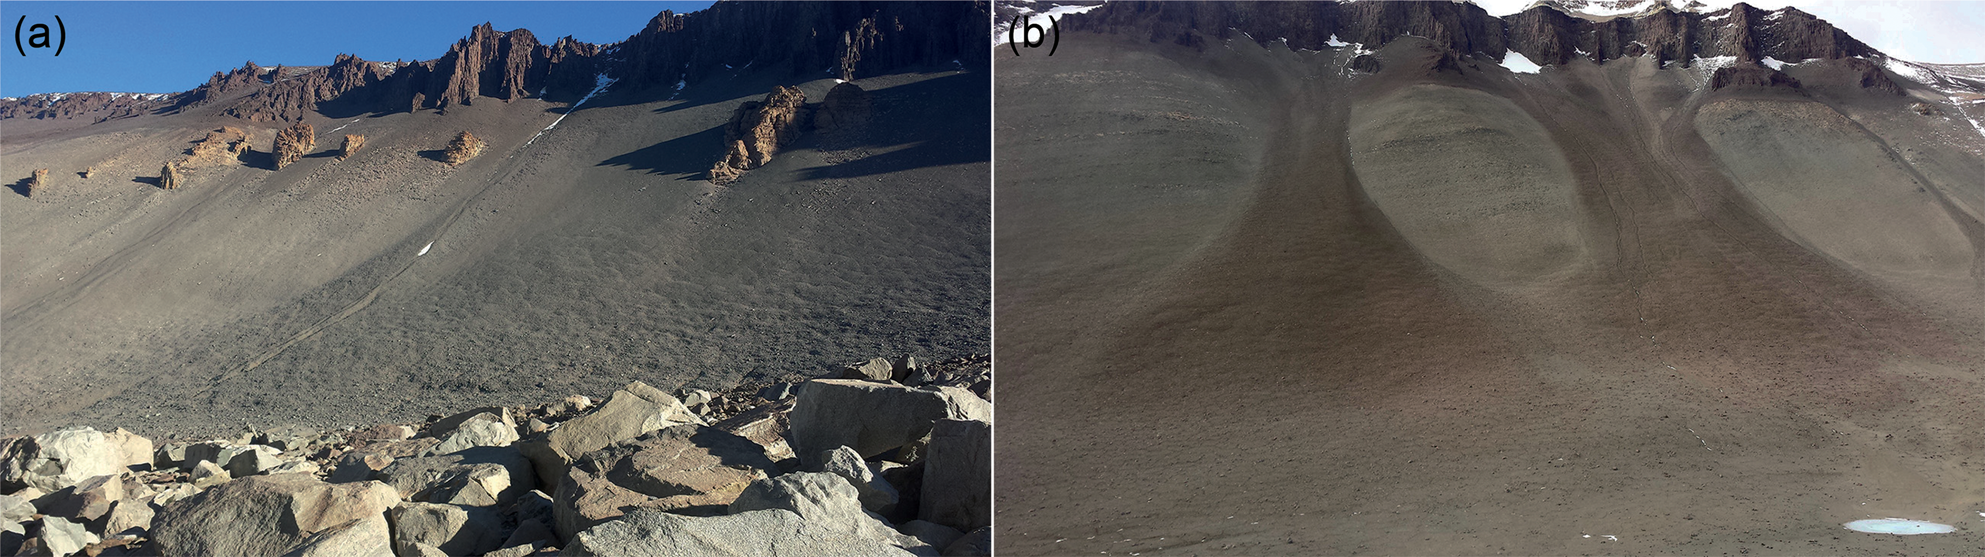
Fig. 6. Patterned ground in talus cones coming from the south valley wall into South Fork. a. Mixed lithology cone, sourced from granitic and dolerite bedrock. b. Dolerite cones ~6 km east of the rock glacier, but typical of dolerite cones in the rock glacier region.
Ice-cemented sediments were encountered at ~15–20 cm depths across much of the rock glacier. Contraction cracks also occur throughout the rock glacier, forming shallow (< 0.1 m) troughs in the regions dominated by mafic dike desert pavement and where dolerite sill cobbles form a flat surface (Fig. 4a, b & c). On the central rock glacier, where the surface slope is steeper and dolerite boulders abundant, contraction cracks reach depths of > 0.3 m. These deeper cracks are characterized by exposed pebbly sand, oxidized to an orange-brown and lightly cemented by salts (Fig. 4g). The salt cementation is restricted to several decimetres from the crack boundary, leaving the sand of polygon interiors loose and uncemented.
Ground-penetrating radar
In the 400 MHz radargrams, there are one to two well-defined internal reflection events in the upper 0.1–0.2 m. Below the lower boundary, multiple internal reflectors with variable coherency and signal strength are present throughout the radargrams (Fig. 7). Most of these reflectors have limited (< 2 m) horizontal continuity. Radar velocity estimated from the data (0.130 m ns-1) is almost 23% lower than ice velocity (0.168 m ns-1) and within 4% of the radar velocity given by quartz permittivity. The close agreement between our estimated velocity and rock (quartz) velocity implies that a limited amount of subsurface ice is present. Additionally, effective depth of penetration for our surveys (2 and 5 m for the 400 and 200 MHz antennas, respectively) is lower than that in ice-cored rock glaciers, where absorption and scattering losses are low (~0.01 dB m-1). Most of the GPR data are consistent with poorly sorted subsurface rock fill. Assuming spherical particles, ice-filled pore space and matrix permittivity between 5 and 8, using the Hanai–Bruggeman–Sen model for the porosity mixtures, radar velocity corresponds to a porosity between 30% and 50%. Compared to previously published results for GPR investigations of endogenous rock glaciers with clean ice, our data show few or none of the internally coherent reflectors that have been interpreted as debris layering within clean ice. Based on all of these data, we estimate < 10% of the surveys contained evidence for isolated clean-ice lenses (Fig. S1). The 200 MHz data from all surveys are included in the Supplementary Materials (Fig. S1).

Fig. 7. Ground-penetrating radar data (400 MHz antenna) from a. west–east Line 5 with a schematic showing interpretation of reflectors and b. west–east Line 7 (locations of lines are shown in Fig. 1b). The region lacking these reflectors (line positions 75–100 m) is associated with attenuation due to surface salinity rather than subsurface ice. c. Section of Line 5 showing a potential clean-ice zone and the interpreted ice cement reflector. d. Section of Line 7 showing characteristic plethora of internal reflectors and lack of coherency, which is probably characteristic of a debris-filled subsurface with minimal clean ice.
Major ion composition of soil leachate
Major ion analysis of leachate samples suggests that there is a strong trend in the concentration of soluble salts from the eastern toe to the western, upper rock glacier (Fig. 8 & Table I). Highest concentrations of F-, Cl-, SO42-, Ca2+, Na+ and K+ are found on the lower part of the rock glacier and on the low-elevation valley walls surrounding the toe. Several lower rock glacier samples yield maximum Ca2+ and Na+ leachate concentrations of > 300 mg kg-1 and Cl- concentrations of > 800 mg kg-1 (Table I). Lower concentrations of major ions are found in the western (middle and upper) portions of the rock glacier. Concentrations of Ca2+ in the upper sample leachates are < 0.8 mg kg-1, while middle region samples yield values of 0.4–17.0 mg kg-1. Sodium and chlorine ions are found in somewhat higher concentrations than Ca2+, but average values of upper and middle samples remain well below those on the lower rock glacier (Table I).

Fig. 8. Results from major ion analyses using the sample groupings listed in Table I. Ternary diagrams showing proportions of a. major cations and b. major anions from sediment leachate. Major ion geochemistry from Don Juan Pond (DJP) is from Torii et al. (Reference Torii, Murata and Yamagata1981).
Table I. Major ion concentrations of sediment leachate from South Fork rock glacier in mg kg-1.
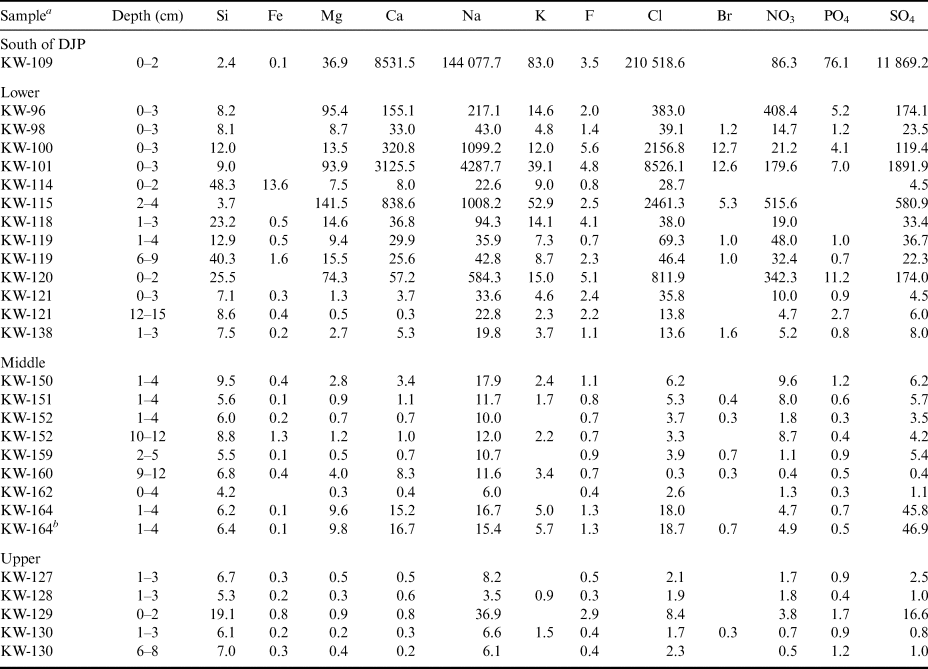
a Sample locations are shown in Fig. 3b. Where concentrations fall below detection limits or below 0.05 mg kg-1, cells are left blank. Samples are organized into south of DJP, lower, middle and upper locations shown in Figs 1 & 3. Mn is not shown due to space; it was < 0.2 mg kg-1 in all samples.
b Duplicate sample.
DJP = Don Juan Pond.
Major ion ratios are a result of the types of salts present in the leached samples, and they are shown in Fig. 8a (cations) and Fig. 8b (anions). Although each rock glacier sampling region is associated with scatter in cation ratios, the upper region has a generally higher ratio of (Na+ + K+):Mg2+ and (Na+ + K+):Ca2+ than the lower and middle regions (Fig. 8a). The one analysed salt-rich deposit on the lower valley wall south of DJP has much higher ratios of (Na+ + K+):Ca2+ than the pond water (mostly controlled by Na+). The middle and lower samples from the rock glacier trend towards the DJP composition compared to the upper samples. Figure 8b shows the anion data, which demonstrate a shift between middle/upper samples and lower samples. As with the cation data, relative percentages of anions in the lower rock glacier samples are more similar to DJP water (which is rich in chloride) than the upper and middle samples.
XRD analyses
Quartz, feldspar, diopside and halite correlate with the strongest XRD peaks for the 39 subsurface sediment samples that were analysed. In rock glacier and slope samples, quartz peaks are consistently the highest of all minerals. Feldspar peaks have a median of 10% of that of quartz, and pyroxene peaks have a median of 3% compared to quartz (Table II). Minor constituents include gypsum, thenardite/mirabilite, blödite (bloedite), sylvite, clays and micas (Table SII). Exposure to dry air above freezing drives the conversion of the hydrous mirabilite to the anhydrous thenardite, so we do not differentiate between these two minerals in our discussion. Salt-encrusted sediments collected low on the slope adjacent to the southern shore of DJP are predominantly halite, with some gypsum, quartz, pyroxene, feldspar, mirabilite/thenardite and blödite. On the rock glacier itself, salts are associated only with low-intensity peaks and are almost entirely composed of halite. While additional salt phases may be present (gypsum, mirabilite/thenardite and blödite), they are identified with moderate confidence and therefore their concentrations are probably low (Table SII).
Table II. Highest peak strength in counts per second for quartz, feldspar and pyroxene mineral groups.

a Sample list includes material from the rock glacier and surrounding slopes, organized by location (lower, middle and upper shown in Figs 1 & 3). Dashes indicate that no clear maximum peak was distinguished for that mineral.
b Relative intensities of feldspar to quartz and pyroxene to quartz are calculated.
c Highest peak for quartz (26.6–26.7°) missing from the data.
Discussion
Rock glacier structure and formation
Ground-penetrating radar results provide no evidence for the presence of extensive clean ice in the upper 2–5 m of the rock glacier, although limited, isolated ice lenses may be present (< 10% of the survey). The porosity estimates of 30–50% calculated using the Hanai–Bruggeman–Sen model (Jol Reference Jol2009) are more consistent with ice-cemented sediments that contain minor centimetre-scale ice lensing in the McMurdo Dry Valleys than massive ice or sediment-rich ice (Lacelle et al. Reference Lacelle, Davila, Fisher, Pollard, DeWitt and Heldmann2013). Well-defined boundaries observed in our GPR data represent the transition from 1) dry and sand-rich, to 2) thawed but damp and sand-rich, to 3) ice-cemented and sand-rich material (Fig. 7). Field excavations noting an ice cement surface at 0.1–0.2 m across the transects support this conclusion. The GPR data demonstrate little quantifiable change in sediment character from below the top of ice cement to the maximum depth of penetration at 2–5 m (Fig. 7). Field excavations, limited to < 0.4 m in depth, also failed to yield clean buried ice lenses.
A talus-derived model of rock glacier formation is supported both by our GPR interpretations and by the clear incorporation of abundant sediment and ice from the talus cones along the south valley wall. Because it is north-facing, the south talus wall receives more solar radiation than the north wall. The south wall also leads towards the high-elevation Asgard Range, with the potential to collect wind-blown snow in bedrock hollows and cirques (Dickson et al. Reference Dickson, Head, Levy, Morgan and Marchant2019), whereas the north wall leads to the 800 m-elevation Dais (Fig. 1). As such, the south valley wall should experience more frequent freeze–thaw cycles and receive a greater input of snow and meltwater, as evidenced by higher fluvial channel densities than the north wall (Fig. 3b). Thus, rates of physical weathering, debris production and creep should also be greater along the south wall, explaining its more dominant contribution of talus to the rock glacier.
Based on the GPR data and field investigations, the South Fork rock glacier contains ice-rich sediments (30–50% porosity if ice-filled, with isolated centimetre-scale ice lenses). This talus-derived model of formation distinguishes the rock glacier of South Fork from many of the other rock glaciers and viscous flow lobes in Taylor Valley, which have been shown to contain > 10 m-thick lenses of clean ice of glacial origin overlain by talus and fluvial sediments (Swanger et al. Reference Swanger, Marchant, Kowalewski and Head2010, Reference Swanger, Babcock, Winsor and Valletta2019). The demonstrated variation in the ice content and origin for viscous flow features in the McMurdo Dry Valleys provides a compelling analogue for the large viscous flow features on Mars, especially given recent insights into the possibility that some Martian features contain clean ice lenses at depth while others might not (Petersen et al. Reference Petersen, Holt and Levy2018, Brough et al. Reference Brough, Hubbard and Hubbard2019).
Estimating rock glacier surface age
There is no consistent observable trend in weathering extent and pavement development between the upper and lower portions of the rock glacier (Figs 4 & 7). Notably, the eastern toe of the rock glacier has a very similar mafic dike desert pavement to that of the flat region at the westernmost portion of our study area, just north of the upper rock glacier (Figs 3b & 4e). These well-developed pavements are indicative of stable intervals of surface exposure in an arid climate. Bockheim & McLeod (Reference Bockheim and McLeod2006) estimated Wright Valley glacial drifts with well-developed desert pavements to be Pliocene in age and deposits coated with stained, subangular boulders to be early to late Quaternary. Adopting their methodology but being more conservative, the surfaces with polished and pitted mafic dike cobbles and well-developed pavements (such as the rock glacier toe) probably predate the late Quaternary. Based solely on desert pavement development, the boulder-covered surfaces that characterize much of the middle and upper rock glacier are younger than the toe.
Fine sediment sources
We observe nearly identical sands (in mineralogy and leachate products) just below the cobbled surface of sites throughout the rock glacier (Figs 4 & 7). With the exception of halite-dominated deposits on the valley wall south of DJP (Fig. 2 & Tables I & SII), XRD-analysed sediments are composed primarily of quartz, with lesser amounts of feldspar and pyroxene, judging from peak strength. This general composition applies to locations on the rock glacier that are rich in gneissic and granitic boulders, as well as locations where boulders and cobbles are almost exclusively dolerites or mafic dike material (Figs 3a & 4).
Semi-quantitative XRD analysis of fine (< 20 μm) sediments from Ferrar Dolerite weathering on the central Transantarctic Mountains’ Lewis Cliff, near Beardmore Glacier, found that quartz composed only ~2% of the silt weathering products (McAdam et al. Reference McAdam, Leshin, Sharp, Harvey and Hoffman2005). While our mineralogical data are from the < 63 μm fraction of surface sediments, there is a marked difference between the quartz-poor weathering products observed near Lewis Cliff and the quartz-rich sands in South Fork. Therefore, we suggest that rock glacier sands are sourced primarily from physical weathering of granitic rocks rather than dolerites.
Implications for Glacial Lake Wright
The maximum elevation estimate for Glacial Lake Wright in eastern Wright Valley is ~480 m (Hall et al. Reference Hall, Denton and Overturf2001), which would have submerged the lower ~4 km of the South Fork rock glacier based on the modern topography and relief in the region. Biotite-rich sands are common in the shoreline and deltaic foreset deposits associated with the LGM and early Holocene lakes in lower Wright Valley (Hall et al. Reference Hall, Denton and Overturf2001). However, the subsurface sand hand samples from the South Fork rock glacier are devoid of visible biotite flakes, and a biotite signature appears rarely and at very low peak intensities in XRD analyses. In addition, little clay and silt is observed in the hand samples. The character of the subsurface sand is therefore inconsistent with that of the typical delta sands and glaciolacustrine deposits observed along the palaeo-shorelines and the base of LGM-aged Glacial Lake Wright (Hall et al. Reference Hall, Denton and Overturf2001). The mineralogy and grain size of the rock glacier sediments are not consistent with sedimentation associated with proglacial lake deposition, but desert pavement development and surface clast weathering do support an initial formation that predates the LGM. Therefore, we posit that the rock glacier was not subaqueously submerged during the LGM, or that the period of submergence was very transient, leaving little geomorphic evidence.
Salt distribution in rock glacier and implications for water tracks and DJP
Although dissolved calcium chloride salts characterize DJP itself, halite and gypsum are abundant on the shores (Torii et al. Reference Torii, Yamagata, Ossaka and Murata1977). This salt distribution is probably a result of changes in DJP volume and shoreline position. Such changes would concentrate mobile, soluble salts at lower elevations. Calcium chloride, being more mobile than NaCl, would therefore be more prevalent in the pond itself (Toner et al. Reference Toner, Catling and Sletten2017).
In Fig. 8a, we place measurements of major cations in sediment leachates in the context of DJP cation concentrations (Torii et al. Reference Torii, Murata and Yamagata1981). Sulphate salts (thenardite, blödite) are of relative importance in rock glacier surface sediments, whereas chlorides (halite, hydrohalite, antarcticite) are more important in DJP and on the adjacent slopes (Dickson et al. Reference Dickson, Head, Levy and Marchant2013). This observation is consistent with atmospheric deposition of seawater-derived aerosols to generate sulphate salts on the rock glacier surface, although SO42- could also be supplied by the small percentages of sulphide minerals in the Ferrar Dolerites (Melluso et al. Reference Melluso, Hergt and Zanetti2014).
Away from DJP, soluble salts decrease in abundance. The strong difference in leaching results between the lower portion of the rock glacier and the middle and upper portions (Fig. 8 & Table I) suggests either 1) enhanced salt input from DJP to the toe of the rock glacier and/or 2) increased salt abundance in the toe due to greater chemical weathering. The development of desert pavement on the lower rock glacier does suggest a longer period of surface exposure and weathering than the rest of the feature. However, the valley walls near the rock glacier toe, which are covered by relatively fresh dolerite and granitic talus, also exhibit high major ion concentrations (samples KW-96 and -115 in Table I). Additionally, high salt contents are not observed in the upper region north of the rock glacier, which, like the rock glacier toe, is dominated by pitted mafic dike cobbles and desert pavements. Thus, enhanced salt input to the lower rock glacier region is our preferred explanation for the observed trend in major ion concentrations.
Even though marine aerosols control McMurdo Dry Valley salt distribution as a whole (Keys & Williams Reference Keys and Williams1981), DJP is the most probable source for enhanced salt input to the lower rock glacier and surrounding valley walls. Given the 1) high concentrations of salt, 2) generally desiccated but variable water level and 3) frequent winds of > 20 m s-1 (Doran et al. Reference Doran, McKay, Clow, Dana, Fountain and Nylen2002), the pond should yield salts to the nearby environment. ‘Water tracks’, or zones of high soil moisture, are common throughout the McMurdo Dry Valleys, and specifically common in Don Juan Basin (Fig. 9). Where they occur, water tracks are enriched in solutes and are a significant component of the McMurdo Dry Valley hydrological system (Levy et al. Reference Levy, Fountain, Gooseff, Welch and Lyons2011). Dickson et al. (Reference Dickson, Head, Levy and Marchant2013) demonstrated that the deliquescence of CaCl2 salts within surface sediments along the southern slope of Don Juan Basin causes darkening of water tracks. This deliquescence is linked to seasonal fluctuations in temperature and relative humidity (Gough et al. Reference Gough, Wong, Dickson, Levy, Head and Marchant2017). If DJP acts as a significant source of ions to the adjacent slopes, the geochemistry and existence of DJP might influence both the salt composition and the persistence of these water tracks, which are important avenues for the transport of water, nutrients and solutes (Levy et al. Reference Levy, Fountain, Gooseff, Welch and Lyons2011). In this case, the area surrounding DJP, such as the South Fork rock glacier and the valley slopes, provides a unique chemical and ecological niche for future studies of dry, salt-affected, debris-rich ecosystems that may be found on other planets, such as Mars.
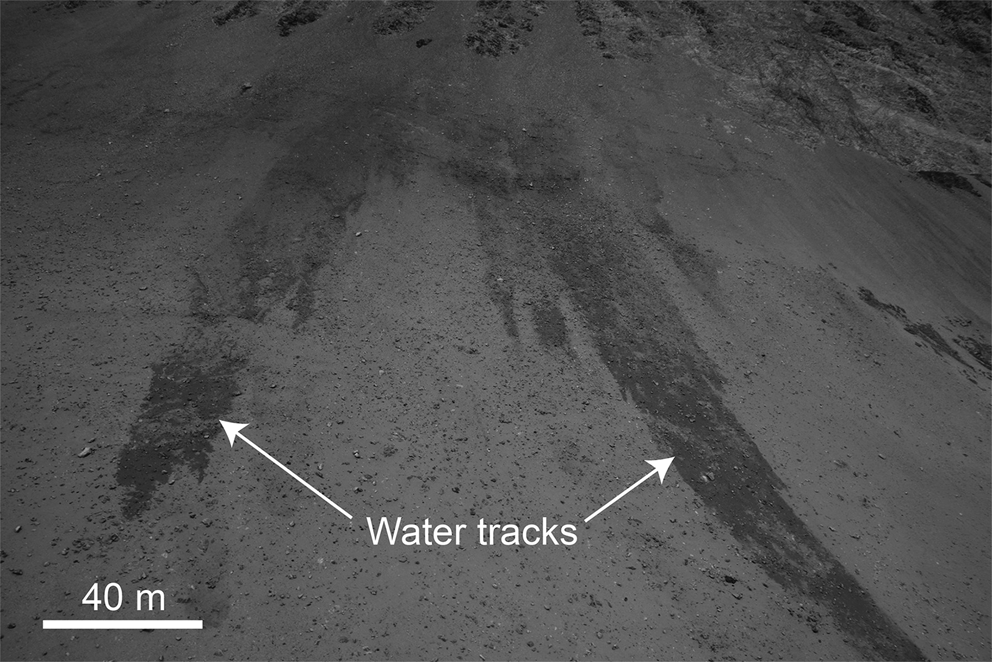
Fig. 9. Water tracks on the talus wall ~500 m south-east of Don Juan Pond. Photograph taken on 29 December 2014.
Conclusions
The South Fork rock glacier of Wright Valley, East Antarctica, shows no subsurface structure indicative of metre-scale clean ice lenses in the upper ~5 m, supporting a talus-derived formation model for the feature. Desert pavement formation and extensive physical weathering of source material are consistent with initial rock glacier formation that predates the late Quaternary. Despite this potential antiquity, the rock glacier preserves little to no geomorphic evidence for cover by an LGM lake, such as deltaic and fine-grained deposits. X-ray diffraction analysis of 39 near-surface samples reveals a quartz-dominated sand, with significant contribution of diopsides and feldspars. Results from 28 major ion analyses indicate Cl-, Na+ and Ca2+ as the primary ions available to water leaching. While soluble salt contents are low in the upper and middle portions of the rock glacier, samples from the lower rock glacier yield much higher ion concentrations. The primary source of these ions is probably adjacent DJP water and associated evaporite deposits, rather than in situ weathering. If the pond does act as an ion source for the rock glacier and surrounding valley walls, it may contribute to the persistence of saline water tracks found on the valley wall sediments.
Acknowledgements
The authors would like to thank Earl Ada for assistance and use of the Plastics Engineering XRD facility. Fred Luiszer (University Colorado Boulder) performed major ion analyses. Special thanks are given to the science support staff at McMurdo Research Station, including the personnel of Crary Laboratory, Helicopter Operations and the Berg Field Center. Finally, thanks are given to Warren Dickinson and one anonymous reviewer for their comments and suggestions, which greatly improved the manuscript.
Author contributions
KW, KMS, ELB and JLD contributed substantially to the writing of the manuscript. KW, KMS, ELB, JLD and RDV conducted fieldwork. KW led the leaching and XRD analyses. KMS framed and oversaw the research. ELB conducted the GPR analyses. DFS assisted with and oversaw the XRD analyses.
Financial support
We acknowledge the following funding source for support of this research: United States National Science Foundation Office of Polar Programs grant 1341284 to K.M. Swanger.
Supplemental material
Two supplemental tables and a supplemental figure will be found at https://doi.org/10.1017/S0954102020000139.


