INTRODUCTION
Cooperia oncophora is the most common intestinal nematode in cattle in temperate regions. Although natural infections rarely cause clinical parasitism, C. oncophora has been implicated in negative effects of gastrointestinal nematode infections on productivity (Ploeger et al. 1990 a,b; Ploeger & Kloosterman, 1993). In view of the development of improved control strategies against infection, there is a need for a more detailed knowledge on how immunity develops in infected animals. In natural field situations, not only development of immunity is important, but also persistence of immunity and the level of protection against re-infection. A recent survey among Dutch farms revealed that on almost 50% of the farms animals are treated with anthelmintics after housing (Ploeger et al. 2000). Consequently, they remain worm-free during the housing period and re-infection of yearlings occurs after turnout for the second grazing season. This suggests that animals need to retain the ability to respond to nematodes even when they have not been exposed for several months.
Until now, we and previous authors merely focused on primary infections with 100000 L3 larvae in 3-month-old calves (Parmentier et al. 1995; van Diemen et al. 1997; Kanobana et al. 2001, 2002). With this experimental protocol, animals can be subdivided into different responder types based on their ability to develop an effective immune response resulting in a decrease in egg output and expulsion of the worm population from the host (van Diemen et al. 1997; Kanobana et al. 2001). Recently, Gasbarre, Leigthon & Sonstegard (2001) described 3 types of responders in a herd based on the egg excretion following a natural infection with predominantly Ostertagia ostertagi. For both C. oncophora and O. ostertagi it has been shown that host genetics account for a substantial amount of variation in susceptibility to infection (Albers, 1981; Leighton, Murrell & Gasbarre, 1989; Kloosterman, Parmentier & Ploeger, 1992; Gasbarre et al. 2001). This seems to be the case for primary and secondary infections, as calves resistant to a single primary infection with Cooperia also showed a lower susceptibility to an homologous challenge infection (Albers, 1981).
Although we have no data on the genetic constitution of the animals we use, previous experiments demonstrated that there is substantial variation in the generation of acquired immunity among animals given a single oral dose of 100000 L3 (Kanobana et al. 2001, 2002).
Despite the different level of acquired and innate immunity, anthelmintic treatment followed by a single dose challenge infection shortly thereafter, resulted in no egg excretion in most of the primed animals (unpublished data). This occurred irrespective of their responder type. In infection trials, in which animals were primed with 100000 or 30000 L3 for a period of 35 days, followed by anthelmintic treatment and challenge infection, we observed that the low dose did not induce protection in all animals (unpublished data). These data suggested that priming with 30000 or 100000 L3 induced a different level of immunity and that a lower infection dose would enable us to discriminate between levels of resistance in primed animals.
In view of these data the current experiment was set up, in which we studied the anamnestic immunity after re-infection of animals which had been primed with C. oncophora. Low, intermediate and high responders were analysed separately to investigate whether the differentiation in responder types was sustained after a secondary infection. Furthermore, we compared a low (30000 L3) and a high (100000 L3) priming dose to study the dose dependency of the generation and persistence of immunity against C. oncophora and its effect on the establishment and the survival of the worms. A detailed analysis of parasitological and immunological parameters was done. This paper reports on the parasitological aspects of immunity observed in calves after re-infection with C. oncophora. The influence of the infection dose and the responder type on the resistance to a re-infection is highlighted.
MATERIALS AND METHODS
Animals and experimental design
Thirty-four female Holstein-Friesian calves were raised under helminth-free conditions on a commercial farm and purchased at 3 months of age. Animals were housed indoors during the whole period of the experiment at the animal facility of the Faculty of Veterinary Medicine in Utrecht. The animals were fed hay and water ad libitum as well as concentrate at a maximum of 500 g per day. Prior to infection animals were examined for general health condition and faeces were collected to check the worm-free status of the animals. A detailed scheme of the experimental protocol is given in Table 1. Animals of GC were kept as non-infected controls throughout the experiment to control for cross-infections between the groups. The animals were drenched with oxfendazole (Systamex 2·65% suspension, 2 ml/10 kg, Schering-Plough, Kenilworth, New Jersey, USA) at day 49 after infection (p.i.). All animals were around 6 months of age at the time of challenge. All experimental procedures were approved by the ethical committee on animal experimentation of the University of Utrecht.
If animals are related and the relationships are not accounted for in the statistical analysis misleading results can be generated (Kennedy, Quinton & van Arendonck, 1992). This is a particular concern when there are only a small number of animals in each group. As we were unable to rule out genetic relationships among animals in this study the results should be regarded as indicative rather than definitive.
Parasitology
The numbers of eggs per gram faeces (EPG) were determined with a McMaster technique with a sensitivity of 50 EPG (MAFF, 1986). Faeces were analysed once a week from day 0 to day 14 p.i. and during the period between treatment and secondary infection. In the remaining period, faecal samples were collected and analysed every 2 days. After slaughter the small intestine was subdivided in 6 different segments that were all processed separately as described previously (Kanobana et al. 2001). Briefly, the first segment consisted of the first meter starting from the pylorus and each following segment was 5 meters. Results are shown from the second (S2, proximal gut) and the last (S6, distal gut) segment. Two percent aliquots of the total worm burden were counted. A differentiation was made between male and female worms and fourth-stage larvae (L4). The L4 were predominantly (>95%) early stages and therefore considered as inhibited larvae. Worm lengths were measured from 20 individual male and female worms per segment if available. From each worm an individual picture was taken and length was determined using the software package Accuroute® version 1.1 (Critical path software, http://www.accuroute.co.uk). For each picture a calibration unit of 2 mm was set. Fecundity of the female worms was estimated by counting the number of eggs in 20 individual females per segment after lysis of the worms in 0·4% sodium hypochlorite solution (Kanobana et al. 2002).
Responder types.
The differentiation into low, intermediate and high responders was done based on parasitological and immunological parameters gathered in the first 42 days following primary infection (Kanobana et al. 2001). The same criteria were applied for the animals primary infected with 30000 or 100000 L3 larvae, however, the comparison of quantitative data such as cumulative EPG and antibody titres was done within G1 or G2. Briefly, a threshold in ratio EPG (ratio mean EPG day 35–42 p.i./mean EPG day 21–28 p.i.) was set at 0·4 which indicates a decrease in egg output of at least 60% by the end of the primary infection. Animals with a ratio EPG >0·4 and a high cumulative EPG (total egg output during the primary infection) were considered as low responders. Animals with ratio EPG <0·4 were considered as intermediate responders. High responders may show a ratio EPG taking any value, but show a significantly lower peak in egg excretion by day 21–28 p.i. concurrent with a low cumulative EPG. The discrimination in responder types was confirmed with the Cooperia adult-specific IgG1 ELISA (Kanobana et al. 2001). Intermediate and high responders had significantly higher Cooperia Ad-specific IgG1 titres by day 42 p.i., while in the low responders the antibody titres were elevated but did not significantly differ from the control animals (data not shown). The differentiation between high and intermediate responders was done based on the cumulative EPG that was significantly lower in the high responder animals. Low, intermediate and high responders were mutually compared during the primary infection and after the secondary infection and compared with the challenge control animals (G3).
Statistics
Statistical analysis was carried out using SPSS statistical package (version 10.0). Normally distributed data were analysed with ANOVA. Data that were not normally distributed were analysed with the non-parametric Mann–Whitney test or the Kruskal–Wallis test. If there was a significant difference by the Kruskal–Wallis test, pairwise comparison was done. To avoid false positive associations generated by multiple comparison the Bonferonni correction was applied.
Correlations between parameters were measured with the Pearson's correlation coefficient (normally distributed data) or the Spearman's rank correlation coefficient (non-normally distributed data). A General Linear Model (GLM) with repeated measures was used to analyse the effect of (i) priming dose, (ii) time-point (day after infection) and (iii) location in the gut on worm length. In the GLM analysis the proximal (S2) and the distal (S6) gut were defined as within factors and the infection dose and the time-point as between factors. Worm lengths of 20 individual female worms per calf were considered as pseudo-replicates within one animal and the mean worm lengths were used in the analysis. Prior to analysis, data were checked for normality and homogeneity of variance was tested with the Levene's test. These conditions were not fulfilled for worm fecundity and hence, related samples (S2 and S6) were analysed with the Wilcoxon sign test whereas 2 independent samples (time-point, day 14 versus day 28 p.c.) were analysed with the Mann–Whitney test and more independent samples (infection dose, 30000/100000, 100000/100000 and 0/100000 L3) were analysed with Kruskal–Wallis. The confidence level was set at P<0·05. The use of the sex ratio (% male worms) and the ratio EPG to assess host responsiveness has been described previously (Kanobana et al. 2002).
RESULTS
Egg output
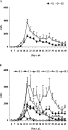
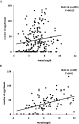
Figure 1A shows the egg output during the course of the primary infection (day 0 to 49 p.i.) in G1 and G2. In both G1 and G2 the egg excretion started around day 14 p.i. and reached a peak at day 21 p.i. but the rise in egg output was faster in G2 and the peak significantly higher (P<0·01). Although throughout the infection the egg output in G2 remained higher than in G1, the difference was not significant after day 21 p.i. This was mainly caused by an increased variability in egg output upon day 21 p.i. due to differences in the egg excretion patterns of low and intermediate responders. Figure 1B shows the egg output of the different responder animals within G1 and G2. The distribution of the responder types was as follows: in G1, 3 low responders and 7 intermediate responders were found, and in G2, 4 low and 6 intermediate responders were differentiated. Each group had only 1 high responder. In all responder types the onset of egg output was similar. Whereas the intermediate responders had no or a very low EPG at day 42 p.i., low responders still shed eggs in the faeces. Both high responders had a low egg output from day 21 p.i. onwards and no egg output at day 42 p.i.
Fig. 1. (A) Mean EPG (+S.E.M.) for G1 (primary infected with 30000 L3) and G2 (primary infected with 100000 L3). (B) Mean EPG (+S.E.M.) for the low (L), intermediate (I) and high (H) responders after infection with 30000 L3 (1) or 100000 L3 (2) is depicted.
Analysis of the EPG after challenge infection revealed that none of the animals were excreting eggs at day 14 after challenge (p.c.). At day 28 p.c. only 2 out of the 8 primed animals (1 animal of G1 and 1 animal of G2) were excreting eggs (cumulative EPG: 1350 and 3300 respectively) compared to the 3 challenge controls which all had EPG (cumulative EPG: 1300, 2750 and 2800).
At none of the time-points were eggs detected in the faeces of the non-infected control animals (GC).
Worm counts and differentiation
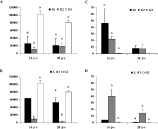
The influence of immunity on establishment of the worm population is illustrated in Fig. 2. No worms were recovered from the non-infected control animals. A significant reduction in worm burden was found in the primed animals (G1 and G2) compared to G3 at day 14 and 28 p.c. (P<0·05 for all, Fig. 2A). The magnitude of this reduction was similar in both primed groups, hence, for the analysis of the host responder types data from G1 and G2 were pooled. Analysis of the responder types revealed a significantly decreased number of worms in the intermediate responders compared to the challenge controls (G3) at day 14 p.c. (Fig. 2B). At day 28 p.c. a further decrease in worm burden of the intermediate responders was observed and the worm burden differed significantly from low responders and G3 (P<0·05 for both). The levels of the % L4 were complementary to the kinetics of the worm burden and a significant negative correlation was measured between both parameters (P<0·01, n=22, R=0·75, Spearman's rank correlation). At day 14 p.c. the % L4 was significantly higher in G1 and G2 compared to G3 (P<0·05 for both, Fig. 2C). A subsequent drop in % L4 at day 28 p.c. resulted in a still higher but not significantly different % L4 in the primed animals compared to the challenge controls. Similarly to the worm burden data, we observed no significant difference between both primed groups and data of G1 and G2 were pooled for the analysis of the host responder types. In the intermediate responders the % L4 was significantly elevated compared to low responders and G3 at both time-points. In both responder types a drop in % L4 was observed at day 28 p.c. compared to day 14 p.c. (Fig. 2D).
Fig. 2. (A) The mean worm burden (+S.E.M.) for the animals of G1 (30000 L3/100000 L3), G2 (100000 L3/100000 L3) and G3 (0 L3/100000 L3) at day 14 and 28 p.c. (B) Mean arithmetic worm burden (+S.E.M.) of low (L) and intermediate (I) responders compared with G3. (C) The mean % L4 larvae (+S.E.M.) recovered from the intestine of the animals from G1, G2 and G3 and (D) from L and I responders and G3. Different letters indicate significant differences within time-points as measured with Kruskal–Wallis and subsequent pairwise comparison. The confidence level was set at P<0·05.
Sex ratio
The mean sex ratio (% male worms) in S2 and S6 for the 3 infected groups is shown in Fig. 3. At day 14 p.c. the sex ratio in the animals of G2 was significantly reduced compared to G3 (P<0·05) in S2. At this time-point no worms were recovered from S6 of G3, hence this resulted in a sex ratio of 0. At day 28 p.c. the sex ratio in G1 and G2 was lower than in G3 in both the proximal and the distal gut.
Fig. 3. Mean sex ratio (% male worms, +S.E.M.) in the proximal (S2) and the distal (S6) gut for the animals from G1 (30000 L3/100000 L3), G2 (100000 L3/100000 L3) and G3 (0 L3/100000 L3) at day 14 and 28 p.c. If no worms were recovered, a sex ratio of 0 was assumed. Different letters indicate significant differences within S2 or S6 as measured with Kruskal–Wallis and subsequent pairwise comparison. The confidence level was set at P<0·05.
Distribution of the worm population in the small intestine
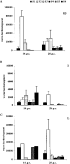
A decreased establishment often coincides with a relocation of the worms from their predilection site. Therefore, we analysed whether the decreased establishment in the intermediate responders also resulted in an altered distribution of the worm population throughout the gut. In the challenge control group (G3) the worms preferentially resided in the proximal gut at day 14 p.c. (Fig. 4A). At day 28 p.c. the number of worms in the proximal gut decreased compared to day 14 p.c. and a higher number of worms was recovered from the distal gut (Fig. 4A). In the intermediate responders we observed that besides a significant reduction in the worm burden, at day 14 p.c. worms were equally distributed throughout the entire gut (Fig. 4B). This seemed to be a feature of a secondary challenge since at this time-point worms were also recovered from the distal gut in the low responder animal (Fig. 4C). However, at day 28 p.c., in both low and intermediate responders, more worms were recovered from the proximal than from the distal gut.
Fig. 4. The distribution of the worm burden (+S.E.M.) throughout the different segments of the small intestine is shown for challenge control animals (G3, A), intermediate (B) and low responders (C) at day 14 and 28 p.c. For G3, each bar is the mean (+S.E.M.) of 3 animals at day 14 and 28 p.c. At day 14 p.c. 1 low responder animal and 5 intermediate responders were analysed. At day 28 p.c. 4 low and 4 intermediate responders were analysed.
Worm length and fecundity
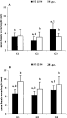
To assess if besides reduced establishment, immunity to C. oncophora also resulted in a stunted development of the adult worms, worm length and fecundity were measured. Worm lengths of both male and female worms were significantly correlated in the proximal gut (R=0·81, n=9, P<0·01 with n=number of animals from which both male and female worms were recovered) which suggested that immunity resulting in a reduced development acted similarly on male and female worms. This correlation could not be assessed in the distal gut as we did not find male worms in this segment at day 14 p.c. Therefore only the results of the female worms will be discussed. Figure 5 shows the mean worm lengths in the proximal and the distal gut of animals in G1, G2 and G3 at day 14 and 28 p.c.
Fig. 5. Mean length of female worms (+S.E.M.) recovered from the proximal (S2) and the distal gut (S6) of animals of G1 (30000 L3/100000 L3), G2 (100000 L3/100000 L3) and G3 (0 L3/100000 L3) at day 14 (A) and 28 p.c. (B). If present, 20 female worms per segment and per calf were measured. Different letters are used for significant differences within groups but between intestinal segments. Different numbers indicate significant differences between groups but within intestinal segment. Significant differences were measured with ANOVA. The confidence level was set at P<0·05.
A general linear model with repeated measures was used to investigate the effect of infection dose, time-point (day after infection) and intestinal location on worm length. The analysis revealed a significant effect of the time-point (P<0·01) but not of the primary dose on worm length. In addition, worm length was significantly influenced by the localization of the worms within the small intestine (P<0·01). To simplify the analysis we treated individual worm lengths as replicates within each group rather than replicates within each animal.
At day 14 p.c. worms of the proximal gut were significantly shorter in the primed animals compared to the challenge control animals (P<0·001) and the worms of G2 were significantly shorter than G1 (P<0·01; Fig. 5A). Worm lengths of G3 were approximately 10% shorter at day 14 than at day 28 p.c. while this difference was about 30% for G1 and G2. Comparison of worms of the proximal and the distal gut of the different groups revealed that worm length significantly differed between both segments at both day 14 and day 28 p.c. At day 14 p.c. worms of G3 were longer in the proximal gut than in the distal gut (P<0·001). The opposite was found for G2 (P<0·01) and the worm length of G1 did not differ between the proximal and the distal gut. At day 28 p.c. the worm length in the proximal gut of both G1 and G2 was reduced compared to G3, but the difference between G1 and G2 did not persist. Independent of the primary infection dose, at this time-point worms residing in the proximal gut were significantly shorter compared to worms recovered from the distal gut (P<0·001, Fig. 5B). For all groups a difference in worm length of approximately 25% was measured between worms of the proximal and the distal gut.
Similarly to the analysis of worm length, a first analysis of worm fecundity was done in which data within one calf were considered as replicates and mean value per calf were included in the analysis. Worm fecundity was not normally distributed and therefore, related samples (proximal versus distal gut) were analysed with the non-parametric Wilcoxon sign test, and independent samples were compared with the Mann–Whitney test for two independent variables (time-point) and with the Kruskal–Wallis test for more independent variables (primary infection dose). Using this approach, we measured an effect of the time-point after infection on worm fecundity (a significantly lower fecundity at day 14 p.c., P<0·05) but not of the infection dose, or the localization within the gut. Subsequently, to investigate the effect on worm fecundity independently of the different calves but related to the experimental scheme, all individual data were considered as separate replicates within one infection group. As expected an effect of the time-point on the worm fecundity was found (P<0·01) as day 14 p.c. coincides with the onset of the egg output, while at day 28 p.c. the peak in egg excretion is reached. The mean fecundity of the worms of the different groups at day 28 p.c. is shown in Fig. 6. This way of analysis revealed that the mean worm fecundity of the proximal gut was significantly lower in the primed (G1 and G2) animals than in the challenge control group (P<0·05). Comparison of the proximal and the distal gut within groups revealed that in all groups the fecundity in S6 was significantly lower than in S2 (P<0·05 for all). In addition, comparison of the fecundity in S6 between G1, G2 and G3, revealed that the number of eggs per female worm was significantly lower in worms from G2 compared to G1 and G3 (P<0·05).
Fig. 6. The mean number of eggs per female worm (+S.E.M.) for G1 (30000 L3/100000 L3), G2 (100000 L3/100000 L3) and G3 (0 L3/100000 L3) at day 28 p.c. If present, the fecundity of 20 female worms per segment and per calf was measured. Different letters are used for significant differences within groups but between intestinal segment (S2 or S6). Different numbers are used for significant differences between groups but within intestinal segment. Significant differences were measured with Kruskal–Wallis and subsequent pairwise comparison. The confidence level was set at P<0·05.
Worm length and fecundity did not significantly differ between responder types. But in the 2 low responders that were excreting eggs at day 28 p.c., worm length and fecundity were comparable to the challenge control animals and significantly higher compared to the other primed animals (P<0·001 for both). Figure 7 shows the relationship between worm length and fecundity in the proximal and the distal gut of the primed animals. In both cases a significant positive correlation was found but the relationship was relatively weak.
Fig. 7. The correlation between worm length and number of eggs per individual female recovered from the proximal (S2, A) and the distal gut (S6, B) in the primed animals is given. The Pearson's correlation coefficient (R) and the number of worms analysed (n) are shown in the graph.
DISCUSSION
Immunity to gastrointestinal nematodes can be defined in different ways. From the epidemiological point of view a reduced egg output is important as this will diminish further contamination of the field. The absence of egg output might result from a lower worm burden. However, as a consequence of reduced worm fecundity, a low egg output may concur with a high worm burden.
This experiment was performed to get more knowledge about mechanisms involved in immunity against re-infection with C. oncophora, more specifically the anamnestic immunity and the dose dependency of the immunological processes involved. In this paper we report on the different effects of immunity on a range of parasitological variables. Moreover, we investigated whether the more resistant phenotypes of high and intermediate responder animals compared to low responders, is sustained during a secondary infection. As we have to deal with the disadvantage that differentiation between responder animals can only be done after infection, a low number of animals within one group had to be analysed at certain time-points.
Distinction of responder types with a single oral dose of 30000 L3
A priori, it was expected that an infection with 30000 L3 would induce less protective immunity than with 100000 L3 and we expected a reduced ability to distinguish between the responder types with this lower dose. Priming with 100000 L3 resulted in a significantly higher egg output at day 21 p.i. but the significant difference in egg excretion between both doses did not prevail after the peak. The differences between the infection doses in the current experiment resembled more what was described for the comparison of 50000 and 100000 L3 (Frankena, 1987), than for comparison of 20 000 and 100000 L3 (Nieuwland et al. 1995). However, a specific problem in all these experiments was the high variation between the animals, which cannot easily be overcome in an outbred population. The capacity to discriminate between low, intermediate and high responders after a single oral infection with 30000 L3 suggested that the antigenic threshold required to provoke the development of acquired immunity in intermediate responder animals was reached with this infection dose. Analysis of the egg output in the responder animals revealed that independent of the infection dose, low responders were still excreting eggs at day 49 p.i., while intermediate and high responders were not.
Worm establishment is predominantly influenced by host responder type
Expulsion of adult nematodes in ruminants is a common manifestation of acquired immunity as a consequence of repeated infection and was reported for sheep infected with Haemonchus contortus (Barger et al. 1985; Balic, Bowles & Meeusen, 2002), Teladorsagia circumcincta (Seaton et al. 1989), Trichostrongylus colubriformis (Barnes & Dobson, 1990) and calves after continuous larval exposure to O. ostertagi (Michel, 1963). However, these studies did not investigate if the decrease in adult worm burden resulted from the development of immunity against larval stages or if a higher larval challenge resulted in a higher worm burden and hence a faster build up of immunity against adult stages. Alternatively, immunity can alter establishment by an effect on the larval stages. This can be by rapid expulsion of the incoming L3 in the first days after the challenge or by a delayed effect on L4 and L5 stages (reviewed by Miller, 1984; and Rothwell, 1989). Depending on the host–parasite system resistance to adult and larval stages develops concurrently (Seaton et al. 1989) or independently (Michel, 1963; Emery et al. 1992), but expulsion of adult nematodes might also occur as a result of immune mechanisms triggered by larval stages (Rothwell, 1989). The results of these studies indicate that the term ‘reduced establishment’ can refer to both larval and adult stages and that the distinction is not always very clear. In the current experiment reduced establishment was defined as the ability to establish as (juvenile) worms beyond the early L4 stage. Previous studies demonstrated that reduced establishment and survival of worms depended on the density of the infection or the rate of incoming larvae (Anderson & Michel, 1977; Barger et al. 1985; Barnes & Dobson, 1990). Herein, we were not able to measure a differential effect on worm establishment induced by the low (30000 L3) and the high (100000 L3) priming dose, but we cannot exclude that this was caused by the variability in response among the animals. This was further confirmed by the observation that analysis of the host responder types did reveal differences. The adult worm burden in the intermediate but not in the low responders was significantly reduced compared to the challenge control animals. Moreover, irrespective of the infection group, a low worm burden concurred with a relatively higher % L4. These findings indicated that animals which were more resistant to a primary infection remained more resistant after re-infection as indicated by reduced establishment. Nevertheless, the small reduction in worm burden of the low responders clearly suggested an effect of priming. Thus low responders showed an enhanced resistance as a result of the primary infection, but this occurred at a lower rate or with less efficiency than in intermediate responders.
A common mechanism of immunity is that, upon re-infection worms are redistributed proximal to or distal from their normal niche (Miller, 1984). Worm expulsion in the course of a primary infection with C. oncophora was characterized by a distal shift in the worm population at day 42 p.i. (Kanobana et al. 2001). In the current experiment worms were recovered from the distal gut of low and intermediate responders as early as day 14 p.c., which denoted that expulsion was ongoing in these animals. In contrast, at this time-point the establishment in challenge control animals was still around 100% and all worms resided in their predilection site, the proximal gut. At day 28 p.c. the proportion of worms recovered from the distal gut of the primed animals was lower than at day 14 p.c. Interpretation of the results of the low responders is difficult as we had only 1 low responder at day 14 p.c. but, the altered distribution and the lower total worm burden in intermediate responders at day 28 p.c., suggested that a high proportion of worms was already expelled. Logically, the expelled worms were residing distally from their usual niche at day 14 p.c. The accelerated expulsion of the adult worms in primed animals was further supported by the variation in sex ratio in the proximal and the distal gut of these animals.
In summary, the results discussed above demonstrated that the main effects on worm establishment differed between low and intermediate responders. Whether the immune mechanisms associated with a reduced establishment are also regulated by the infection dose when doses of 30000 and 100000 L3 are compared, cannot be excluded but would require a higher number of animals within one infection group to yield conclusive evidence.
Worm length is predominantly influenced by priming infection dose
The GLM procedure with repeated measures indicated no effect of priming dose, nor even an effect of priming as such. Subsequent analysis was performed in which individual worm lengths within one group were included in the analysis. This may give insight into biological processes that, independently of the individual properties of the animals, have an influence on worm length.
Whereas with this model the processes influencing establishment seemed to be largely primary dose independent, analysis of individual worm lengths within infection group after challenge revealed a significant effect of the primary infection dose but not of the host responder type. At day 14 p.c. a gradual decrease in worm length was observed when comparing worms of the proximal gut of challenge control animals with animals primed with 30000 and 100000 L3, suggesting that the growth rate of the worms (and hence their length) was influenced in a dose-dependent way. Interestingly, at day 28 p.c. no differences in length were observed between both primed groups. This suggests that the effect of the priming dose relates more to the temporal kinetics of worm development than to the attainable adult worm length as such. This conclusion only applied for the proximal gut of the animals, as in the distal gut, worm length was always comparable between the challenge control animals and both primed groups.
Comparison of the proximal and the distal gut among primed and challenge control animals revealed interesting differences. Although in the early part of the infection only a few worms were recovered from the distal gut of the challenge control animals, we assume that the observation that worms in the proximal gut were longer than worms in the distal gut reflected the normal situation. By day 28 p.c. the situation was reversed in all infection groups, however, this was already observed in the animals primed with 100000 L3 at day 14 p.c. The seminal observation that the morphology of the worms was altered (longer but thinner) suggests either (i) that the worms were damaged by the detrimental environment of the proximal gut and on their way to be expelled or (ii) that within the physiological environment of the distal gut worms do not succeed to develop similarly to within their preferential niche.
Is there a link among effects on worm length and fecundity in C. oncophora-infected calves?
There have been extensive studies on worm length and fecundity of T. circumcincta in sheep (Stear et al. 1997a; Stear, Strain & Bishop, 1999). In these studies worm length and fecundity were very well correlated and particularly worm length was affected by acquired immunity in a density-dependent manner (Stear et al. 1997 b). Based on our current observation i.e. longer worms with low fecundity were found in the distal gut compared to shorter worms with high fecundity in the proximal gut, we propose that at least part of the mechanisms involved in the regulation of worm length and worm fecundity differ, and consequently also their effect.
The fecundity of the worms of the primed animals was surprisingly high as only 2 animals excreted eggs in their faeces. Beside factors such as an unaltered sexual behaviour, spermatogenesis and oögenesis, faecal egg output also requires a functional egg-laying machinery of the worms. This merely depends on contractions of uterine and somatic muscles that make the eggs go down the uterus (Bird & Bird, 1991). The lack of relationship between egg output and worm fecundity in the primed animals suggests that, in contrast to our observations in primary infected animals (Kanobana et al. 2001), during the development of resistance to re-infection to C. oncophora these mechanisms may be influenced independently.
Conclusions
The data presented here suggest that the memory responses to re-infection with C. oncophora consist of immunological processes that may be influenced by the primary infection dose and that different components of parasite fitness are affected differently by prior exposure. In the current experiment, reduction in establishment did not differ between animals primed with 30000 or 100000 L3, yet, abrogation of development resulting in a stunted growth and reduced fecundity did. These observations seem contradictory to a recent report that described density-dependent effects of prior exposure to Strongyloides ratti on worm survival and establishment (Paterson & Viney, 2002). The level of prior exposure quantitatively reduced the establishment after subsequent challenge, but the authors did not find an effect of protective immunity on the fecundity or length of S. ratti. Similar observations were done following infection with Ostertagia spp. in calves (Ploeger et al. 1995). But as the effect of the primary infection dose in the current experiment mainly referred to the kinetics of an effect on worm length and fecundity, the different conclusions among the experiments might result from the analysis of variable time-points after infection or from variable kinetics inherent to each specific host–parasite system. Similarly, we currently only compared infections with 30000 or 100000 L3, hence, we do not exclude a different outcome with more, or less divergent dose levels.
Finally, the effect on the worm burden seemed to be regulated by the host's responder types. Based on the differences in worm establishment and distribution it is clear that the ability of intermediate responder animals to mount a more effective and faster immune response as compared to low responders is sustained after a secondary infection. A better distinction and understanding of the mechanisms which are regulated by an effect of the dose and the mechanisms which depend on the responder types, and likely the genetic background of the animals, will contribute to improved preventive control strategies.