Introduction
Functional imaging studies of schizophrenia have consistently implicated the prefrontal cortex but the nature of the dysfunction in this brain region is increasingly recognized as complex. The original finding of hypofrontality, though not consistently replicated in early studies, has been supported by meta-analysis, both at rest and during cognitive task performance (Hill et al. Reference Hill, Mann, Laws, Stephenson, Nimmo-Smith and McKenna2004). Further studies have documented a second form of frontal dysfunction: hyperfrontality, that is, increased activation during performance of working memory and other frontal-activating tasks (Manoach et al. Reference Manoach, Press, Thangaraj, Searl, Goff, Halpern, Saper and Warach1999; Callicott et al. Reference Callicott, Bertolino, Mattay, Langheim, Duyn, Coppola, Goldberg and Weinberger2000, Reference Callicott, Mattay, Verchinski, Marenco, Egan and Weinberger2003; Tan et al. Reference Tan, Sust, Buckholtz, Mattay, Meyer-Lindenberg, Egan, Weinberger and Callicott2006). This may be present simultaneously with hypofrontality, with the two having different prefrontal locations (see Glahn et al. Reference Glahn, Ragland, Abramoff, Barrett, Laird, Bearden and Velligan2005; Minzenberg et al. Reference Minzenberg, Laird, Thelen, Carter and Glahn2009). Alternatively, it has been suggested that which of the two abnormalities is seen depends on the demands of the task: hyperfrontality appears when the task is easy and patients ‘work harder to keep up’; however, schizophrenic patients reach their limit of performance earlier than controls and thereafter fail to activate their prefrontal cortex, resulting in hypofrontality at higher levels of task difficulty (Weinberger et al. Reference Weinberger, Egan, Bertolino, Callicott, Mattay, Lipska, Berman and Goldberg2001; Johnson et al. Reference Johnson, Morris, Astur, Calhoun, Mathalon, Kiehl and Pearlson2006; Tan et al. Reference Tan, Callicott and Weinberger2007).
More recently, a third form of frontal dysfunction has been found: failure of deactivation in the medial prefrontal cortex. This has been reported in several studies using a variety of different tasks (Pomarol-Clotet et al. Reference Pomarol-Clotet, Salvador, Sarro, Gomar, Vila, Martinez, Guerrero, Ortiz-Gil, Sans-Sansa, Capdevila, Cebamanos and McKenna2008; Whitfield-Gabrieli et al. Reference Whitfield-Gabrieli, Thermenos, Milanovic, Tsuang, Faraone, McCarley, Shenton, Green, Nieto-Castanon, LaViolette, Wojcik, Gabrieli and Seidman2009; Milanovic et al. Reference Milanovic, Thermenos, Goldstein, Brown, Gabrieli, Makris, Tsuang, Buka and Seidman2011; Salgado-Pineda et al. Reference Salgado-Pineda, Fakra, Delaveau, McKenna, Pomarol-Clotet and Blin2011; Schneider et al. Reference Schneider, Royer, Grosselin, Pellet, Barral, Laurent, Brouillet and Lang2011), sometimes in association with failure of deactivation in more posterior parts of the cingulate gyrus (Salgado-Pineda et al. Reference Salgado-Pineda, Fakra, Delaveau, McKenna, Pomarol-Clotet and Blin2011; Schneider et al. Reference Schneider, Royer, Grosselin, Pellet, Barral, Laurent, Brouillet and Lang2011). These regions overlap with the territory of the two midline nodes of the so-called default mode network, a series of interconnected brain regions that are active at rest or during the passive viewing of stimuli, but which deactivate during performance of a wide range of cognitive tasks (Gusnard & Raichle, Reference Gusnard and Raichle2001; Buckner et al. Reference Buckner, Andrews-Hanna and Schacter2008). Connectivity studies have also found evidence of default mode network dysfunction in schizophrenia (for a review, see Broyd et al. Reference Broyd, Demanuele, Debener, Helps, James and Sonuga-Barke2009).
Uncertainties exist about the relationship of frontal dysfunction to the clinical features of schizophrenia, one of which concerns its evolution over time; that is, whether it is a static ‘trait’ factor or whether it appears or worsens with illness progression. In their meta-analysis, Hill et al. (Reference Hill, Mann, Laws, Stephenson, Nimmo-Smith and McKenna2004) found support for resting hypofrontality in chronic schizophrenic patients (pooled effect size of 0.34 in 20 studies) but not in those with a duration of illness of less than 2 years (pooled effect size of −0.12 in eight studies). However, Van Snellenberg et al. (Reference Van Snellenberg, Torres and Thornton2006) found no relationship between dorsolateral prefrontal cortex (DLPFC) activation and duration of illness in a meta-analysis of 30 studies.
Another way of investigating this issue is by examining first-episode schizophrenic patients. Some such studies have found reduced activation compared to baseline in the DLPFC (Barch et al. Reference Barch, Carter, Braver, Sabb, MacDonald, Noll and Cohen2001; Mendrek et al. Reference Mendrek, Laurens, Kiehl, Ngan, Stip and Liddle2004; Boksman et al. Reference Boksman, Theberge, Williamson, Drost, Malla, Densmore, Takhar, Pavlosky, Menon and Neufeld2005; Snitz et al. Reference Snitz, MacDonald, Cohen, Cho, Becker and Carter2005; Tan et al. Reference Tan, Choo, Fones and Chee2005) and/or other prefrontal areas (Boksman et al. Reference Boksman, Theberge, Williamson, Drost, Malla, Densmore, Takhar, Pavlosky, Menon and Neufeld2005; Broome et al. Reference Broome, Matthiasson, Fusar-Poli, Woolley, Johns, Tabraham, Bramon, Valmaggia, Williams, Brammer, Chitnis and McGuire2009). Others, however, have found no (Rasser et al. Reference Rasser, Johnston, Lagopoulos, Ward, Schall, Thienel, Bender, Toga and Thompson2005; Schneider et al. Reference Schneider, Habel, Reske, Kellermann, Stocker, Shah, Zilles, Braus, Schmitt, Schlosser, Wagner, Frommann, Kircher, Rapp, Meisenzahl, Ufer, Ruhrmann, Thienel, Sauer, Henn and Gaebel2007; Whitfield-Gabrieli et al. Reference Whitfield-Gabrieli, Thermenos, Milanovic, Tsuang, Faraone, McCarley, Shenton, Green, Nieto-Castanon, LaViolette, Wojcik, Gabrieli and Seidman2009; Woodward et al. Reference Woodward, Waldie, Rogers, Tibbo, Seres and Purdon2009; van Veelen et al. Reference van Veelen, Vink, Ramsey and Kahn2010; Nejad et al. Reference Nejad, Ebdrup, Siebner, Rasmussen, Aggernaes, Glenthoj and Baare2011) or only marginal (Scheuerecker et al. Reference Scheuerecker, Ufer, Zipse, Frodl, Koutsouleris, Zetzsche, Wiesmann, Albrecht, Bruckmann, Schmitt, Moller and Meisenzahl2008) reduced prefrontal activation. Three of these studies found evidence of hyperfrontality in first-episode patients (Schneider et al. Reference Schneider, Habel, Reske, Kellermann, Stocker, Shah, Zilles, Braus, Schmitt, Schlosser, Wagner, Frommann, Kircher, Rapp, Meisenzahl, Ufer, Ruhrmann, Thienel, Sauer, Henn and Gaebel2007; Whitfield-Gabrieli et al. Reference Whitfield-Gabrieli, Thermenos, Milanovic, Tsuang, Faraone, McCarley, Shenton, Green, Nieto-Castanon, LaViolette, Wojcik, Gabrieli and Seidman2009; Woodward et al. Reference Woodward, Waldie, Rogers, Tibbo, Seres and Purdon2009). Deactivations have so far been reported in only a few studies (Tan et al. Reference Tan, Choo, Fones and Chee2005; Whitfield-Gabrieli et al. Reference Whitfield-Gabrieli, Thermenos, Milanovic, Tsuang, Faraone, McCarley, Shenton, Green, Nieto-Castanon, LaViolette, Wojcik, Gabrieli and Seidman2009; Nejad et al. Reference Nejad, Ebdrup, Siebner, Rasmussen, Aggernaes, Glenthoj and Baare2011).
The aim of this study was to further investigate previous findings of hypo- and hyperactivation and failure of deactivation in a sample of patients with a first episode of non-affective functional psychosis. We also examined to what extent these changes might have predictive value for schizophrenia as opposed to other diagnoses within the schizophrenia spectrum.
Method
Subjects
The patient sample consisted of 30 patients with a first episode of non-affective functional psychosis who were recruited from two psychiatric hospitals in the Barcelona area. They were all experiencing their first onset of psychosis and had a duration of psychotic symptoms of no more than 18 months (although we allowed a longer duration of non-specific prodromal symptoms). Patients were excluded if: (i) they were aged <18 or >65 years, (ii) they had a history of brain trauma or neurological disease, or (iii) they had shown alcohol/substance abuse or dependence within the 6 months prior to participation. A further exclusion criterion was the presence of a DSM-IV affective psychotic diagnosis (mania, hypomania, major depression with psychotic symptoms) either at initial presentation or at follow-up. All patients were right-handed.
The patients underwent diagnostic evaluation at the time of admission using the Spanish version of the SCID. Symptoms were also scored using the Positive and Negative Syndrome Scale (PANSS). Where possible, the patients were reassessed 6 months after discharge from hospital, in most cases with a family member.
Pre-morbid IQ was estimated using the Word Accentuation Test (Test de Acentuación de Palabras, TAP; Del Ser et al. Reference Del Ser, Gonzalez-Montalvo, Martinez-Espinosa, Delgado-Villapalos and Bermejo1997), a word reading test requiring pronunciation of Spanish words whose accents have been removed. Patients were also required to have a current IQ in the normal range (i.e. ⩾70), as measured using four subtests of the Wechsler Adult Intelligence Scale III (WAIS-III: vocabulary, similarities, block design, and matrix reasoning). The patients were given two well-standardized tests of executive function and memory: one was the Behavioural Assessment of the Dysexecutive Syndrome (BADS; Wilson et al. Reference Wilson, Burgess, Emslie and Evans1996), which gives an overall ‘profile’ score based on performance on six different subtests. The other consisted of four subtests of the Wechsler Memory Test (WMS-III; Wechsler, Reference Wechsler1997) (logical memory, faces, digit span, letter–number sequencing); scaled scores on these subtests were summed to give an overall score.
The control sample consisted of 28 healthy individuals selected to be age-, sex- and estimated pre-morbid IQ-matched to the patients. They also met the same exclusion criteria. Subjects were recruited from non-medical staff working in the hospital, their relatives and acquaintances, plus independent sources in the community. They were questioned and excluded if they reported a history of mental illness and/or treatment with psychotropic medication.
All participants gave written informed consent. The study was approved by the local research ethics committee.
Procedure
The participants performed a sequential-letter version of the n-back task (Gevins & Cutillo, Reference Gevins and Cutillo1993). Two levels of memory load (1-back and 2-back) were presented in a blocked design manner. Each block consisted of 24 letters that were shown every 2 s (1 s on, 1 s off) and all blocks contained five repetitions (1-back and 2-back depending on the block) located randomly within the blocks. Individuals had to indicate repetitions by pressing a button. Four 1-back and four 2-back blocks were presented in an interleaved way, and between them a baseline stimulus (an asterisk flashing with the same frequency as the letters) was presented for 16 s. All participants first went through a training session outside the scanner.
The behavioural measure used was the signal detection theory index of sensitivity, d′ (Green & Swets, Reference Green and Swets1966). Subjects who had negative d′ values in either or both of the 1-back and 2-back versions of the task, which suggests that they were not performing it, were a priori excluded from the study.
Functional magnetic resonance imaging (fMRI) data acquisition
In each individual scanning session 266 volumes were acquired from a 1.5-T GE Signa scanner (General Electric Medical Systems, USA). A gradient echo echo-planar imaging (EPI) sequence depicting the blood oxygenation level-dependent (BOLD) contrast was used. Each volume contained 16 axial planes acquired with the following parameters: repetition time (TR)=2000 ms, echo time (TE)=20 ms, flip angle=70°, section thickness=7 mm, section skip=0.7 mm, in-plane resolution=3×3 mm. The first 10 volumes were discarded to avoid T1 saturation effects.
Analysis of fMRI activations and deactivations
fMRI image analyses were performed with the FEAT module included in FSL software (Smith et al. Reference Smith, Jenkinson, Woolrich, Beckmann, Behrens, Johansen-Berg, Bannister, De Luca, Drobnjak, Flitney, Niazy, Saunders, Vickers, Zhang, De Stefano, Brady and Matthews2004). At a first level, images were corrected for movement and eventually co-registered to a common stereotaxic space [Montreal Neurological Institute (MNI) template]. To minimize unwanted movement-related effects, individuals with an estimated maximum absolute movement >3.0 mm or an average absolute movement >0.3 mm were excluded from the study.
General linear models (GLMs) were fitted to generate individual activation maps for the baseline versus 1-back and baseline versus 2-back contrasts. Group comparisons between patients and controls were performed within the FEAT module, with mixed-effects GLMs (Beckmann et al. Reference Beckmann, Jenkinson, Woolrich, Behrens, Flitney, Devlin and Smith2006).
We additionally examined the effect of increasing working memory load on the differences between patients and controls. To do this we fitted models that assume a linear relationship through the baseline, 1-back and 2-back levels of the task, reporting significant differences on regression slopes between the two groups.
All statistical tests were carried out at the cluster level with a corrected p value of 0.05 using Gaussian random field methods. The default threshold of z=2.3 was used to define the initial set of clusters.
Functional connectivity analysis
For this analysis, clusters showing significant differences in the comparison between first-episode patients and controls were used as regions of interest (ROIs). Maps portraying the connectivity between these ROIs and all remaining voxels in the brain were generated using a recently described method (Salvador et al. Reference Salvador, Martinez, Pomarol-Clotet, Sarro, Suckling and Bullmore2007, Reference Salvador, Martinez, Pomarol-Clotet, Gomar, Vila, Sarro, Capdevila and Bullmore2008, Reference Salvador, Sarro, Gomar, Ortiz-Gil, Vila, Capdevila, Bullmore, McKenna and Pomarol-Clotet2010) based on partial coherences (Brillinger, Reference Brillinger1981). Frequencies lower than 0.06 Hz, which contained all major patterns derived from the n-back blocked design, were considered specifically. Group comparison was carried out using statistical tests at the cluster level based on Gaussian random fields with a corrected p value of 0.05 and a threshold of z=2.3.
Results
Demographic data on the patients and controls are shown in Table 1. The groups were selected to be matched for age, sex and estimated pre-morbid IQ (TAP score). However, the first-episode patients had a significantly lower mean current IQ than the controls. Twenty-seven patients were on antipsychotic treatment (25 on atypical neuroleptics, 2 on typical neuroleptics). The mean daily dose (in chlorpromazine equivalents) was 299.94±247.71 mg (range 0–1300 mg).
Table 1. Demographic and clinical characteristics of patients and controls

TAP, Word Accentuation Test (Test de Acentuación de Palabras); WAIS-III, Wechsler Adult Intelligence Scale III; GAF, Global Assessment of Functioning; PANSS, Positive and Negative Syndrome Scale.
a Missing data for three patients.
b Missing data for one control.
c Missing data for two patients.
Diagnostic breakdown of the patients
Twenty-eight of the patients were reassessed at 6 months (range 5–8 months). Another was seen after 1 year and the remaining patient was lost to follow-up for almost 3 years but was then reinterviewed.
As shown in Table 2, 17 patients received a DSM-IV diagnosis of schizophrenia either at admission (n=6) or at follow-up (n=11). The remainder were given diagnoses at follow-up of schizo-affective disorder (n=1), delusional disorder (n=2), unspecified psychosis (n=7) or other (n=1; in this patient there was insufficient information to decide between schizophrenia and another diagnosis even at follow-up). Two further patients whose presentation at admission and at follow-up was characterized by withdrawal and social decline (accompanied by hypochondriacal beliefs in one) met the provisional criteria for simple deteriorative disorder (i.e. simple schizophrenia) in DSM-IV.
Table 2. Diagnostic breakdown of the first-episode patients at initial presentation and follow-up
a See text for explanation.
We also categorized patients according to whether they met RDC criteria for schizophrenia. These require only a 2-week duration of active psychotic symptoms and do not specify deterioration from the pre-morbid level of functioning, but are stricter than DSM-IV about the presence of core schizophrenic symptoms such as first rank symptoms and characteristic auditory hallucinations (two classes of symptom are needed for a definite diagnosis). Fifteen patients met RDC criteria for definite schizophrenia. Eleven of these also met DSM-IV criteria for schizophrenia but the remaining four met DSM-IV criteria for unspecified psychosis.
Behavioural performance
The patients were significantly impaired compared to the controls on both the 1- back (mean d′=3.75±1.09 v. mean d′=4.26±0.68, t=2.12, p=0.04) and the 2-back (mean d′=2.56±0.99 v. 3.32±1.09, t=2.74, p=0.008) versions of the task.
fMRI findings
Activation and deactivation findings were generally more marked in the 2-back versus baseline than in the 1-back versus baseline version. Therefore, only these results are reported in the following sections. Effects at the 1-back level were taken into account in the analysis of working memory load.
Average (within-group) task-related activations and deactivations
The healthy subjects showed activation in a network of frontal and other regions. As shown in Fig. 1 a, this included the anterior insula bilaterally and neighbouring regions of the frontal operculum, extending dorsally to the precentral gyrus, and reaching both the left and right DLPFC and the supplementary motor area. Other clusters of activation were seen in the basal ganglia and thalamus, the cerebellum, and bilaterally in regions of the temporal, occipital and parietal cortex.

Fig. 1. Brain regions showing a significant effect in the 2-back versus baseline contrast (a) in controls and (b) in the first-episode patients. Red/yellow indicates a positive association (activation) with the task. Blue indicates areas where the task led to a decrease in the blood oxygenation level-dependent (BOLD) response (deactivation). Numbers refer to MNI z coordinates of the slice shown. The right side of each image represents the left side of the brain. Colour bars indicate z scores from the group-level analysis.
The healthy subjects also showed areas of task-related deactivation in the medial frontal cortex and the posterior cingulate cortex/precuneus. Deactivation was additionally seen in the temporal poles bilaterally, extending to the amygdala, parahippocampal gyrus and marginally to the hippocampus. This bilateral cluster also involved the middle temporal cortex/posterior insula, the left angular gyrus and the pre/post-central cortex.
Findings for the first-episode patients are shown in Fig. 1 b. They revealed activation in a frontal network similar to that seen in the healthy controls: this included the DLPFC bilaterally, the anterior insula bilaterally and neighbouring regions of the frontal operculum, and extended dorsally to the precentral gyrus and supplementary motor area. Activation was also present in the left temporal cortex. However, unlike the controls, no activation was seen in the basal ganglia or thalamus.
The first-episode patients also showed deactivation. This was evident in both the medial frontal cortex and posterior cingulate cortex/precuneus. Unlike the healthy controls, they did not show deactivation in the amygdala, parahippocampus or hippocampus, temporal poles, posterior insula, angular gyrus, or the pre/post-central cortex.
Controlsversus first-episode patients
There were no areas where the first-episode patients showed significantly less activation than the controls.
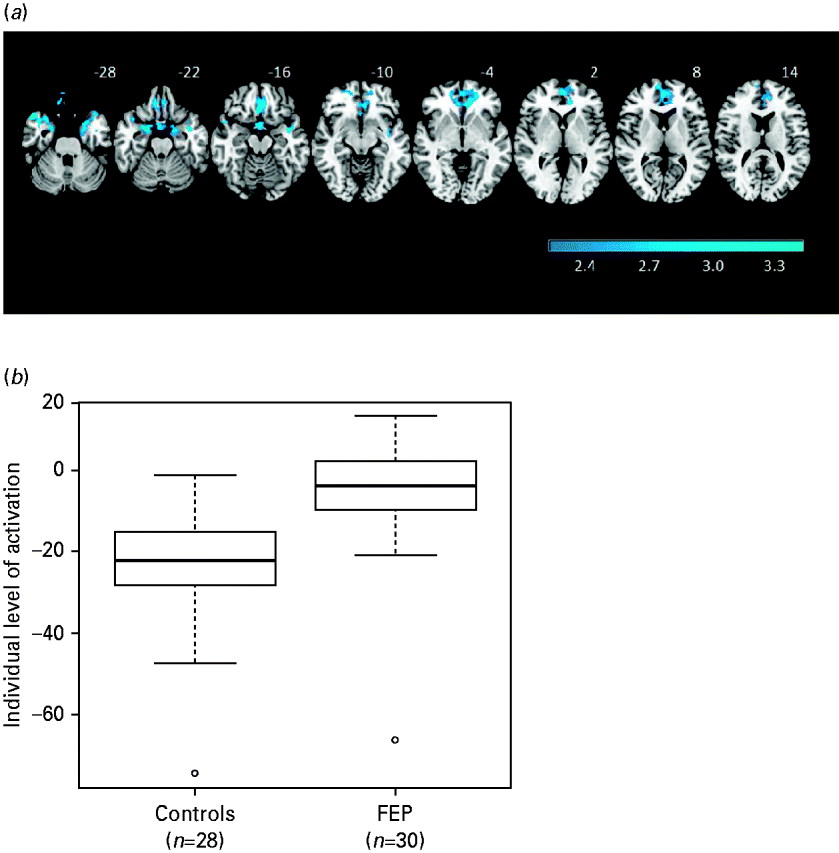
The patients showed significantly reduced deactivation compared to the controls in two contiguous clusters (see Fig. 2 a). One included the gyrus rectus, plus adjacent areas of the inferior frontomedial, orbital and superior frontomedial cortex and the anterior cingulate gyrus [2151 voxels, peak activation in Brodmann area (BA) 11/10, MNI (–10, 38, –2), z score=4.38, p=4.1×10⁻⁵]. The other cluster extended over both temporal poles, reached the parahippocampal gyrus bilaterally and involved marginally the hippocampus and amygdala [2856 voxels, peak activation in BA 36, MNI (28, 10, −38), z score=4.42, p=2.26×10⁻⁶].

Fig. 2. (a) Brain regions showing significant differences between first-episode patients and controls in the 2-back versus baseline contrast. The right side of each image represents the left side of the brain. (b) Boxplots showing the levels of activation/deactivation in first-episode patients and controls averaged across the clusters where there were significant differences in the comparison between groups.
Boxplots of the averaged levels of activation for these two areas of significant difference combined are shown in Fig. 2 b. These confirm that the between-group differences in the medial frontal cortex and bilateral temporal lobe represented failure of deactivation in the first-episode patients.
To determine whether differences in n-back performance were contributing to the difference in deactivation found, we entered each subject's d′ score as a covariate in the 2-back versus baseline contrast. After this, the medial frontal area of failure of deactivation remained, although it became smaller in size (1513 v. 2151 voxels). The temporal pole/parahippocampal gyrus cluster separated into left- and right-sided clusters (left>right) and was also reduced in size (2036 v. 2856 voxels).
Analysis by working memory load
Increasing working memory load was not associated with any differences in activation between the patients and controls. However, it was associated with differences in deactivation affecting a single cluster that was similar in size and location to the two contiguous clusters seen in the 2-back versus baseline contrast between patients and controls. In this analysis the cluster also extended to the posterior part of both parahippocampi.
Connectivity analysis
We first examined the connectivity of an ROI based on the more medial of the two frontal clusters, where significant differences in deactivation were found between the first-episode patients and controls in the 2-back versus baseline contrast. Fig. 3 a shows the average connectivity maps of this deactivation cluster in each of the groups. In both the patients and the controls, high levels of connectivity were found with parts of the default mode network, the posterior cingulate gyrus/precuneus, and angular gyrus extending to other parts of the parietal cortex bilaterally. Additionally, high connectivity was seen with areas adjacent to the medial frontal cluster of group difference, involving the orbitofrontal cortex, the hippocampus and amygdala, the fusiform gyri, and the inferior surface of the temporal lobes.

Fig. 3. (a) Averages of connectivity images for the controls and the group of first-episode patients using a region of interest (ROI, depicted here in cyan) based on the medial cluster where there were significant differences between the groups in the 2-back versus baseline task. (b) Brain areas (shown in red) that, after a subtraction between the two average images shown in Fig. 4, showed a reduction in connectivity >0.04 (measured in partial coherence units) in the patients. The cluster in the precuneus (shown in yellow) is where the differences reached significance at p=0.05 corrected. The left side of the image represents the left side of the brain.
Comparing the connectivity of this medial frontal ROI between the first-episode patients and the controls revealed several clusters where there were differences between them. The largest was located in the precuneus (MNI: 2, −60, 14; p=2.56×10⁻⁵) with a peak reduction in connectivity in the first-episode patients of −0.10 in partial coherence units. Fig. 3 b shows the location of this cluster, with the area where the reduction was significant superimposed on an exploratory image showing areas with reductions of connectivity greater than 0.04 in patients. Another cluster with reduced connectivity in patients (difference: −0.09) was seen in the left orbitofrontal cortex, pars triangularis (MNI: −36, 30, 8; p=0.04). There was also a third cluster, which showed significantly increased connectivity in the patients (difference: 0.12), located in the right precentral gyrus (MNI: 44, −14, −38; p=0.0005).
We repeated the previous analysis, this time using an ROI based on the combination of the two contiguous clusters where there were significant differences between the first-episode patients and controls. This made very little difference to the pattern of connectivity observed with the posterior cingulate/precuneus and the parietal cortex. However, it resulted in much greater local extension: in both the patients and the controls, connectivity now extended across most of the anterior medial frontal cortex and, inferiorly, covered most of the anterior ventral surface of the brain (data not shown).
Relationship to diagnosis of schizophrenia versus other diagnoses
We examined this using a ROI encompassing the two clusters where there were significant differences in deactivation between the patients and controls in the 2-back versus baseline contrast. First, we compared patients who met DSM-IV criteria for schizophrenia at presentation or follow-up (n=17) to those with other diagnoses (n=10) (the two patients who were given a diagnosis of simple schizophrenia and the one patient in whom the diagnosis remained uncertain at follow-up were excluded). The results are shown in Fig. 4 a. Those meeting DSM-IV criteria for schizophrenia showed significantly greater failure of deactivation (t=2.39, p=0.02).

Fig. 4. (a) Boxplot comparing patients who met DSM-IV criteria for schizophrenia at presentation or follow-up (n=17) with those who had other diagnoses at follow-up (n=10). (b) Boxplot comparing patients who met RDC criteria for schizophrenia (n=15) with those who did not (n=15). Values are means from the two significant clusters found in the 2-back versus baseline comparison between patients and controls.
Second, we compared patients who met RDC criteria for schizophrenia (n=15) to those who did not (n=15). Once again there was a significant difference, with the RDC positive group showing more failure to deactivate (t=2.17, p=0.04) (see Fig. 4 b).
Correlations with symptoms and cognitive function
PANSS positive, negative and disorganization scores were correlated with each patient's mean deactivation value in the above defined ROI. These correlations were all insignificant (positive symptoms: r=−0.11, p=0.57); negative symptoms: r=0.18, p=0.33; disorganization: r=0.22, p=0.26). Correlations with neuropsychological measures were also insignificant (BADS profile score: r=−0.15, p=0.51; WMS composite score: r=−0.15, p=0.50). Additionally, there was no significant correlation with performance on the 2-back version of the n-back task (r=−0.13, p=0.50).
Discussion
Our failure to find differences in prefrontal activation between first-episode patients and controls is consistent with the balance of evidence from other studies, where those that have found reduced prefrontal activation (Barch et al. Reference Barch, Carter, Braver, Sabb, MacDonald, Noll and Cohen2001; Mendrek et al. Reference Mendrek, Laurens, Kiehl, Ngan, Stip and Liddle2004; Boksman et al. Reference Boksman, Theberge, Williamson, Drost, Malla, Densmore, Takhar, Pavlosky, Menon and Neufeld2005; Snitz et al. Reference Snitz, MacDonald, Cohen, Cho, Becker and Carter2005; Tan et al. Reference Tan, Choo, Fones and Chee2005; Broome et al. Reference Broome, Matthiasson, Fusar-Poli, Woolley, Johns, Tabraham, Bramon, Valmaggia, Williams, Brammer, Chitnis and McGuire2009) are outnumbered by those that have had negative or marginal findings (Rasser et al. Reference Rasser, Johnston, Lagopoulos, Ward, Schall, Thienel, Bender, Toga and Thompson2005; Schneider et al. Reference Schneider, Habel, Reske, Kellermann, Stocker, Shah, Zilles, Braus, Schmitt, Schlosser, Wagner, Frommann, Kircher, Rapp, Meisenzahl, Ufer, Ruhrmann, Thienel, Sauer, Henn and Gaebel2007; Scheuerecker et al. Reference Scheuerecker, Ufer, Zipse, Frodl, Koutsouleris, Zetzsche, Wiesmann, Albrecht, Bruckmann, Schmitt, Moller and Meisenzahl2008; Whitfield-Gabrieli et al. Reference Whitfield-Gabrieli, Thermenos, Milanovic, Tsuang, Faraone, McCarley, Shenton, Green, Nieto-Castanon, LaViolette, Wojcik, Gabrieli and Seidman2009; Woodward et al. Reference Woodward, Waldie, Rogers, Tibbo, Seres and Purdon2009; van Veelen et al. Reference van Veelen, Vink, Ramsey and Kahn2010; Nejad et al. Reference Nejad, Ebdrup, Siebner, Rasmussen, Aggernaes, Glenthoj and Baare2011). Some of these studies were carried out on drug-free or drug-naïve patients, but it does not seem likely that the differences among them can be attributed to treatment as there were positive and negative findings in studies using both treated and untreated patients.
We also failed to find evidence of task-related hyperactivations in our first-episode sample. Although ‘hyperfrontality’ seems to be a robust finding in schizophrenia in general (Minzenberg et al. Reference Minzenberg, Laird, Thelen, Carter and Glahn2009), once again the evidence seems to be against it characterizing first-episode psychosis. Thus, including our study, hyperactivations have been found in only three out of 14 studies, and in these its location varied from the inferior frontal gyrus bilaterally (Tan et al. Reference Tan, Choo, Fones and Chee2005), to the right ventrolateral prefrontal cortex and insula (Schneider et al. Reference Schneider, Habel, Reske, Kellermann, Stocker, Shah, Zilles, Braus, Schmitt, Schlosser, Wagner, Frommann, Kircher, Rapp, Meisenzahl, Ufer, Ruhrmann, Thienel, Sauer, Henn and Gaebel2007), to the right DLPFC (Whitfield-Gabrieli et al. Reference Whitfield-Gabrieli, Thermenos, Milanovic, Tsuang, Faraone, McCarley, Shenton, Green, Nieto-Castanon, LaViolette, Wojcik, Gabrieli and Seidman2009). Additionally, in the study of Whitfield-Gabrieli et al. (Reference Whitfield-Gabrieli, Thermenos, Milanovic, Tsuang, Faraone, McCarley, Shenton, Green, Nieto-Castanon, LaViolette, Wojcik, Gabrieli and Seidman2009), the region of hyperactivation was very small.
Nevertheless, differences in prefrontal function between first-episode patients and controls did emerge strongly in our study, in the form of failure to deactivate in a large area that included the medial inferior frontal cortex but also extended to both temporal poles and the parahippocampal gyri. As noted in the introduction, failure of deactivation in the medial frontal cortex has been found in several studies of schizophrenia (Pomarol-Clotet et al. Reference Pomarol-Clotet, Salvador, Sarro, Gomar, Vila, Martinez, Guerrero, Ortiz-Gil, Sans-Sansa, Capdevila, Cebamanos and McKenna2008; Whitfield-Gabrieli et al. Reference Whitfield-Gabrieli, Thermenos, Milanovic, Tsuang, Faraone, McCarley, Shenton, Green, Nieto-Castanon, LaViolette, Wojcik, Gabrieli and Seidman2009; Milanovic et al. Reference Milanovic, Thermenos, Goldstein, Brown, Gabrieli, Makris, Tsuang, Buka and Seidman2011; Salgado-Pineda et al. Reference Salgado-Pineda, Fakra, Delaveau, McKenna, Pomarol-Clotet and Blin2011; Schneider et al. Reference Schneider, Royer, Grosselin, Pellet, Barral, Laurent, Brouillet and Lang2011), although most of these were carried out on chronic or unselected patients. Only three studies of first-episode schizophrenic patients have reported on task-related deactivations: two of them had findings very similar to ours (Tan et al. Reference Tan, Choo, Fones and Chee2005; Whitfield-Gabrieli et al. Reference Whitfield-Gabrieli, Thermenos, Milanovic, Tsuang, Faraone, McCarley, Shenton, Green, Nieto-Castanon, LaViolette, Wojcik, Gabrieli and Seidman2009) but the third (Nejad et al. Reference Nejad, Ebdrup, Siebner, Rasmussen, Aggernaes, Glenthoj and Baare2011) had negative findings for this brain area (although it did find failure of activation in a non-frontal area).
Failure of deactivation, together with its location in the medial frontal cortex, suggests that there is default mode network dysfunction in first-episode psychosis. This suggestion is strengthened by our connectivity findings, that this medial frontal cluster showed high connectivity with other regions of the default mode network, namely the posterior cingulate cortex/precuneus and parts of the parietal lobes, and that connectivity was significantly lower in the patients in part of the posterior cingulate cortex/precuneus. A sizable body of research now implicates the default mode network in schizophrenia, although the precise nature of the dysfunction remains a matter of debate. Thus, studies examining task-related deactivations have found failure of deactivation (Pomarol-Clotet et al. Reference Pomarol-Clotet, Salvador, Sarro, Gomar, Vila, Martinez, Guerrero, Ortiz-Gil, Sans-Sansa, Capdevila, Cebamanos and McKenna2008; Whitfield-Gabrieli et al. Reference Whitfield-Gabrieli, Thermenos, Milanovic, Tsuang, Faraone, McCarley, Shenton, Green, Nieto-Castanon, LaViolette, Wojcik, Gabrieli and Seidman2009), increased deactivation (Harrison et al. Reference Harrison, Yucel, Pujol and Pantelis2007) and, in one case, a mixed pattern increased and decreased deactivation in different parts of the default mode network (Garrity et al. Reference Garrity, Pearlson, McKiernan, Lloyd, Kiehl and Calhoun2007). Similarly, connectivity studies have found both decreased (Liang et al. Reference Liang, Zhou, Jiang, Liu, Tian, Liu and Hao2006; Bluhm et al. Reference Bluhm, Miller, Lanius, Osuch, Boksman, Neufeld, Theberge, Schaefer and Williamson2007; Camchong et al. Reference Camchong, MacDonald, Bell, Mueller and Lim2010; Ongur et al. Reference Ongur, Lundy, Greenhouse, Shinn, Menon, Cohen and Renshaw2010) and increased (Zhou et al. Reference Zhou, Liang, Tian, Wang, Hao, Liu, Liu and Jiang2007; Calhoun et al. Reference Calhoun, Maciejewski, Pearlson and Kiehl2008; Whitfield-Gabrieli et al. Reference Whitfield-Gabrieli, Thermenos, Milanovic, Tsuang, Faraone, McCarley, Shenton, Green, Nieto-Castanon, LaViolette, Wojcik, Gabrieli and Seidman2009; Liu et al. Reference Liu, Kaneko, Ouyang, Li, Hao, Chen, Jiang, Zhou and Liu2010; Salvador et al. Reference Salvador, Sarro, Gomar, Ortiz-Gil, Vila, Capdevila, Bullmore, McKenna and Pomarol-Clotet2010) connectivity. Nevertheless, it is noteworthy that both deactivation (Pomarol-Clotet et al. Reference Pomarol-Clotet, Salvador, Sarro, Gomar, Vila, Martinez, Guerrero, Ortiz-Gil, Sans-Sansa, Capdevila, Cebamanos and McKenna2008; Whitfield-Gabrieli et al. Reference Whitfield-Gabrieli, Thermenos, Milanovic, Tsuang, Faraone, McCarley, Shenton, Green, Nieto-Castanon, LaViolette, Wojcik, Gabrieli and Seidman2009) and connectivity (Whitfield-Gabrieli et al. Reference Whitfield-Gabrieli, Thermenos, Milanovic, Tsuang, Faraone, McCarley, Shenton, Green, Nieto-Castanon, LaViolette, Wojcik, Gabrieli and Seidman2009; Camchong et al. Reference Camchong, MacDonald, Bell, Mueller and Lim2010; Salvador et al. Reference Salvador, Sarro, Gomar, Ortiz-Gil, Vila, Capdevila, Bullmore, McKenna and Pomarol-Clotet2010) studies have often localized the abnormality to the anterior midline node of the network in the medial frontal cortex.
The failure of deactivation we found extended beyond the medial frontal cortex to include the temporal poles, the parahippocampal gyrus and marginally the hippocampus and amygdala. Although current concepts of default mode network include the hippocampus and parahippocampal gyrus (Buckner et al. Reference Buckner, Andrews-Hanna and Schacter2008), such a prominent involvement of the temporal poles would have to be considered atypical. It is difficult to speculate on what this finding might mean, but it is interesting to note that failure of deactivation in areas outside the default mode network has recently been found in schizophrenia in two other studies: in the fusiform gyrus bilaterally in a mixed group of patients while they performed a paced verbal fluency task (John et al. Reference John, Halahalli, Vasudev, Jayakumar and Jain2011), and in the right temporoparietal region (Nejad et al. Reference Nejad, Ebdrup, Siebner, Rasmussen, Aggernaes, Glenthoj and Baare2011) in first-episode patients during the n-back task.
The medial frontal failure of deactivation we found was not significantly correlated with positive, negative or disorganization symptoms. Nor, beyond the fact that it became smaller after controlling for n-back task performance, was there any evidence of an association with cognitive impairment. One interpretation of this finding might be that, unlike hypofrontality and hyperfrontality, failure of deactivation represents a trait marker for schizophrenia, that is, an abnormality that is present independent of stage of illness and unrelated to its clinical features. If so, it is of some interest that we found failure of deactivation to be more marked in first-episode patients who subsequently went on to acquire a DSM-IV diagnosis of schizophrenia and/or showed the core defining symptoms of the disorder such as auditory hallucinations, multiple delusions and first rank symptoms at initial presentation (i.e. met RDC criteria for schizophrenia). This would seem to suggest that failure of deactivation may be a marker for severity of the disease process.
In summary, this study finds that failure of deactivation, presumptively affecting the default mode network, is a feature of early psychosis, where it seems to identify patients showing features associated with progression to schizophrenia. This, and the fact that it was not associated with other clinical features of the illness, suggests that it is a trait rather than state marker for illness presence. Further studies using resting state connectivity and carried out on non-neuroleptic-treated patients would be desirable to confirm and extend these findings.
Acknowledgements
This study was supported by the Instituto de Salud Carlos III, Centro de Investigación en Red de Salud Mental (CIBERSAM), and the following grants: Instituto de Salud Carlos III CB07/09/0030 (CIBERSAM), CP07/00048 (RS) and PI05/2693 (EP-C). This work will be included as part of A. Guerrero-Pedraza's doctoral thesis at the Universitat Autònoma de Barcelona (Psychiatry and Clinical Psychology Programme).
Declaration of Interest
None.