1. INTRODUCTION
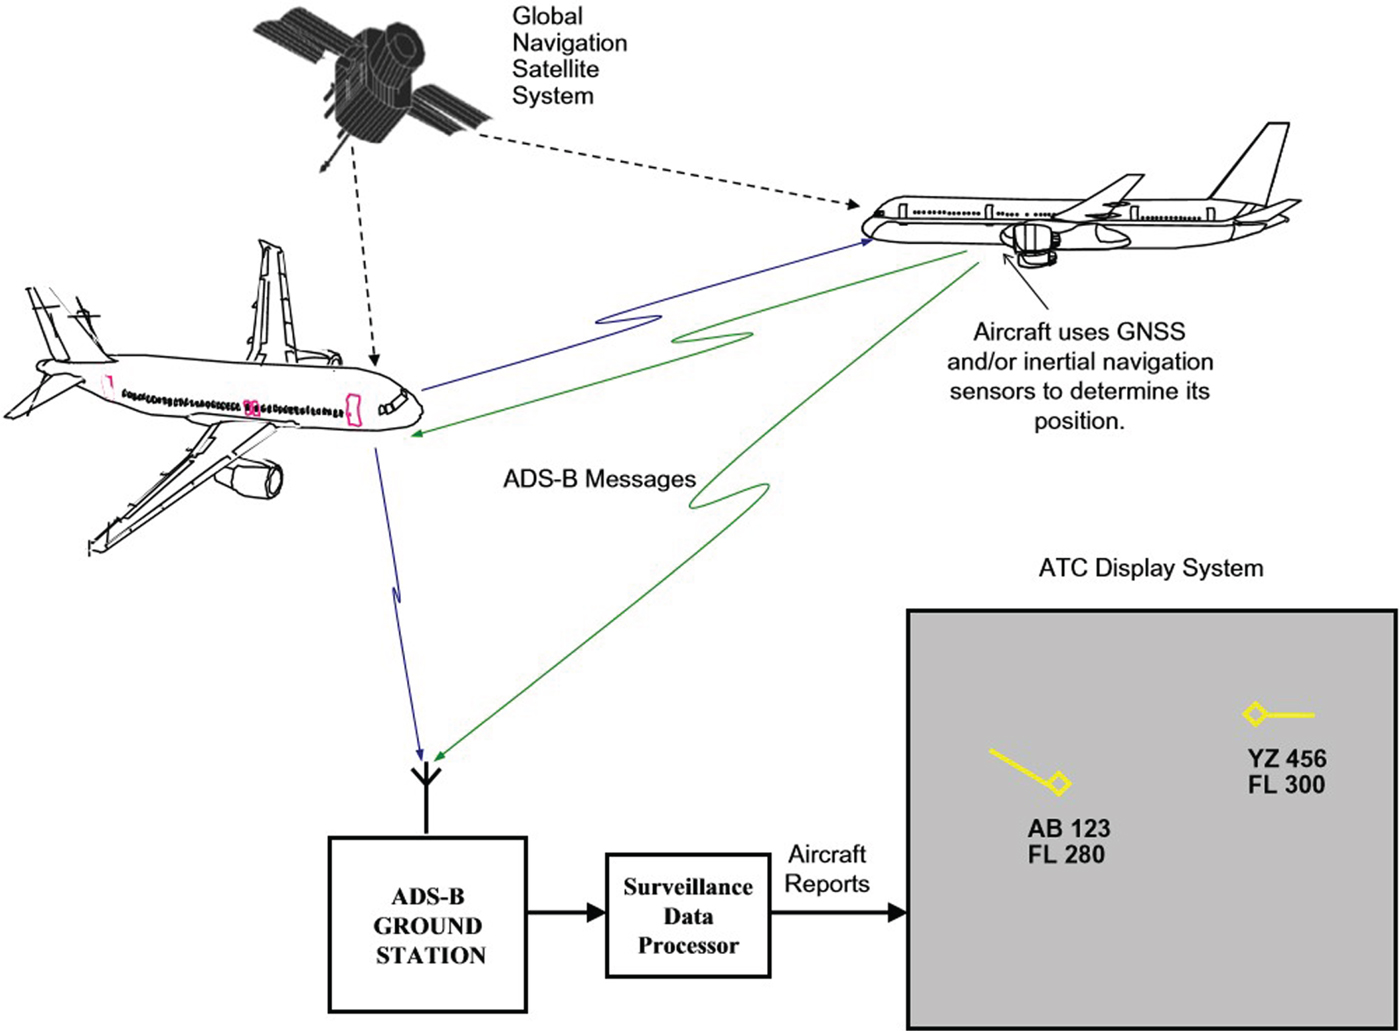
Automatic Dependent Surveillance-Broadcast (ADS-B) is a surveillance system implemented on board aircraft. It broadcasts aircraft identification, state vector and position information periodically to other ADS-B equipped aircraft within a specified range and to ground stations for Air Traffic Control (ATC) use (Radio Technical Commission for Aeronautics (RTCA), 2002). ADS-B relies on the onboard navigation systems such as Global Navigation Satellite Systems (GNSSs) to obtain aircraft position information as well as data link technologies to broadcast the information. The ADS-B message is broadcast periodically to other ADS-B equipped aircraft and ADS-B ground stations for ATC use in ASTERIX Category 021 format (EUROCONTROL, 2003). Figure 1 illustrates the ADS-B system. A detailed description of each data field present in the ADS-B message is provided in the EUROCONTROL Standard Document for Surveillance Data Exchange - Cat 021 ADS-B Messages (EUROCONTROL, 2003).

Figure 1. Automatic Dependent Surveillance Broadcast (ADS-B) system (Ali et al., Reference Ali, Ochieng, Schuster, Majumdar and Chiew2015).
Both Geometric Altitude (GALT) and barometric altitude (Flight Level (FL)) are present in the ADS-B message. The geometric altitude is derived from the GNSS receiver on board and fed to the ADS-B emitter/transponder on board. It indicates the vertical distance of an aircraft from a reference ellipsoid or sometimes a reference geoid, depending on the type of GNSS receiver model. The value is provided in World Geodetic System (WGS)-84 format, the standard United States (US) Department of Defense definition of a global reference system for geospatial information and is the reference system for the Global Positioning System (GPS). It is compatible with the International Terrestrial Reference System (ITRS).
Barometric altitude is derived from a barometric altimeter in the aircraft (Portland State Aerospace Society, 2004) and fed to the ADS-B emitter/transponder on board. The altimeter calculates vertical distance in accordance with a predetermined reference pressure level (Lehtinen, Reference Lehtinen2013). It works by measuring changes in the atmospheric pressure from the aircraft static port and then converting the values into aircraft barometric altitude in feet. Depending on whether the aircraft is above or below transition altitude (a published height above sea level at which pilots climbing to their cruising level change their barometric altimeter datum from the regional pressure setting to the common international standard setting), the pilot has to adjust the setting on the altimeter in order to choose a suitable reference pressure level (that is, altimeter setting) (Jan et al., Reference Jan, Gebre-Egziabher, Walter and Enge2002). The barometric altitude is referenced to the International Standard Atmosphere (ISA) (that is, Question Nil Elevation (QNE) standard sea level pressure at 1013·25 hPa at 15°C) when the aircraft is above the transition altitude. In contrast, when an aircraft is flying below the transition altitude, the reference will be set to local atmospheric pressure adjusted to mean sea level, known as Query Nautical Height (QNH), which is an altimeter setting based on the local mean sea level pressure supplied by the ATC. Thus, the altimeter will indicate vertical distance of an aircraft above Mean Sea Level (MSL). Consequently, the flight level will usually be in error with the actual altitude above MSL except during a standard day where the standard isobaric surface and the mean sea level pressures are the same.
This work analyses characteristics of the geometric and barometric altitude in the ADS-B messages including availability of the data and the trend in variations between geometric and barometric altitudes based on phases of flight, GPS receiver model and aircraft make and model. The work also identifies specific quality indicator parameters in the ADS-B message to analyse altitude data integrity in the message. The quality indicators for altitude data include a Barometric Altitude Integrity Code (NICBARO), Surveillance Integrity Level (SIL) and Geometric Vertical Accuracy (GVA). These were not formerly available for aircraft operations. Then, a number of analyses are conducted to verify altitude data integrity for all the aircraft in the data sample. Compliance of the barometric altitude data to the International Civil Aviation Organization (ICAO) requirement to operate in Reduced Vertical Separation Minimum (RVSM) airspace is also analysed.
2. AIRCRAFT SEPARATION
As described above, all aircraft flying above the transition altitude are required to use the same altimeter setting. Therefore, the aircraft will eventually be diverging from their true reference altitude by the same magnitude vertically (International Virtual Aviation Organization (IVAO), 2015). For this reason, flight level (Mode C) has always been the only form of altitude used by ATC for aircraft separation in the airspace. In 1958, the standard vertical separation was set to 1,000 feet from the surface to 29,000 feet, and 2,000 feet above 29,000 feet. This was because the accuracy of a barometric altimeter decreases with height. Efforts to reduce this to 1,000 feet began soon afterwards, but it was not until the 1990s that Air Data Computers (ADCs), altimeters and autopilots became sufficiently accurate to make this a reality (Silva, Reference Silva2010) and, thereafter the concept of Reduced Vertical Separation Minimum (RVSM) was introduced and implemented. RVSM is defined as the reduction of vertical distance between aircraft from 2,000 to 1,000 feet from flight level 29,000 to 41,000 feet. RVSM was implemented as a means to increase airspace capacity and access to more fuel-efficient flight levels.
The downlinked Mode S selected altitude is the altitude selected and manually keyed by the pilot into the Mode Control Panel (MCP) or Flight Control Unit (FCU) which provides control of the aircraft autopilot system. Typically, the selected altitude should represent the altitude cleared by ATC (Barhydt and Warren, Reference Barhydt and Warren2002). Since the selected altitude only shows the pilot's altitude intent, it cannot be used for separation purposes. However, the Mode S selected altitude has been proven reliable for flight safety enhancement, for example in alleviating potential level bust (unauthorised vertical deviation of more than 300 feet from an ATC flight clearance) for aircraft that fail to fly at their assigned levels. This can simply be done by comparing the aircraft's selected altitude with the ATC clearance altitude (or clearance level). Thus, the apparent inconsistencies between the two altitudes can be easily detected and notified to pilots (Barhydt and Warren, Reference Barhydt and Warren2002).
3. BAROMETRIC ALTITUDE AND GEOMETRIC ALTITUDE
Although all aircraft are currently equipped with a barometric altimeter, the barometric altitude still has its own limitations. This has sparked many studies and ideas to utilise geometric altitude in order to avoid over-reliance on one type of altitude data. For instance, the need for barometric altimeters to regularly be calibrated to and from the standard pressure setting and QNH can cause confusion to pilots. Moreover, the failure to change to the correct altimeter setting may cause potential level busts (Fisher, Reference Fisher2014). Aside from the previous considerations, the necessity of QNH setting during take-off and landing phases provides an overall inefficient use of the airspace due to the loss of levels at lower altitudes (Garcia, Reference Garcia2014).
Geometric altitude, on the other hand, is acquired directly from the GNSS and thus offers freedom from the requirement of altimeter setting calibration. Hence, geometric altitude is not prone to altimeter miss-setting or human error. Furthermore, the accuracy of the QNH altimeter setting is limited to the vicinity of the location where ATC sends out the QNH information (such as the reporting station). The accuracy will decline as the aircraft distance to the reporting station increases, where the QNH (actual local sea level pressure) setting is measured (Federal Aviation Authority (FAA), 2009). However, the accuracy and sensitivity of the geometric altitude will not decrease with the altitude since it does not depend on reference pressure level or altimeter settings (Fisher, Reference Fisher2014). Hence, with the use of geometric altitude, more levels may become available than there are currently in RVSM airspace thus contributing to a higher safe traffic density.
In addition, a barometric altimeter is hard-wired with the formula from the ICAO Standard Atmosphere and thus the accuracy of a barometric altimeter will be affected whenever the atmospheric conditions differ from that assumed as the standard. For example, the barometric altitude is susceptible to temperature variations as a result of the relationship between pressure and altitude in the formula varying as the temperature changes (Yee and Yee, Reference Yee and Yee2008). Geometric altitude is more accurate due to its independence from atmospheric conditions and thus the accuracy is maintained regardless of the weather conditions (Fisher, Reference Fisher2014).
Nevertheless, due to its dependency on satellites, GNSS signals are susceptible to interference and multipath and thus a total loss of signal is not impossible (Guo and Jan, Reference Guo and Jan2015). The availability of altitude data from the barometric altimeter, however, is more reliable since the altimeter only measures atmospheric pressure and does not require a power source or satellites to function. The accuracy of a barometric altimeter can be affected by water vapour in the air due to the potential influence of humidity on the pressure lapse rate (Garcia et al., Reference Garcia, Mueller, Innis and Veytsman2012). Although the conventional barometric altimeter is undoubtedly reliable, it is however offset by the necessary extensive maintenance and scrutiny of the surface area near the static port as well as condensation traps and drains (Fisher, Reference Fisher2014).
There is no technical reason as to why geometric altitude cannot be used by both pilots and controllers in the future (Neven et al., Reference Neven, Quilter, Weedon and Hogendoorn2005). Numerous studies have been conducted to explore the use of geometric altitude in aviation. Although the reduced separation standards in RVSM airspace have successfully increased airspace capacity, they have amplified the need to evaluate the stability of an aircraft's Altimetry System Error (ASE) in order to ensure accurate height-keeping performance (Falk et al., Reference Falk, Gonzalez and Perez2010). To date, several height monitoring systems (such as Height Monitoring Unit (HMU), Enhanced GPS Monitoring Unit (EGMU) and Aircraft Geometric Height Measuring Element (AGHME)) have become available for the monitoring of aircraft Height-Keeping Performance (HKP). These specialised systems are used to compile necessary data including geometric altitude as one of the key components required for the calculation of ASE. Aside from the available height monitoring systems, some studies have proposed the use of ADS-B geometric altitude for HKP monitoring. However, the geometric altitude contained in the ADS-B messages must first be examined to ensure that it is valid for computing aircraft ASE.
A study by Martin et al. (Reference Martin, Falk and Perez2008) was conducted to compare aircraft geometric altitude from ADS-B (using both 978 MHz Universal Access Transceiver (UAT) and 1090 Extended Squitter (1090ES) data links) with an Enhanced GPS Monitoring Unit (EGMU) which is an already established system for estimating aircraft ASE. Comparisons were done using statistical analysis. Results showed that the geometric altitude information in Wide Area Augmentation System (WAAS)-enabled ADS-B data is sufficiently accurate to calculate aircraft ASE (Martin et al., Reference Martin, Falk and Perez2008). Later, in 2010, an extension of the study was conducted, and the results showed that the use of geometric altitude from WAAS-enabled 1090ES data is sufficiently accurate for the estimation of aircraft ASE under uncontrolled conditions (Falk et al., Reference Falk, Gonzalez and Perez2010). Another study in 2010 directly compared the geometric altitude data from EGMU and ADS-B using Analysis Of Variance (ANOVA). ANOVA is a collection of statistical models used to analyse the differences among group means and their associated procedures. Both geometric altitude data from the EGMU source and an ADS-B source were taken simultaneously from the same aircraft. Results from the ANOVA test showed that there is no significant difference between the two sources. Therefore, ADS-B geometric altitude does meet the requirements for HKP monitoring (Kexi et al., Reference Kexi, Jun and Xuejun2010).
At present, ADS-B geometric altitude has been deployed in some countries such as Australia to estimate aircraft Altimetry System Error (ASE) for HKP monitoring (Monitoring Agency for Asia Region (MAAR), 2012). Geometric altitude has also been proven useful for situational awareness purposes. The real-time accuracy of GPS-derived geometric altitude can be improved when combined with other air data signals in a blending algorithm, thus making it possible for use in a continued Enhanced Ground Proximity Warning System (EGPWS) operation to ensure the safety of aircraft against terrain conflict (Wiolland, Reference Wiolland2007). The continued EGPWS operation is feasible due to geometric altitude's insusceptibility to extreme temperature and pressure variations. The geometric altitude is also found to be more accurate than any single source when blended with other air-data signals (Allied Signal Electronic and Avionics System, 1999). Furthermore, the geometric altitude was found to be useful for reasonableness checking of altitude data such as the barometric altitude (Allied Signal Electronic and Avionics System, 1999). Finally, geometric altitude could be potentially helpful for a cross-check on the safety and validity of barometric altitude, for example during extreme weather conditions.
4. DATA
Real time ADS-B messages (ASTERIX Category 021) broadcast from 38 aircraft were collected from ADS-B ground stations in the London Terminal Manoeuvring Area (LTMA) and 974 aircraft from the Kuala Lumpur Flight Information Region (KL FIR). The ADS-B messages were broadcast to the ground stations using the 1,090 MHz Extended Squitter (1090ES) data link. The data collection was based on opportunity traffic.
A descriptive statistical analysis shows that only 98·9% geometric altitude data was broadcast in the ADS-B messages from the sample aircraft. Other parameters, such as trajectory intent, was noticeably unavailable. However, it is important to highlight that the data fields present in the ADS-B message depend on the ADS-B avionics version. The data used in this study comply with either the requirements in the RTCA DO-260, DO-260A or DO-260B. In addition, general aircraft avionics information was collected from airlines which included the aircraft make and model and GPS receiver model.
For the purposes of this paper, phase of flight refers to a period within a flight. In the case of a manned aircraft, a flight begins when any person boards the aircraft with the intention of flight and continues until such time as all such persons have disembarked. The flight phases (National Transportation Safety Board (NTSB), 2018) used in this paper include:
• Taxi - The aircraft is moving on the aerodrome surface under its own power prior to take-off or after landing.
• Initial Climb - From the end of the take-off phase to the first prescribed power reduction, or until reaching 1,000 feet above runway elevation or the Visual Flight Rules (VFR) pattern, whichever comes first.
• Climb - From completion of Initial Climb to arrival at initial assigned cruise altitude.
• Cruise - Any level flight segment after arrival at initial cruise altitude until the start of descent to the destination.
• Descend - Descent from cruise to either Initial Approach Fix (IAF) or VFR pattern entry.
5. CHARACTERISTICS OF GEOMETRIC AND BAROMETRIC ALTITUDE DATA IN ADS-B MESSAGES
Out of the 1,012 ADS-B equipped aircraft in this study, 1,001 aircraft displayed both geometric altitude and barometric altitude (flight level) in the ADS-B messages throughout the flight. It was found that both barometric and geometric altitude data were unavailable in the ADS-B messages from ten aircraft. Further inspection of their ground speed showed that these aircraft were taxiing during the whole recorded duration. One aircraft failed to report geometric altitude in its ADS-B messages although the barometric altitude data were available during the flight. The particular aircraft was cruising at 37,000 feet during the recorded flight duration. Additionally, four aircraft were missing part of both barometric and geometric altitude data throughout the recorded flight duration.
From an inspection of the availability of altitude data, it was found that missing altitude data happened when the aircraft were on the ground. Aircraft-1 and Aircraft-2 stopped reporting altitude data once they had landed, while Aircraft-3 and Aircraft-4 only reported altitude data after take-off. The missing geometric altitude data while the aircraft were on the ground could be due to the unavailability of ADS-B ground sensor coverage at the airport surface.
There were eight other aircraft with partially missing geometric altitude data but with their barometric altitude data fully available. It was identified that loss of some of the geometric altitude data for the aircraft only happened during the cruising phase. Missing geometric altitude data during high altitude cruising may be due to aircraft-satellite beyond line-of-sight, causing a loss of navigation signal.
5.1. Deviation analysis
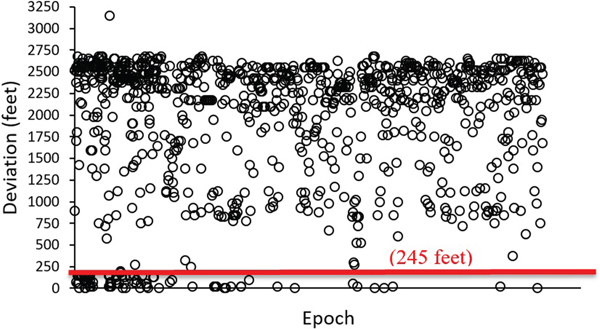
It was found that the absolute difference between the geometric and barometric altitude ranged from 0 feet – 2,675 feet with an average of 1,404 feet. One aircraft showed an outlier with a 3,150 feet deviation. In addition, 14 epochs from 14 aircraft showed 0 feet deviation between barometric and geometric altitude during the flight. According to ICAO (2011), it is required that each aircraft group must have a mean ASE value less than 80 feet in magnitude and the absolute value of the mean plus three standard deviations must be less than 245 feet for an aircraft to fly in an RVSM airspace (Martin et al., Reference Martin, Falk and Perez2008). Based on the analysis in Figure 2, only 8·7% of the altitude deviation is less than 245 feet.
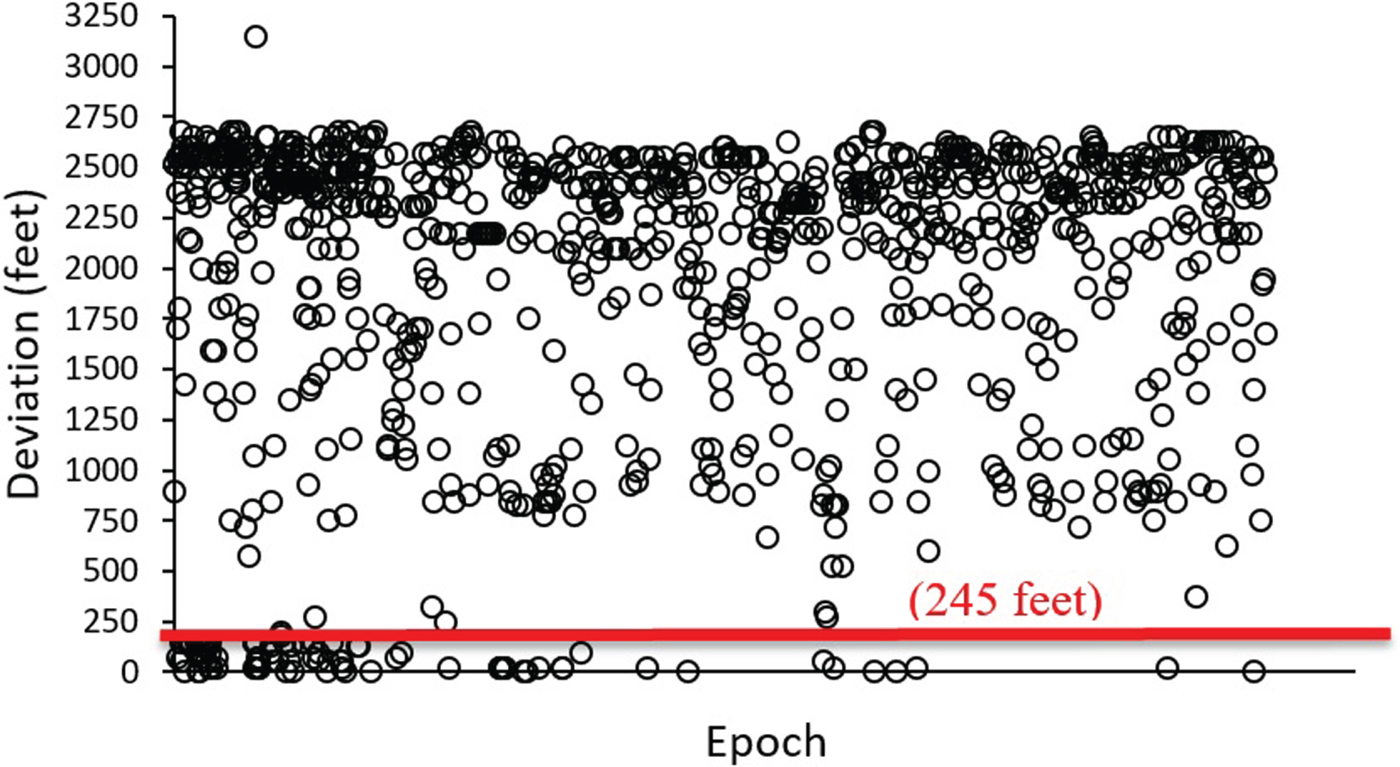
Figure 2. Deviation between barometric and geometric altitude.
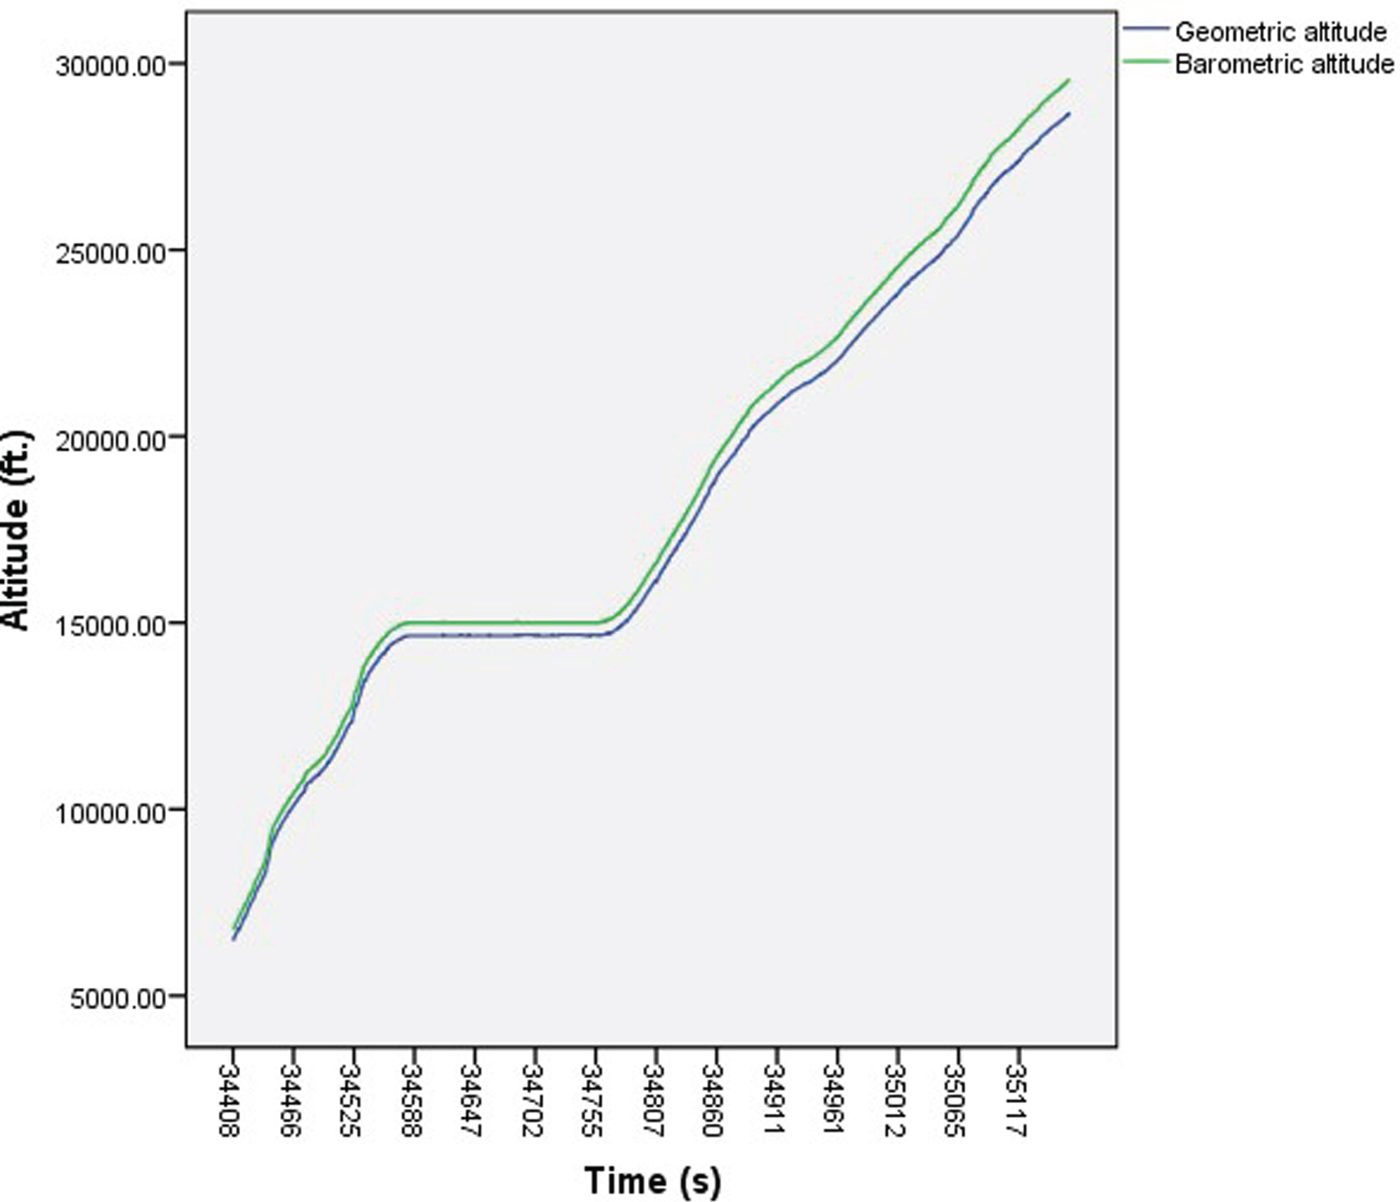
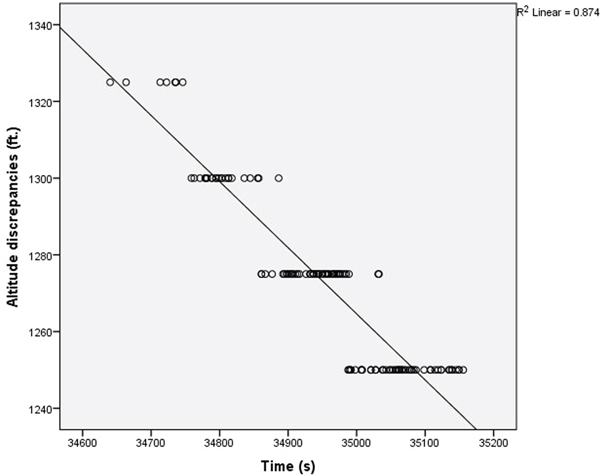
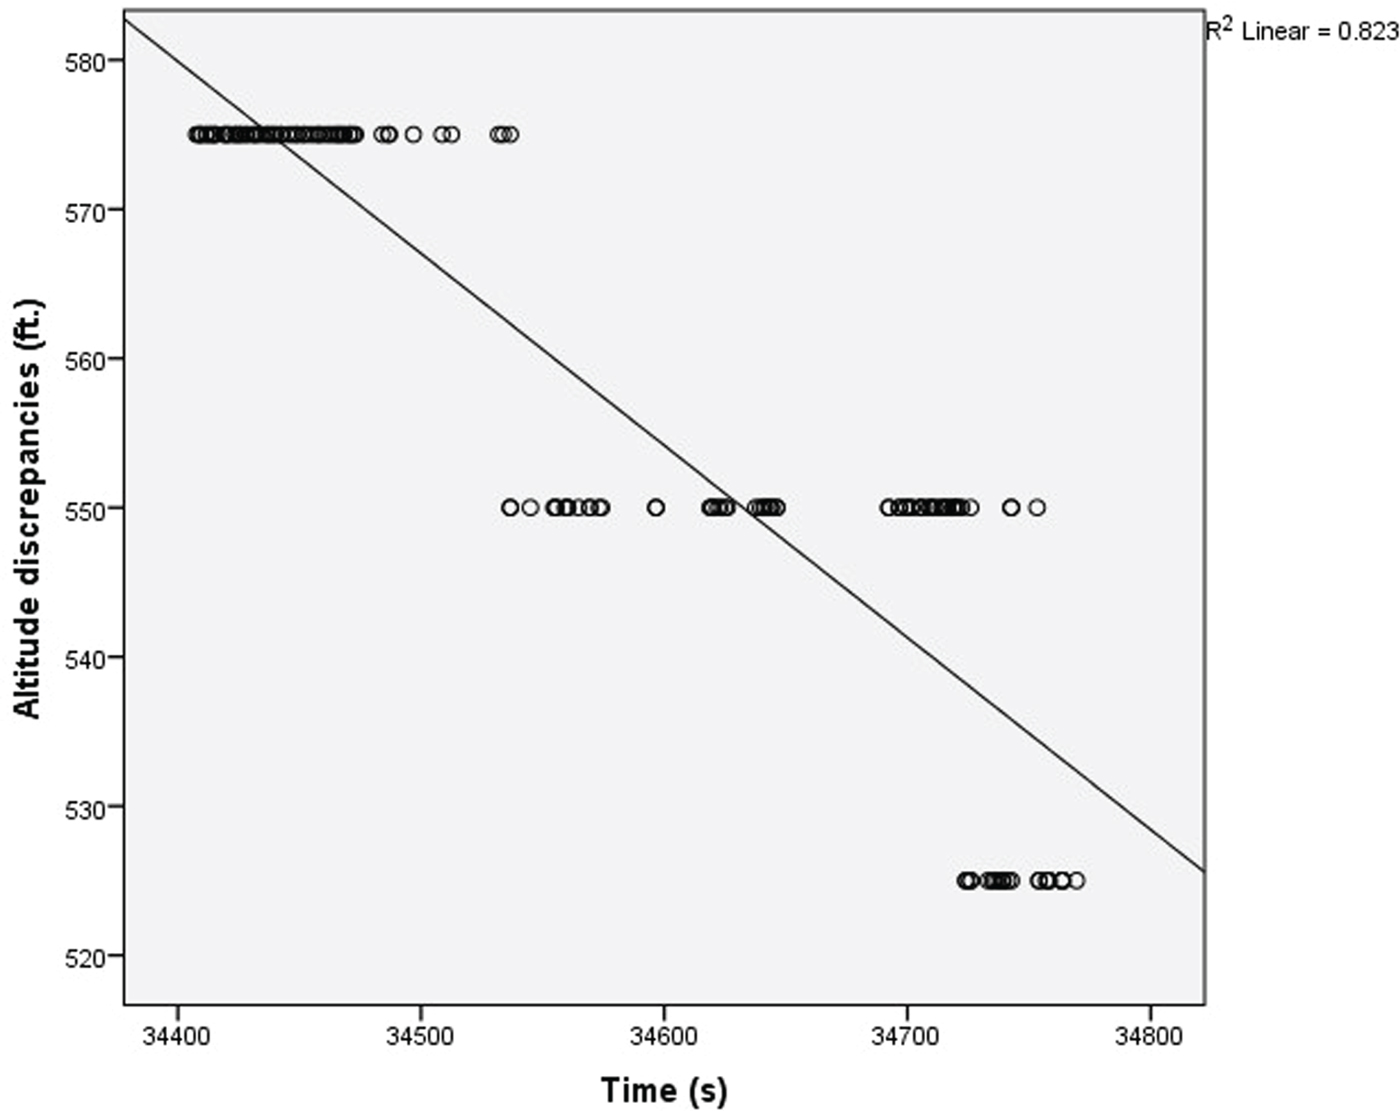
Barometric and geometric altitude of each aircraft were plotted against time. Visual inspection of the plots showed that most of the time the barometric altitude will display higher readings than the geometric altitude. This could be due to temperature change whereby lower temperature than the ISA standard temperature will translate into a higher barometric reading. Furthermore, the discrepancies between the two altitudes increased during aircraft climbs and decreased as aircraft descended (see Figures 3 and 4).

Figure 3. Barometric altitude and geometric altitude plot against time for Aircraft-5 while climbing.
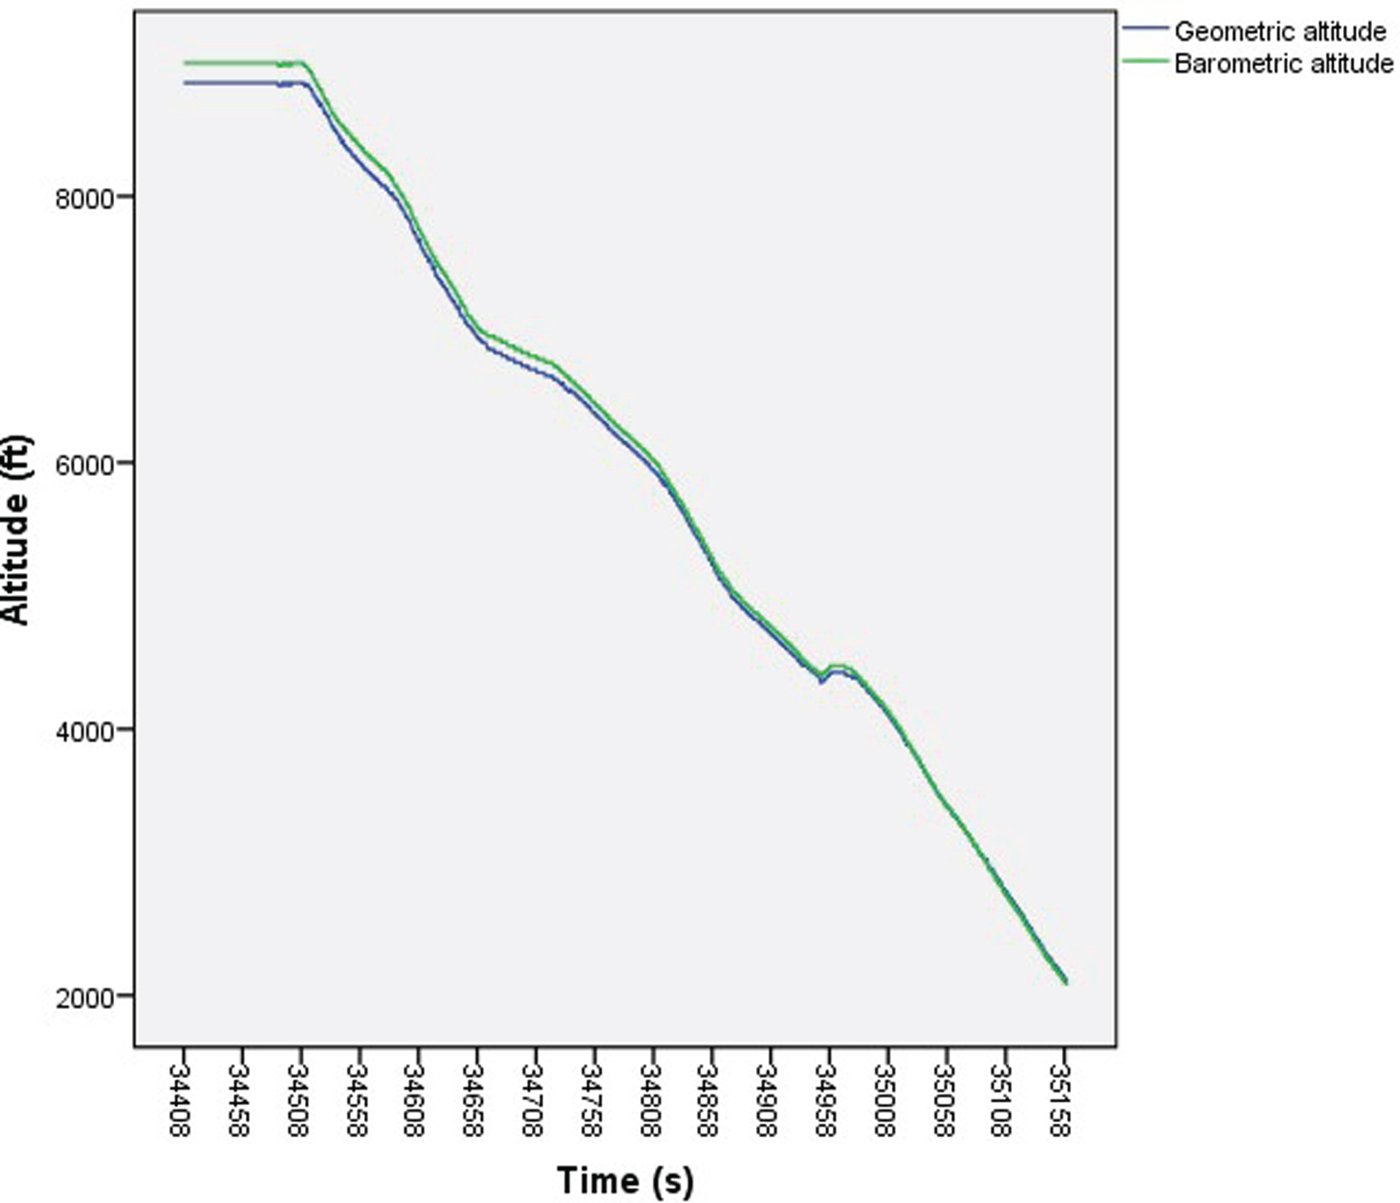
Figure 4. Barometric altitude and Geometric altitude plot against time for Aircraft-6 while descending.
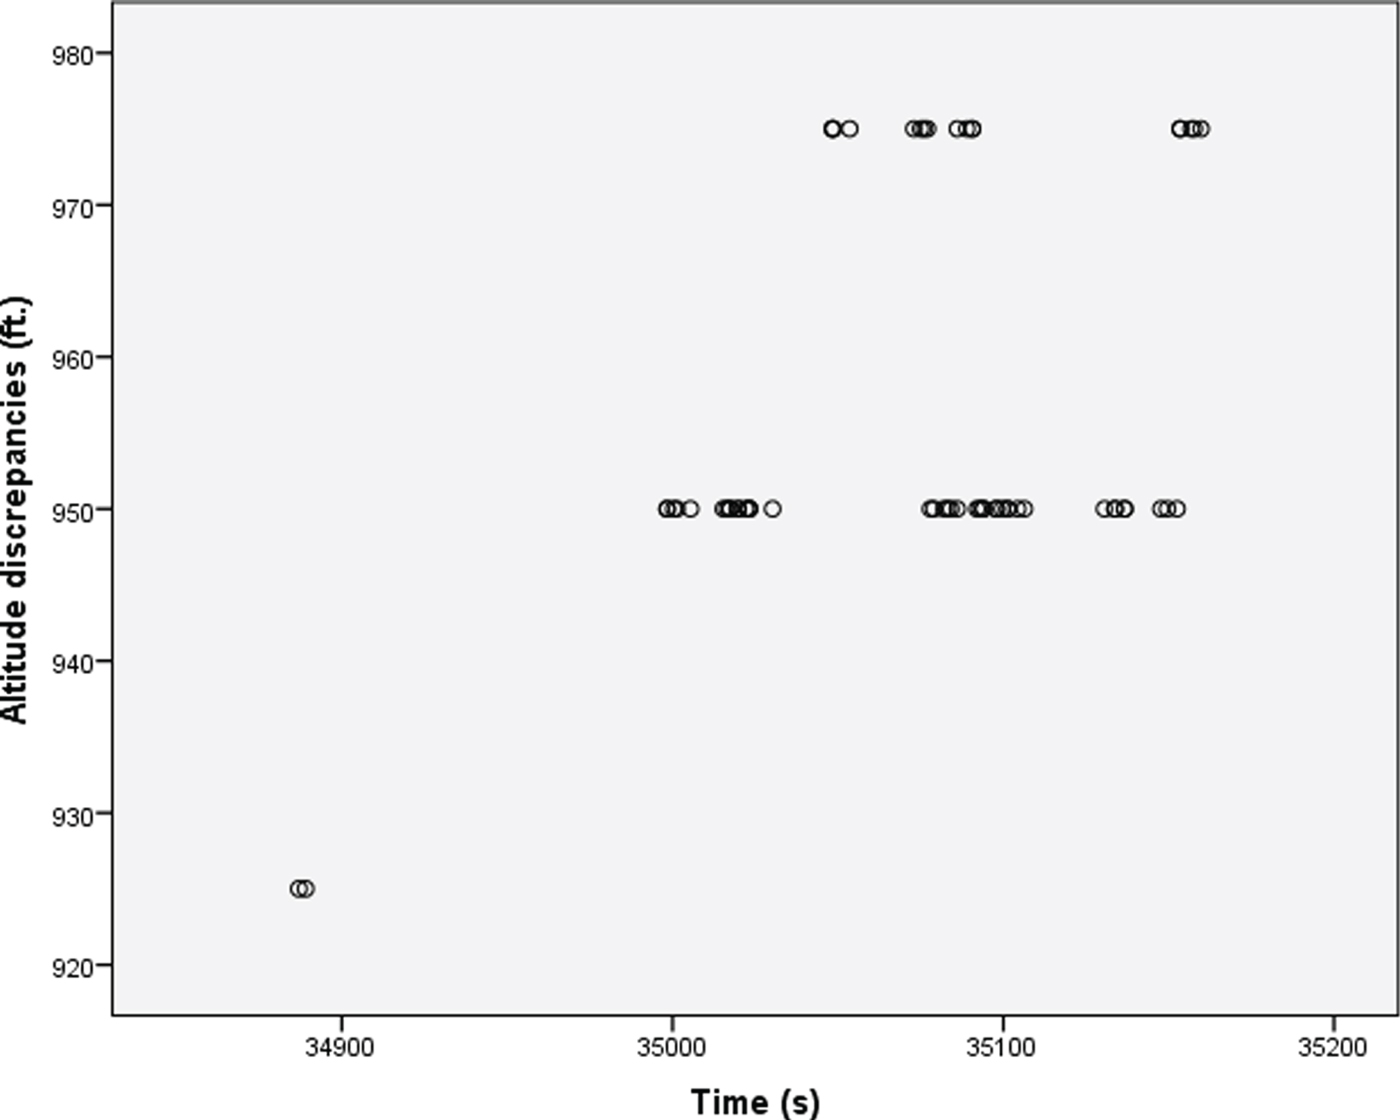
In addition, some aircraft displayed altitude discrepancy fluctuations over a small range during the cruising phase. For example, the altitude discrepancies for Aircraft-7 fluctuated by ±25 feet around the 950 feet discrepancy (see Figure 5). The maximum discrepancy was 975 feet while the minimum discrepancy was 925 feet.

Figure 5. Altitude discrepancies over time for Aircraft-7 while cruising.
Analysis of other cruising aircraft showed a gradual decrease in altitude discrepancies over time. However, the reductions were only of small magnitude. For example, the decrement in altitude discrepancy for Aircraft-8 was 75 feet throughout the recorded cruising phase of the flight (see Figure 6) and the decrement in altitude discrepancy for Aircraft-9 was only 50 feet (see Figure 7).
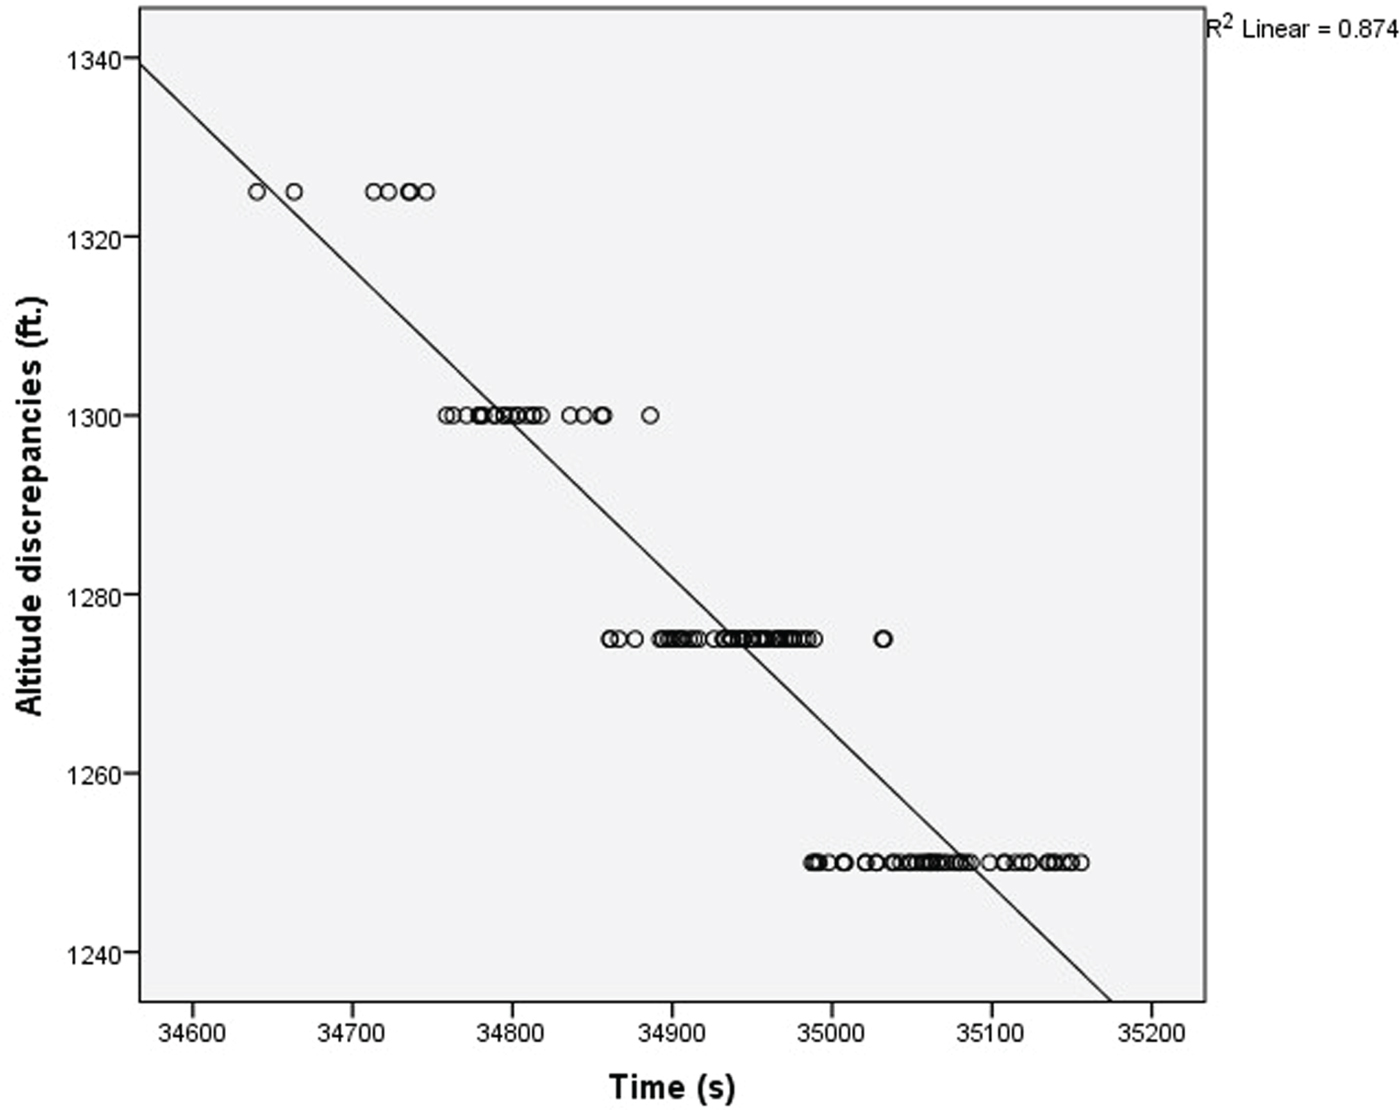
Figure 6. Altitude discrepancies over time for Aircraft-8 while cruising.

Figure 7. Altitude discrepancies over time for Aircraft-9 while cruising.
Next, the altitude discrepancies variable was derived by finding the deviation between the geometric altitude and barometric altitude. Tests of significance were conducted to find association of the discrepancies with the aircraft makes and models, GPS receiver model and phases of flight. If the results were significant, post hoc tests were used to further determine as to where the differences occur within the groups of the potentials factors. The Scheffe Post Hoc (Field, Reference Field2013) Test was chosen due to the unequal sample size per group. Prior to conducting any parametric or non-parametric tests, normality assumption of the data distribution was checked using a Shapiro-Wilk (Field, Reference Field2013) normality test while the homogeneity of variances assumption was verified using a Levene's test.
An ANOVA test was conducted in order to test if there was a significant difference in the average of altitude discrepancies among the phases of flight. The phases of flight variables were specified as climbing, cruising and descending according to the aircraft flight level pattern throughout the recorded flight duration. A factorial analysis was conducted using two-way ANOVA to determine whether GPS receiver models, flight phases and their interaction effect had an influence on the altitude discrepancies. The different GPS receiver models available in this study included Thales TLS755 MMR, Honeywell Mercury Card equipped EGPWC MkV, Honeywell GNSSU and Rockwell Collins GLU920 MMR. In this 4 × 3 factorial design, the two main effects were the GPS receiver models and phases of flight. The factorial analysis also enabled us to examine the interaction effect between the two independent variables on the altitude discrepancies. The ANOVA test was conducted to determine whether the differences in altitude discrepancies among the aircraft makes and models are significant for descending phase while a non-parametric Kruskal-Wallis test was done for the cruising phase. This is because it was later identified that the assumption of homogeneity of variances was violated for the cruising phase but was accepted for the descending phase. The different aircraft makes and models available for this study include Airbus A318, A319, A320, Boeing B747-400, B767-300 and B777-200. A two-way ANOVA was not conducted because the homogeneity of variances assumption was violated.
5.2. Variation factors
5.2.1. Phases of flight
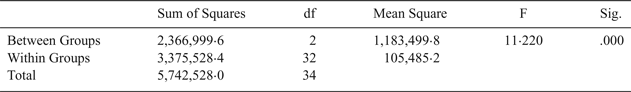
Initial visual inspection on the means plot shown in Figure 8 shows differences of mean altitude discrepancies among the three phases of flight with the cruising phase having the largest mean altitude discrepancies. An ANOVA test was conducted to determine whether the differences were significant.
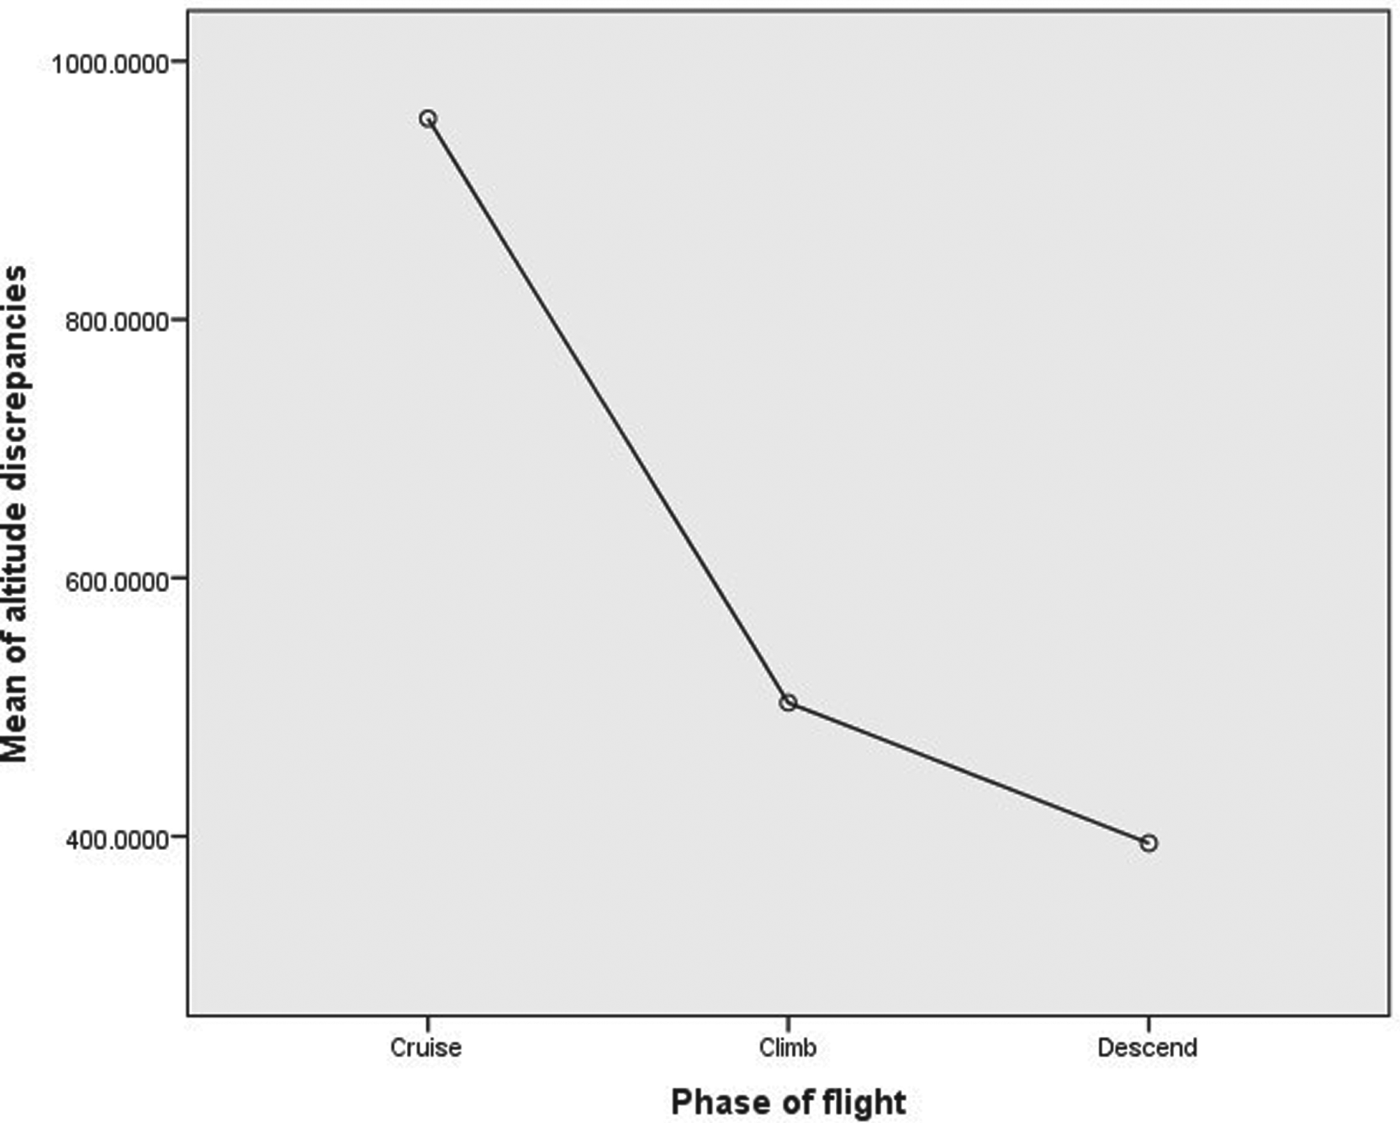
Figure 8. Means plot for altitude discrepancies versus phases of flight.
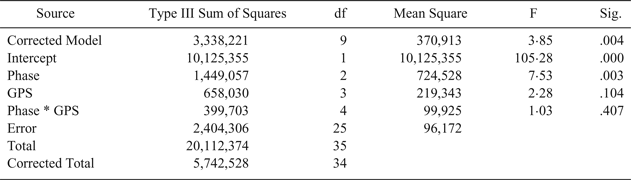
Results from the Shapiro-Wilk test (p > 0·05) showed that the altitude discrepancy data are approximately normally distributed for all the three phases of flight. The Levene's test (p > 0·05) verified the equality of variances assumption in the samples. The ANOVA test (Table 1) indicates that, at a 5% level of significance, there are statistically significant differences (F = 11·22, p < 0·05) between the altitude discrepancies among the three phases of flight.
Table 1. ANOVA test for altitude discrepancies vs. phase of flight

Scheffe's multiple comparison test results showed that the mean altitude discrepancies between cruising and climbing phase and cruising and descending phase are statistically significant (mean difference = 452 feet, p-value < 0·05 and mean difference = 561 feet, p-value < 0·05, respectively). The differences could be due to the different altimeter setting during the three phases of flight. When an aircraft is above the LTMA transition altitude of 6,000 feet, a standard altimeter setting is set to follow the ISA standard pressure and temperature. Thus, any deviation from the ISA standard will contribute to the discrepancies between the barometric and geometric altitude since the latter is acquired directly from GNSS and not prone to errors due to an ISA non-standard day.
When an aircraft is below the LTMA transition altitude of 6,000 feet, the ATC sends out QNH information for the altimeter setting. The QNH is based on the actual sea level pressure of the region and thus the barometric altitude accuracy below 6,000 feet is always better than that of above 6,000 feet. Therefore, the altitude discrepancies are seen to be increasing as the aircraft climbs and gets further away from the ATC reporting station where the local QNH is measured. The altitude discrepancies decrease as an aircraft descends and gets nearer to the ATC reporting station/airport.
5.2.2. GPS receiver model
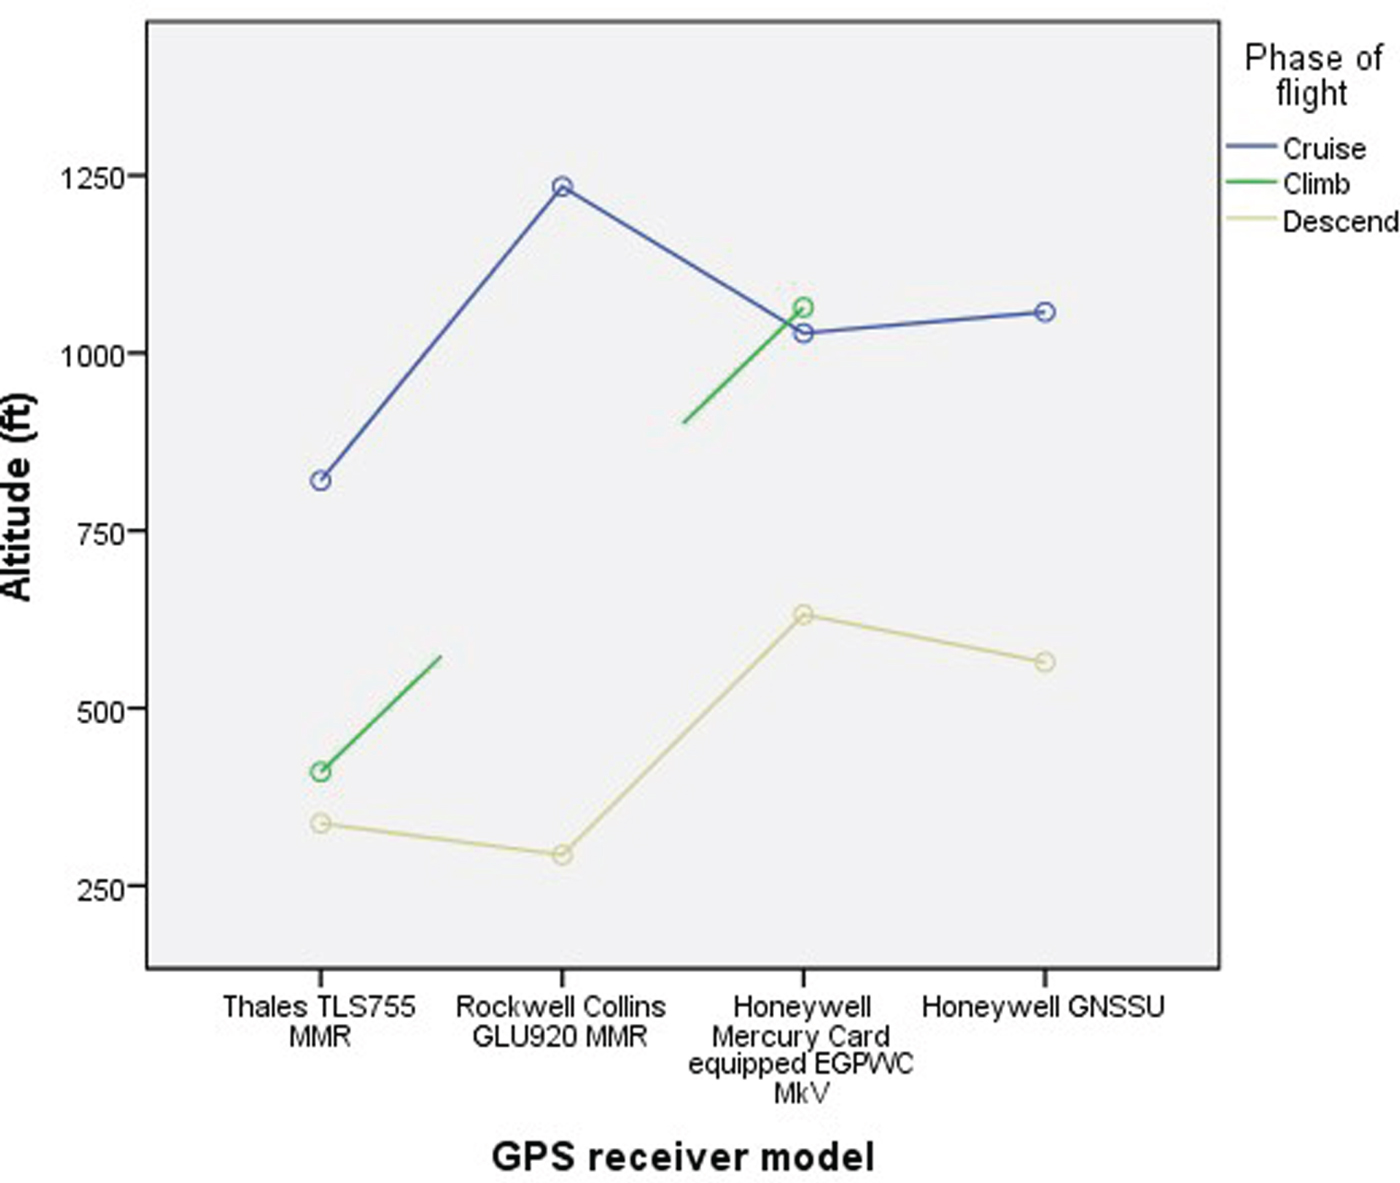
The results in Table 1 show that phases of flight do have an impact on discrepancies between the barometric and geometric altitudes. Therefore, it is somewhat unfair to compare the effect of GPS receiver models on the altitude discrepancies per se, unless the comparison is carried out on the same flight phase. The means plot in Figure 9 indicates the differences in mean altitude discrepancies among four GPS receiver models based on the phases of flight. Figure 9 also shows that there is an intersection between the two lines which suggests the possibility of an interaction between the effect of GPS receiver model and phases of flight on the altitude discrepancies. A two-way ANOVA test was conducted to determine whether the interaction effects are significant.

Figure 9. Estimated marginal means of altitude discrepancies versus GPS receiver models based on phases of flight.
Results from the Shapiro-Wilk test show that the altitude discrepancies data are normally distributed. Levene's test (p > 0·05) verified the equality of variances assumption in the samples. Results from the two-way ANOVA test in Table 2 indicate that the interaction effect between the GPS receiver models and phases of flight on the altitude discrepancies are non-significant (F = 1·03, p > 0·05). Thus, the results suggest that there is no significant difference overall between the altitude discrepancies and the GPS receiver models.
Table 2. Two-way ANOVA test for altitude discrepancies vs. GPS receiver models based on phases of flight
5.2.3. Aircraft make and model
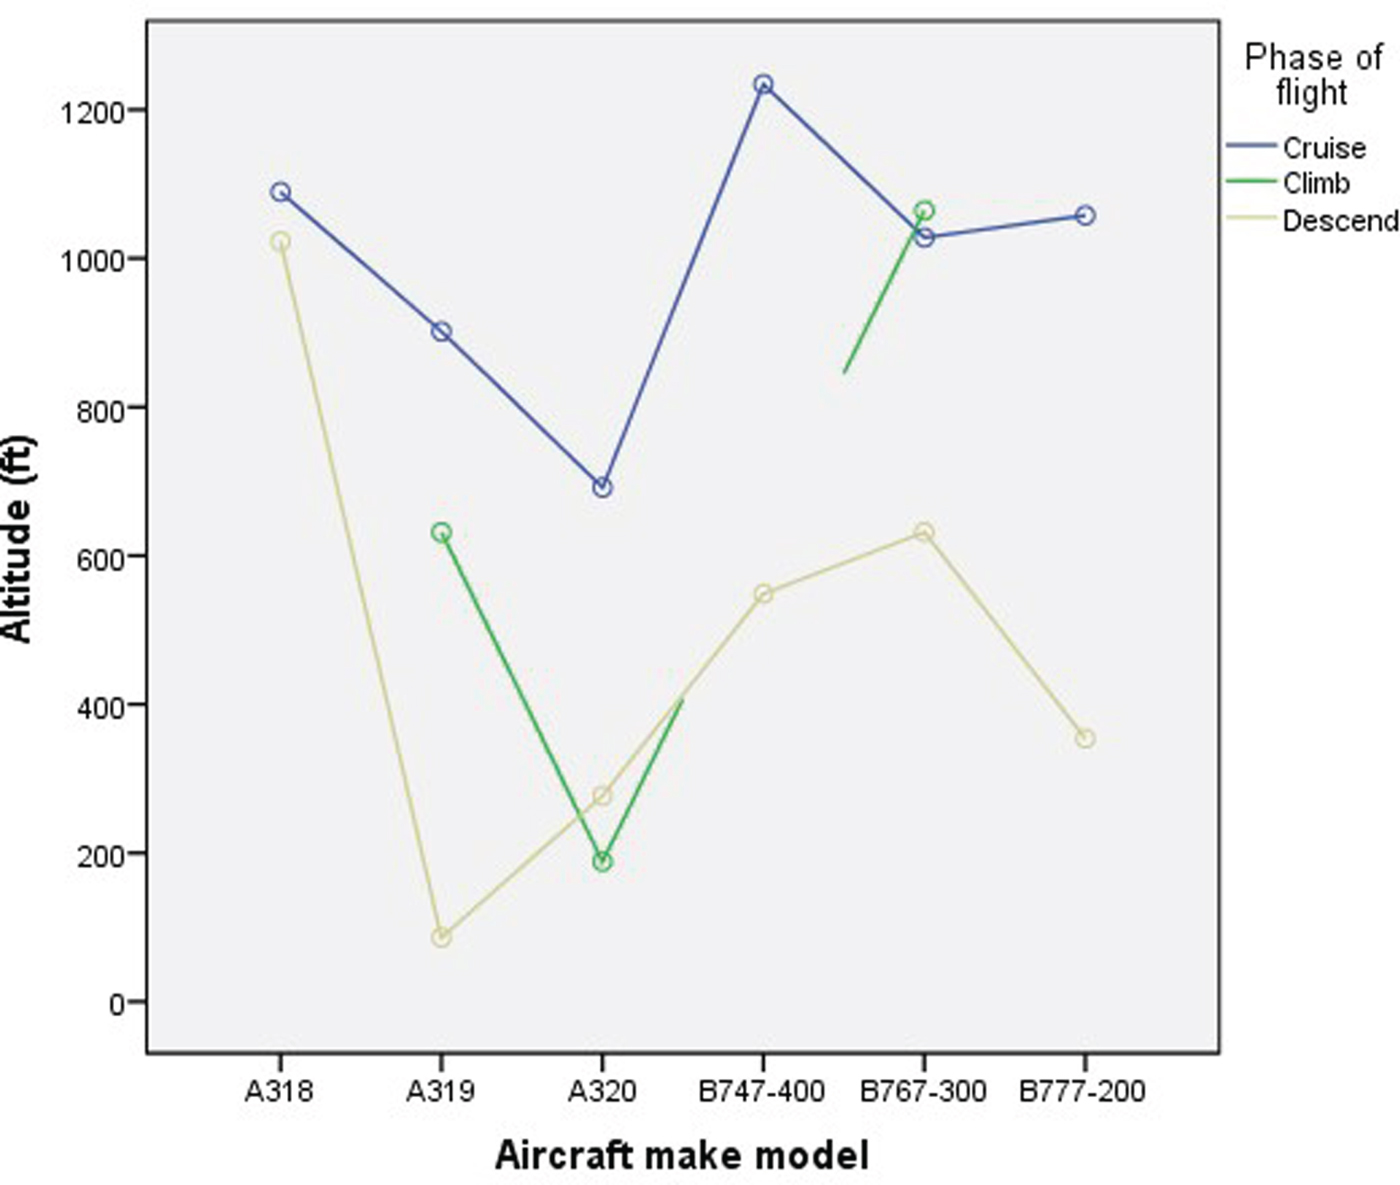
By using the same reasoning previously explained, the aircraft make and model effect on altitude discrepancies is analysed based on the phases of flight. The means plot in Figure 10 indicates differences in mean altitude discrepancies among the six aircraft make-models based on the phases of flight.

Figure 10. Estimated marginal means of altitude discrepancies versus aircraft makes and models based on the phases of flight.
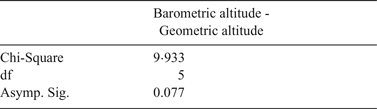
Significance tests are chosen based on whether the homogeneity of variance assumption is violated or accepted for the phases of flight. For the cruising phase, results from the Shapiro-Wilk test (p > 0·05) showed that the altitude discrepancies data are approximately normally distributed for all the six aircraft makes and models. The non-parametric Kruskal-Wallis test in Table 3 indicates that, at 5% level of significance, there are no statistically significant differences (X 2 = 9·933, p > 0·05) between the altitude discrepancies and aircraft makes and models during the cruising phase.
Table 3. Kruskal-Wallis test for altitude discrepancies versus aircraft make-models for cruising phase

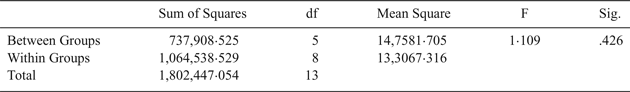
For the descend phase, results from Shapiro-Wilk test (p > 0·05) showed that the altitude discrepancies data are normally distributed for all six aircraft makes and models. Levene's test verified the equality of variances assumption in the samples (p > 0·05). The ANOVA test in Table 4 indicates that, at 5% level of significance, there are no statistically significant differences (F = 1·109, p > 0·05) between the altitude discrepancies and aircraft makes and models during the descent phase.
Table 4. ANOVA test for altitude discrepancies versus aircraft make-models for descend phase

6. ALTITUDE DATA INTEGRITY IN ADS-B MESSAGES
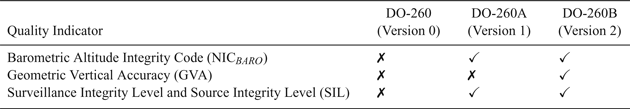
As discussed in the previous sections, ADS-B messages include both barometric and geometric altitude information. However, it is crucial to know the quality of the altitude information included in the messages to ensure safety. ADS-B Out versions have evolved from version zero (0) to version two (2). The requirements and capabilities of each version have developed over time and are based on technological advances in navigation equipment centred on GPS satellites, ground-based equipment and aircraft equipment. The latter version contains more data elements, particularly quality indicators of the state vector information. For example, Navigation Integrity Category (NIC) encodes the integrity bound, on the basis of Horizontal Protection Limit (HPL) provided by the GPS receiver, as a numerical value, from 0 to 11. The higher the value, the higher the horizontal position integrity.
The quality indicators for altitude data include Barometric Altitude Integrity Code (NICBARO), Surveillance Integrity Level (SIL) and Geometric Vertical Accuracy (GVA). The NICBARO parameter is a one-bit flag used to indicate if the barometric altitude being reported in the ADS-B message has been cross-checked against another source of pressure altitude. Field value one (1) would indicate the integrity of the barometric altitude value has been checked while field value zero (0) would indicate it has not been checked. However, if the aircraft is of ADS-B version zero (0) and the ADS-B ground stations are of ADS-B version one (1) or two (2), the NICBAROvalue will be zero (0). The version zero (0) ADS-B Messages do not include information related to the cross-checking of barometric altitude. Therefore, aircraft broadcasting version zero (0) ADS-B messages will not include the NICBARO field in the message.
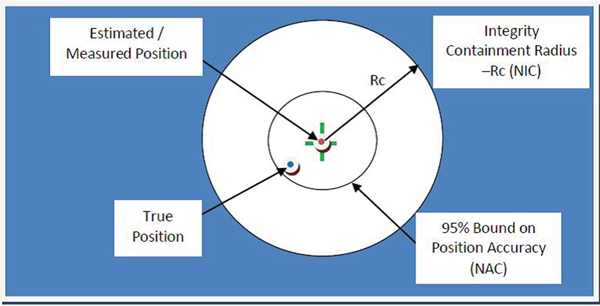
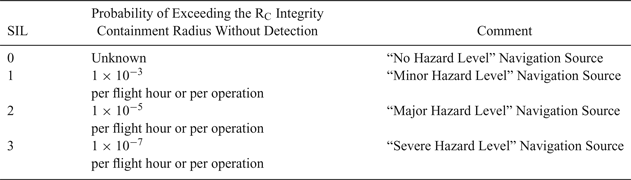
Surveillance Integrity Level (SIL) or also known as Source Integrity Level (SIL) is defined as the probability of integrity containment radius used in the Navigation Integrity Category (NIC) parameter being exceeded without detection (ICAO, 2012). Figure 11 illustrates the coded performance parameter for ADS-B based on GPS as a navigation source.
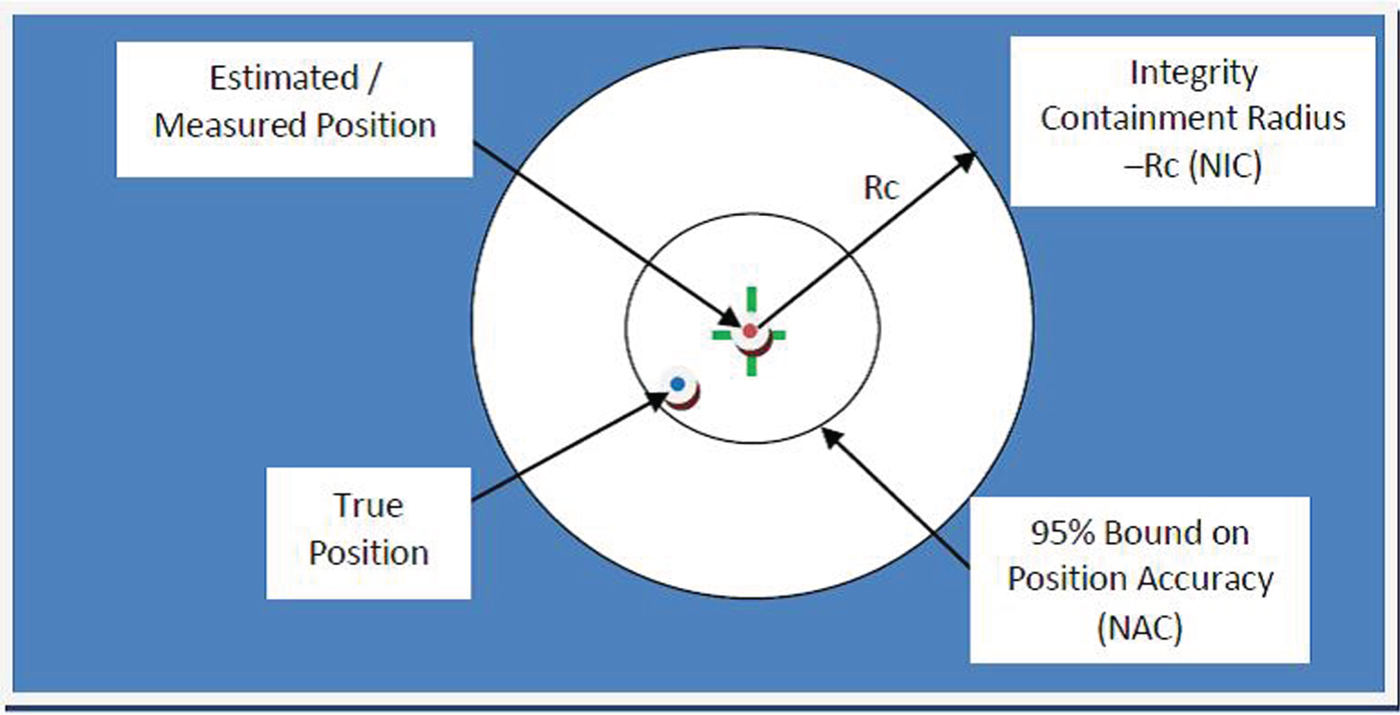
Figure 11. Coded performance parameters for ADS-B (modified from (ICAO, 2012)).
The GPS Horizontal Protection Level (HPL) is encoded as the NIC at a SIL corresponding to 10−7 per hour, which is equivalent to SIL=3. ADS-B surveillance safety is assured by the NIC/SIL integrity parameters (ICAO, 2012). SIL information will be even more important when the position of the aircraft is determined by an on board system that combines GNSS and an Inertial Navigation System (INS) and other navigation sources such as Distance Measuring Equipment (DME-DME)), to which end the aircraft should transmit the highest SIL that position sensors can support, so that it can be used in more demanding applications. Table 5 provides a SIL encoding interpretation. The SIL parameter can be used to gauge the geometric altitude integrity in the ADS-B messages.
Table 5. SIL encoding interpretation

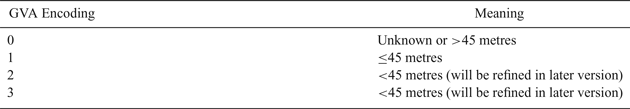
The Geometric Vertical Accuracy (GVA) parameter is derived using the Vertical Figure of Merit (VFOM) (95%) from the GNSS position source used to encode the geometric altitude field in the ADS-B message. The encoding is presented as numerical value 0 to 3 as tabulated in Table 6. Table 7 summarises availability of the altitude quality indicators in all three ADS-B versions.
Table 6. Encoding of the Geometric Vertical Accuracy (GVA)

Table 7. Availability of the altitude quality indicators in ADS-B version 0, 1 and 2

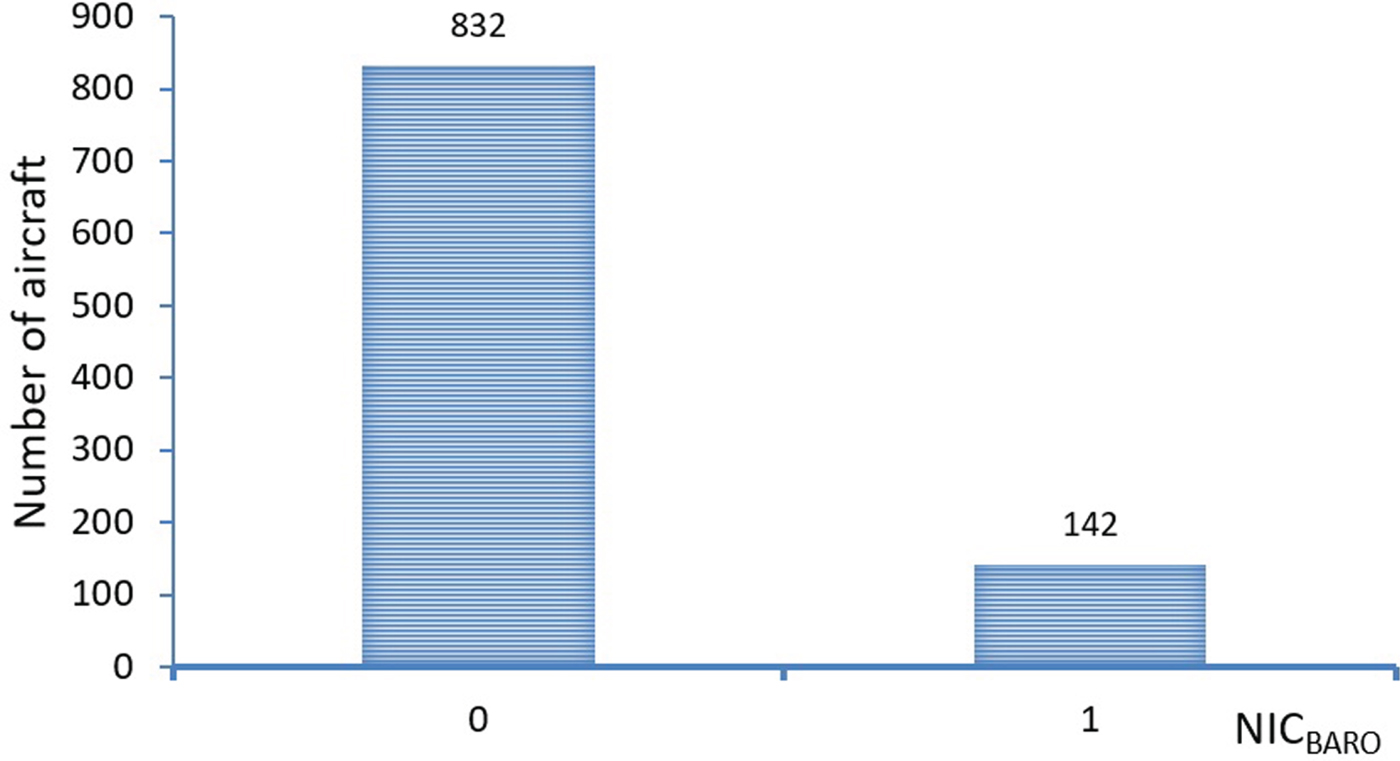
6.1. Barometric altitude integrity analysis
In this section, integrity of the barometric altitude values in the ADS-B messages are analysed using the NICBARO indicator. 38 aircraft did not have the NICBARO field present in their ADS-B message broadcast. This is because the aircraft were broadcasting version zero (0) ADS-B messages. The analysis in Figure 12 shows that only 142 aircraft had cross-checked their broadcast barometric altitude values against another sources of pressure altitude, while the remaining 832 aircraft in the sample data did not perform the check. Hence, integrity of their barometric altitude values broadcast is not verified.

Figure 12. Barometric Altitude Integrity Code (NICBARO) analysis for all aircraft.
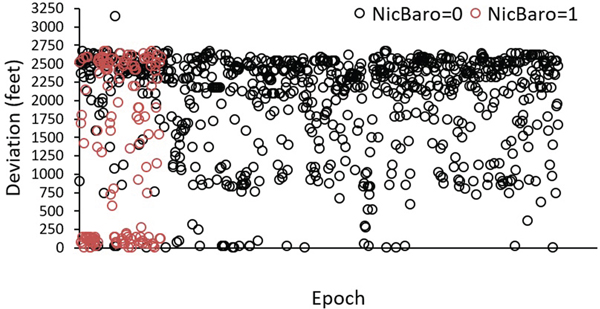
The next analysis (Figure 13) was conducted to see the correlation between the altitude deviation and the NICBARO indicator. Based on the analysis, 832 aircraft with NICBARO = 0, it was indicated that 799 were showing an altitude deviation greater than 245 feet while 90 of 142 aircraft with NICBARO = 1 indicated a deviation greater than 245 feet. Therefore, no obvious correlation was found between the Barometric Altitude Integrity Code (NICBARO) and deviation between the geometric and barometric altitude.

Figure 13. Correlation between Barometric Altitude Integrity Code (NICBARO) and altitude deviation.
6.2. Navigation source integrity analysis
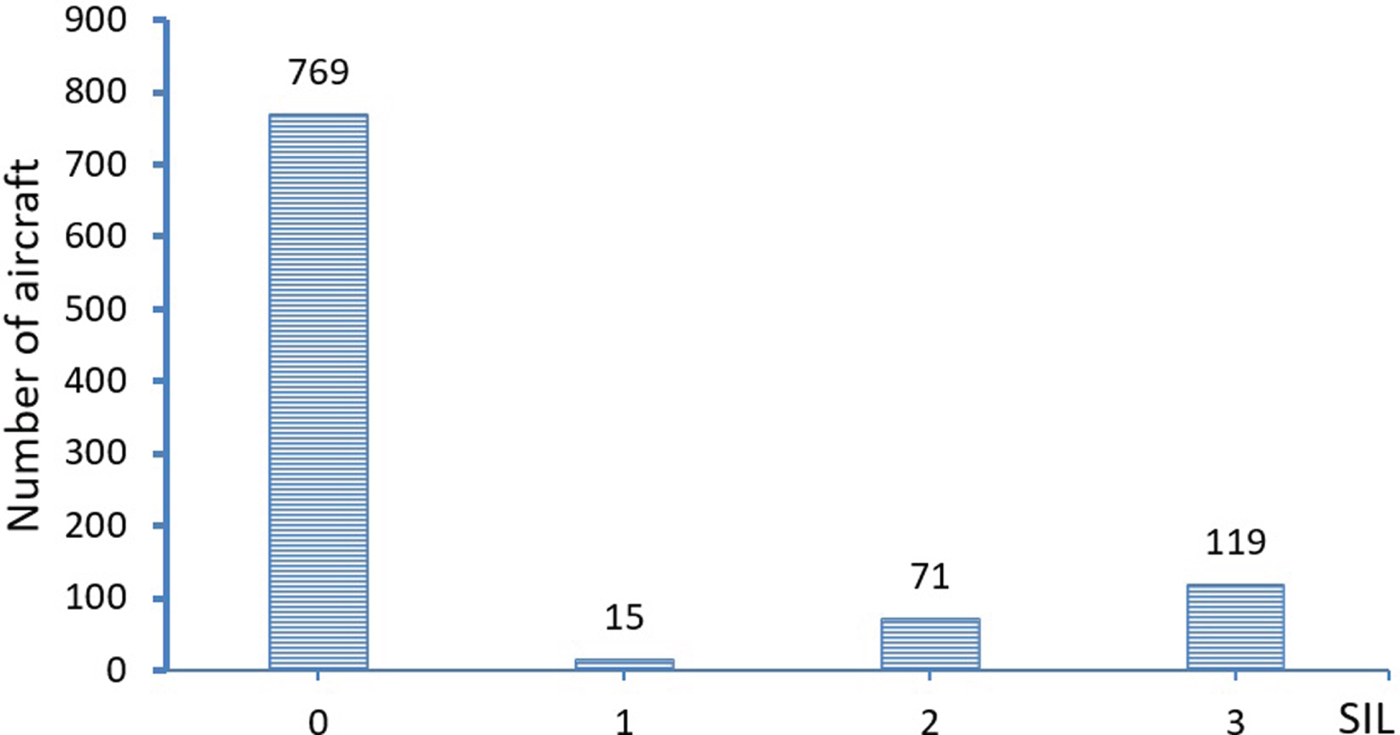
As discussed, the Source Integrity Level (SIL) indicator value provides an integrity level for the navigation source used to derive ADS-B horizontal and vertical (geometric altitude) positioning information. 38 aircraft did not have the SIL field present in their ADS-B message broadcast. Figure 14 shows the analysis results where 769 aircraft showed SIL = 0, indicating no hazard level for the navigation source, 15 aircraft showed SIL = 1, indicating a minor hazard level for the navigation source, 72 aircraft showed SIL = 2, indicating a major hazard level for the navigation source, and 119 aircraft showed SIL = 3, indicating a severe hazard level for the navigation source.

Figure 14. Source Integrity Level (SIL) analysis.
7. DISCUSSION AND CONCLUSION
This paper has analysed availability and characteristics of geometric and barometric altitude data, and altitude quality indicator data in ADS-B messages in order to investigate further the relevance of ADS-B altitude data in aviation where questions have arisen over recent years regarding its potential benefit. The paper then measured the discrepancies of the geometric altitude from the barometric altitude data and potential factors that could have influenced the variations were investigated. One characteristic of the geometric altitude that is of interest is the possibility of the loss of geometric altitude from ADS-B messages either partially or totally. Availability analysis showed that only 98·9% of geometric altitude data is broadcast in the ADS-B messages from the sample aircraft. The compliance of barometric altitude to operate in RVSM airspace were also analysed. Results indicated that only 8·7% of the aircraft analysed in the sample were compliant to operate in RVSM airspace.
Further findings have shown that different phases of flight contribute to the deviation between geometric altitude and the barometric altitude. Post hoc tests then identified that the altitude discrepancies between cruising phase and other phases of flight are significantly different. Climbing phase and descending phase however do not have significant differences between their altitude discrepancies. Secondly, the results also showed that the GPS receiver model made no contribution to the altitude discrepancies. Finally, results from separate significance tests suggest that whether an aircraft is at cruising phase or descent phase, the aircraft makes and models do not have correlation with altitude discrepancies.
In addition, the work in this paper has identified and verified use of the altitude integrity parameters to verify integrity of the altitude information provided in the ADS-B messages. These include the NICBARO and SIL indicator values. These values can be used as safety barriers in future ground/airborne applications where altitude data from ADS-B is used as the source. Based on the sample data analysis, it is important to highlight that all the altitude quality indicators are only available in ADS-B version 2 (DO-260B). Therefore, despite the cost impact, it is crucial for airlines to equip their aircraft with at least ADS-B version-2 when ADS-B becomes mandatory for flight. This is important in ensuring compliance to many future applications that may utilise the quality indicator parameters as safety barriers for the application functionalities.
The anomalies and obvious discrepancies found in this work may lead to safety concerns when the altitude information from ADS-B data is planned to be used in various ATC operations and aircraft navigation support tools. Therefore, the results in this paper may be used to perform various mitigation actions to ensure safety.
In future work, the authors are planning to develop a software system to measure ASE using ADS-B and other methods. The system may be useful for all Air Navigation Service Providers (ANSPs).